

The DOI matches its Crossref record; 29 of the 29 references it cites were found in a registry or an index; 14 of the 34 sources its claims cite were checked for support.
Distribution of miRNA expression across human tissues
Open accessAbstract
We present a human miRNA tissue atlas by determining the abundance of 1997 miRNAs in 61 tissue biopsies of different organs from two individuals collected post-mortem. One thousand three hundred sixty-four miRNAs were discovered in at least one tissue, 143 were present in each tissue. To define the distribution of miRNAs, we utilized a tissue specificity index (TSI). The majority of miRNAs (82.9%) fell in a middle TSI range i.e. were neither specific for single tissues (TSI > 0.85) nor housekeeping miRNAs (TSI < 0.5). Nonetheless, we observed many different miRNAs and miRNA families that were predominantly expressed in certain tissues. Clustering of miRNA abundances revealed that tissues like several areas of the brain clustered together. Considering -3p and -5p mature forms we observed miR-150 with different tissue specificity. Analysis of additional lung and prostate biopsies indicated that inter-organism variability was significantly lower than inter-organ variability. Tissue-specific differences between the miRNA patterns appeared not to be significantly altered by storage as shown for heart and lung tissue. MiRNAs TSI values of human tissues were significantly (P = 10(-8)) correlated with those of rats; miRNAs that were highly abundant in certain human tissues were likewise abundant in according rat tissues. We implemented a web-based repository enabling scientists to access and browse the data (https://ccb-web.cs.uni-saarland.de/tissueatlas).
Overview
AI snapshot
Written from the paper’s full text.
TL;DR
This paper presents a human miRNA tissue atlas by profiling 1,997 mature miRNAs across 61 post-mortem tissue biopsies from two male individuals, with 1,364 miRNAs detected in at least one tissue and 143 detected in all tissues. It reports tissue-specific miRNA patterns, a web repository, and conserved tissue specificity between human and rat.
Key findings
- Of 1,997 mature miRNAs, 633 (31.7%) were not detected in any tested tissue; 1,364 were detected in at least one tissue, and 143 (10.5%) were found in all tissues.
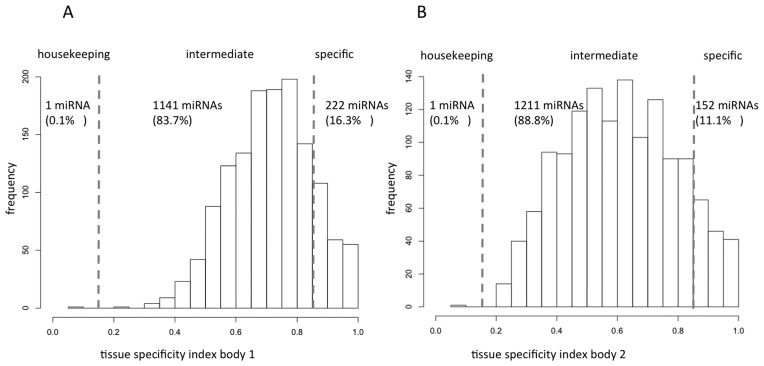
- Most detected miRNAs had intermediate tissue specificity: 82.9% fell in a middle TSI range, neither tissue-specific (TSI > 0.85) nor housekeeping (TSI < 0.5); in quantile-normalized data, 83.7% of miRNAs in the first body and 88.8% in the second body had intermediate TSI values.
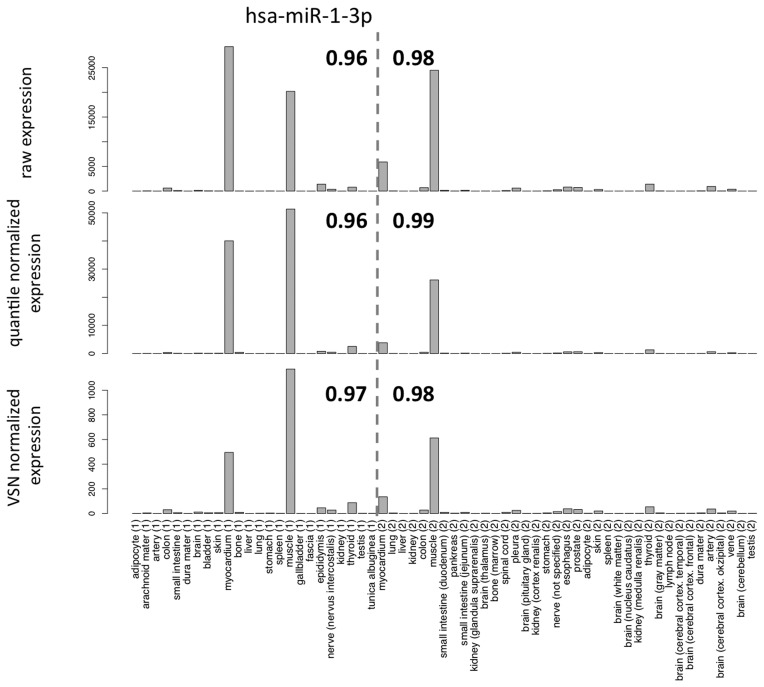
- Tissue-specific examples included miR-1–3p as the overall most tissue-specific miRNA, high in muscle and myocardium; miR-122–5p in liver, miR-7–5p in pituitary gland, miR-205–5p in skin, and miR-507/miR-514a-3p/miR-509–5p in testis.
- Human and rat tissue specificity was significantly correlated (TSI correlation 0.362, P = 9 × 10⁻⁸; permutation average correlation 0), and inter-individual variability was significantly lower than inter-organ variability in lung and prostate analyses (P < 10−16).
Methods
- Profiled 61 tissue biopsies from two male cadavers (65-year-old with multiple myeloma; 59-year-old with no signs of cancer) using Agilent SurePrint 8 × 60K Human V19 miRNA microarrays, covering 1,997 human miRNAs present in both miRBase V19 and V21.
- Pre-analytics included 44 tissue miRNomes for reproducibility and storage/degradation analyses, 16 additional normal lung biopsies from different individuals, and GEO datasets from normal gastric and prostate tissues.
- Calculated a tissue specificity index (TSI) for each miRNA, performed hierarchical clustering, miRNA family and co-expression analyses, and compared human TSI values with rat data from GEO series GSE52754; analyses used raw, quantile-normalized, and variance-stabilized normalized data.
Limitations
- The paper states that autopsy samples from only two male individuals provide only a snapshot of full miRNA expression variability, and that age, sex, and disease status can influence miRNA patterns.
- The authors state they cannot exclude that some tissue-specific miRNAs might be affected by sample degradation, although storage between 1 and 14 days at 4°C had limited overall impact on tissue miRNA patterns.
- The paper notes that microarray analysis cannot detect presently unknown miRNAs or miRNA isoforms, and that normalization choice can substantially influence results; these are stated limitations of the platform and analysis approach.
Model-written summary. Check it against the paper before relying on it.
Integrity signals
Registry
Cites
Statistics
Figures
Verification
Claims the paper makes
83 Own result · 15 No full text of the sources · 7 Supported · 6 Own method · 6 Own interpretation · 5 Partly supported · 1 Not checked yet · 1 No basis given · accuracy not yet measured
Every source the paper cites for this claim was checked and supports it.
In the paper
“Irrespective of the normalization technique we found higher TSI values for miRNAs as, e.g. known from mRNAs (7).”
§ Distribution of miRNA expression across human tissues > DISCUSSION
What the sources say
- Supportedcites [7] source
The citation supplies the mRNA gene-expression baseline for the citing authors’ comparison, not their finding about miRNAs. In “Distribution of tissue specificities,” the source defines the tissue-specificity index τ and reports its distribution across gene-expression profiles, including that 57% have intermediate values. It does not need to report miRNA values or test the citing authors’ normalization methods to support that cited baseline. (LLM, conf=0.88)
boostedcorrelationaln = 9- Asserted: passes — The authors put it forward as true.
- Checkable: passes — It can be checked against evidence.
- Load-bearing: passes — The paper’s conclusions depend on it.
- Based: passes — The paper gives a reason why it holds.
- Supported
Every source the paper cites for this claim was checked and supports it.
In the paper
“When we compared our data to a data set on 55 different rat tissues available at GEO database (8), we could confirm conserved tissue-specific expression of several miRNAs, including miR-133b, miR-124 and miR-9.”
§ Distribution of miRNA expression across human tissues > DISCUSSION
What the sources say
- Supportedcites [8] Minami, 2014, miRNA expression atlas in male rat, Sci. Data source
The citation identifies the dataset used for the citing authors’ comparison, not the authors’ own confirmation of specific miRNAs. The source’s Background & Summary describes profiles from 55 rat organs or tissues, and Data Records identifies their GEO accession as GSE52754 (pages not specified in our copy). (LLM, conf=0.94)
hedgedcorrelational- Asserted: passes — The authors put it forward as true.
- Checkable: passes — It can be checked against evidence.
- Load-bearing: passes — The paper’s conclusions depend on it.
- Based: passes — The paper gives a reason why it holds.
- Supported
Every source the paper cites for this claim was checked and supports it.
In the paper
“But they also clearly state that ‘even samples with the most degraded RNAs still preserve a tissue-specific miRNA signature’.”
§ Distribution of miRNA expression across human tissues > DISCUSSION
What the sources say
- Supportedcites [15] source
The Results section (‘miRNA expression profiling of degraded RNAs’) states the quoted claim directly, based on hierarchical clustering of liver and duodenum samples. The finding concerns preservation of a tissue-specific signature, not reliable measurement of individual miRNAs; the same section reports that degradation can distort individual expression measurements. (LLM, conf=0.95)
boosted- Asserted: passes — The authors put it forward as true.
- Checkable: passes — It can be checked against evidence.
- Load-bearing: passes — The paper’s conclusions depend on it.
- Based: passes — The paper gives a reason why it holds.
- Supported
The cited sources support only part of this claim — read each source’s verdict below.
In the paper
“Elevated serum levels of liver-specific miR-122 have been detected in patients with drug induced liver injury, steatosis, hepatitis-B and -C infections and in patients with hepatocellular carcinoma (23–26).”
§ Distribution of miRNA expression across human tissues > DISCUSSION
What the sources say
- Not checked — no full text of the sourcecites [23] source
- Partly supportedcites [24] sourceExperimental — accuracy not yet measured
The Discussion describes miR-122 as liver-enriched and responsive in serum after acetaminophen overdose; Figure 2 compares its serum levels in overdose patients and controls. The Discussion also associates it with hepatitis B, but the copy does not establish elevated serum miR-122 in patients with steatosis, hepatitis C, or hepatocellular carcinoma. Those conditions make the full claim broader than this source supports. (LLM, conf=0.85)
- Partly supportedcites [25] sourceExperimental — accuracy not yet measured
The Results report elevated serum miR-122 in simple steatosis or NASH. The Discussion describes elevated circulating miR-122 in viral and drug-related liver injury and an inverse circulating-versus-liver expression pattern in diseases ranging from viral hepatitis to liver cancer. It does not specifically establish elevated serum levels in hepatitis B, hepatitis C, or hepatocellular carcinoma patients; no page numbers are available in our copy. (LLM, conf=0.84)
- Not checked — no full text of the sourcecites [26] source
plaincorrelational- Asserted: passes — The authors put it forward as true.
- Checkable: passes — It can be checked against evidence.
- Load-bearing: unclear — It is unclear whether the paper’s conclusions depend on it.
- Based: passes — The paper gives a reason why it holds.
A result the paper reports from its own data — it cites no other source for it, so there is none to check. The quote shows it is in the paper.
In the paper
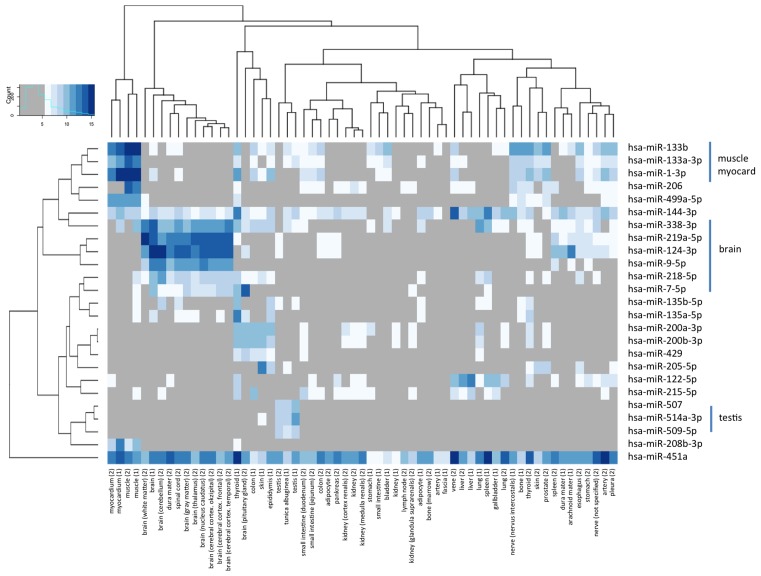
“The overall most tissue-specific miR-1–3p is presented in Figure 3.”
§ Distribution of miRNA expression across human tissues > RESULTS > Frequency of miRNAs per tissue and tissue specificity of miRNAs
plainn = 61- Asserted: passes — The authors put it forward as true.
- Checkable: passes — It can be checked against evidence.
- Load-bearing: unclear — It is unclear whether the paper’s conclusions depend on it.
- Based: passes — The paper gives a reason why it holds.
A result the paper reports from its own data — it cites no other source for it, so there is none to check. The quote shows it is in the paper.
In the paper
“For both, TSI values based on VSN- and quantile-normalized data, we did not found significant differences between -3p and -5p forms (P > 0.5 in both cases).”
§ Distribution of miRNA expression across human tissues > RESULTS > Tissue specificity of -3p and -5p mature forms
plain- Asserted: passes — The authors put it forward as true.
- Checkable: passes — It can be checked against evidence.
- Load-bearing: passes — The paper’s conclusions depend on it.
- Based: passes — The paper gives a reason why it holds.
A result the paper reports from its own data — it cites no other source for it, so there is none to check. The quote shows it is in the paper.
In the paper
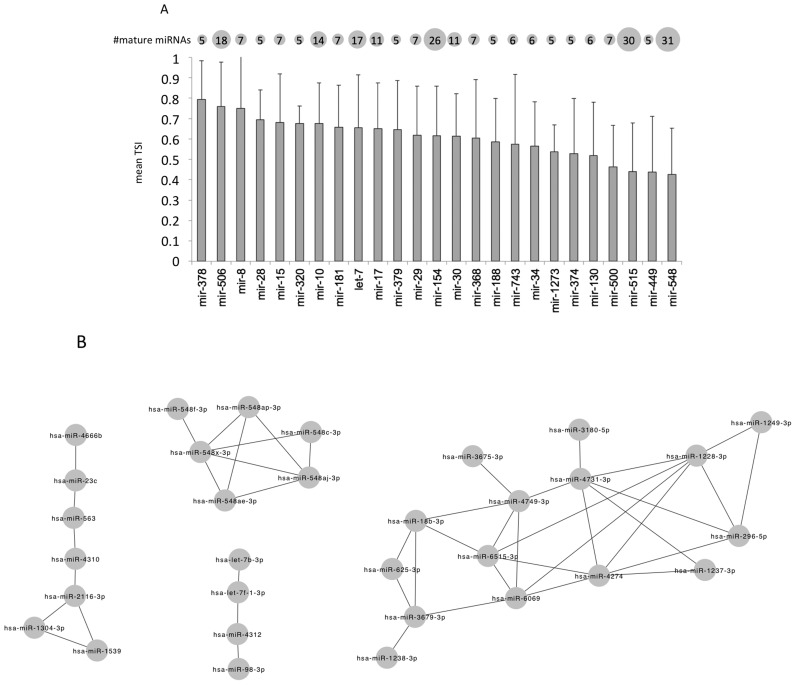
“While we frequently observed co-expression among mature members of specific families (e.g. the mir-548 family)”
§ Distribution of miRNA expression across human tissues > RESULTS > Tissue specificity of miRNA families
plaincorrelationaln = 4- Asserted: passes — The authors put it forward as true.
- Checkable: passes — It can be checked against evidence.
- Load-bearing: unclear — It is unclear whether the paper’s conclusions depend on it.
- Based: passes — The paper gives a reason why it holds.
A result the paper reports from its own data — it cites no other source for it, so there is none to check. The quote shows it is in the paper.
In the paper
“Another group of miRNAs, miR-507, miR-514a-3p and miR-509–5p was almost exclusively expressed in the testis samples.”
§ Distribution of miRNA expression across human tissues > RESULTS > Clustering of tissue patterns and analysis of miRNA families
plaincorrelational- Asserted: passes — The authors put it forward as true.
- Checkable: passes — It can be checked against evidence.
- Load-bearing: unclear — It is unclear whether the paper’s conclusions depend on it.
- Based: passes — The paper gives a reason why it holds.
A result the paper reports from its own data — it cites no other source for it, so there is none to check. The quote shows it is in the paper.
In the paper
“Especially for five miRNAs we, however, calculated TSI values that are increased in lung tissue by at least 20%: hsa-miR-8069, hsa-miR-6821–5p, hsa-miR-4800–5p, hsa-miR-6775–5p, hsa-miR-5001–5p.”
§ Distribution of miRNA expression across human tissues > RESULTS > Stability of miRNA patterns in tissues
plaincorrelational- Asserted: passes — The authors put it forward as true.
- Checkable: passes — It can be checked against evidence.
- Load-bearing: unclear — It is unclear whether the paper’s conclusions depend on it.
- Based: passes — The paper gives a reason why it holds.
A result the paper reports from its own data — it cites no other source for it, so there is none to check. The quote shows it is in the paper.
In the paper
“For single miRNAs still differences dependent on the storage could be observed.”
§ Distribution of miRNA expression across human tissues > RESULTS > Stability of miRNA patterns in tissues
hedgedcorrelational- Asserted: passes — The authors put it forward as true.
- Checkable: passes — It can be checked against evidence.
- Load-bearing: passes — The paper’s conclusions depend on it.
- Based: passes — The paper gives a reason why it holds.
- Probably not a substantial claim. 19
- It may state two separate claims as one. 35
- The quote only partly states this claim. 4
The cited sources support only part of this claim — read each source’s verdict below.
In the paper
“MiR-205–5p that is highly expressed in melanocytes and downregulated in melanoma is inverse correlated with melanoma progression (21).”
§ Distribution of miRNA expression across human tissues > DISCUSSION
What the sources say
- Partly supportedcites [21] sourceExperimental — accuracy not yet measured
The section ‘miR-205 Expression Is Progressively Reduced from Nevi to Melanomas in Tissue Samples and Cell Lines’ reports lower miR-205 expression in primary and metastatic melanomas than in nevi, supporting the inverse association with progression. The copy compares benign nevi with melanomas and labels the target miR-205; it does not establish high expression specifically in melanocytes or identify the measured strand as miR-205-5p. (LLM, conf=0.84)
plaincorrelational- Asserted: passes — The authors put it forward as true.
- Checkable: passes — It can be checked against evidence.
- Load-bearing: fails — The paper’s conclusions may not depend on it.
- Based: passes — The paper gives a reason why it holds.
Probably not a substantial claim. The paper’s conclusions may not depend on it. It may state two separate claims as one.
- Partly supported
Every source the paper cites for this claim was checked and supports it.
In the paper
“We recently investigated the miRNA repertoire of different blood cell types (4), already indicating a complex miRNA repertoire strongly dependent on the considered cell types.”
§ Distribution of miRNA expression across human tissues > INTRODUCTION
What the sources say
- Supportedcites [4] source
The Results and discussion section reports different numbers of detected miRNAs across blood cell fractions and identifies miRNAs with cell-type-specific expression. The Conclusion likewise states that different cell types show substantial differences in the complexity of their miRNomes. This supports the citing sentence's description of a complex repertoire dependent on the cell type considered. (LLM, conf=0.93)
boostedcorrelational- Asserted: passes — The authors put it forward as true.
- Checkable: passes — It can be checked against evidence.
- Load-bearing: fails — The paper’s conclusions may not depend on it.
- Based: passes — The paper gives a reason why it holds.
Probably not a substantial claim. The paper’s conclusions may not depend on it.
- Supported
Every source the paper cites for this claim was checked and supports it.
In the paper
“However, NGS analysis would enable to detect presently unknown miRNAs as well miRNAs iso-forms that have demonstrated to target biological pathways in a cooperative manner (16).”
§ Distribution of miRNA expression across human tissues > DISCUSSION
What the sources say
- Supportedcites [16] source
The Background says massive-scale sequencing can profile miRNAs without prior knowledge of their expression and that ultra-deep sequencing helps detect poorly expressed miRNAs and isomiRs. It also reports that isomiRs act cooperatively with canonical miRNAs to target common biological pathways. (LLM, conf=0.93)
hedgedconditional- Asserted: passes — The authors put it forward as true.
- Checkable: passes — It can be checked against evidence.
- Load-bearing: fails — The paper’s conclusions may not depend on it.
- Based: passes — The paper gives a reason why it holds.
Probably not a substantial claim. The paper’s conclusions may not depend on it. It may state two separate claims as one.
- Supported
Every source the paper cites for this claim was checked and supports it.
In the paper
“Since the normalization may have an impact on the results, we performed all analyses on the raw data, normalized data by quantile normalization and by variance stabilizing normalization (6).”
§ Distribution of miRNA expression across human tissues > MATERIALS AND METHODS > miRNA profiling
What the sources say
- Supportedcites [6] source
The citation is attached to variance-stabilizing normalization as a method, not to the citing authors’ decision to analyze three versions of their data. The source’s Introduction describes a variance-stabilizing transformation for microarray intensities, and its Discussion describes its use in calibration. Page numbers are unavailable in our copy. (LLM, conf=0.92)
plain- Asserted: passes — The authors put it forward as true.
- Checkable: passes — It can be checked against evidence.
- Load-bearing: passes — The paper’s conclusions depend on it.
- Based: passes — The paper gives a reason why it holds.
Probably not a substantial claim.
- Supported
Every source the paper cites for this claim was checked and supports it.
In the paper
“Of note, miR-144 has been found highly expressed in normal thyroid and downregulated in papillary thyroid carcinoma (18).”
§ Distribution of miRNA expression across human tissues > DISCUSSION
What the sources say
- Supportedcites [18] source
The Deregulated miRNAs section reports that miR-144-3p and miR-144-5p are downregulated in papillary thyroid carcinoma compared with control, noncancerous thyroid, with tumor-to-normal fold changes of 0.18 and 0.26. Table 1 also shows higher miR-144-5p expression in normal thyroid than in tumors. (LLM, conf=0.92)
plaincorrelational- Asserted: passes — The authors put it forward as true.
- Checkable: passes — It can be checked against evidence.
- Load-bearing: fails — The paper’s conclusions may not depend on it.
- Based: passes — The paper gives a reason why it holds.
Probably not a substantial claim. The paper’s conclusions may not depend on it. It may state two separate claims as one.
- Supported
The cited sources support only part of this claim — read each source’s verdict below.
In the paper
“Ibberson et al. found that RNA degradation due to prolonged inadequate tissue storage has a random effect on miRNAs and compromises the reliability of miRNA profiles, generating false positive deregulated miRNAs (15).”
§ Distribution of miRNA expression across human tissues > DISCUSSION
What the sources say
- Partly supportedcites [15] sourceExperimental — accuracy not yet measured
The Results sections “Degradation of total RNA randomly affects miRNAs” and “miRNA expression profiling of degraded RNAs” report unpredictable effects and falsely positive regulated miRNAs in degraded samples. The study induced degradation by delaying RNA extraction from tissue kept on ice; it does not specifically establish prolonged inadequate tissue storage as the cause. (LLM, conf=0.84)
plaindirect- Asserted: passes — The authors put it forward as true.
- Checkable: passes — It can be checked against evidence.
- Load-bearing: passes — The paper’s conclusions depend on it.
- Based: passes — The paper gives a reason why it holds.
Probably not a substantial claim. It may state two separate claims as one.
- Partly supported
The cited sources support only part of this claim — read each source’s verdict below.
In the paper
“A significant decrease in expression of miR-192–5p in colorectal cancer compared to normal mucosa has been reported (22).”
§ Distribution of miRNA expression across human tissues > DISCUSSION
What the sources say
- Partly supportedcites [22] sourceExperimental — accuracy not yet measured
The Results section reports significantly lower miR-192 expression in colon tumors than in adjacent normal tissue (P = .0008). The paper does not identify the measured miRNA as miR-192-5p, and its reported comparison is specifically in colon cancer rather than colorectal cancer broadly. (LLM, conf=0.85)
plaincorrelational- Asserted: passes — The authors put it forward as true.
- Checkable: passes — It can be checked against evidence.
- Load-bearing: fails — The paper’s conclusions may not depend on it.
- Based: passes — The paper gives a reason why it holds.
Probably not a substantial claim. The paper’s conclusions may not depend on it.
- Partly supported
The cited sources support only part of this claim — read each source’s verdict below.
In the paper
“Elevated levels of circulating myomiRs, i.e. miR-1, miR-206 and miR-133a/b, have been proposed as biomarker for heart failure and different forms of muscle dystrophy, but are also elevated after half-marathon run (27–29).”
§ Distribution of miRNA expression across human tissues > DISCUSSION
What the sources say
- Partly supportedcites [27] sourceExperimental — accuracy not yet measured
The Results (page not supplied) report elevated circulating miR-1 and miR-133b in advanced heart failure, and the introductory passage identifies miR-1/206 and miR-133a/b as muscle-specific myomiRs. The copy does not establish that every listed miRNA was elevated in heart failure, and the passages found do not address muscle dystrophy or levels after a half-marathon run. (LLM, conf=0.87)
- Not checked — no full text of the sourcecites [28] source
- Partly supportedcites [29] sourceExperimental — accuracy not yet measured
The Results section (page unavailable) reports elevated serum miR-1, miR-206 and miR-133 in children with Duchenne and Becker muscular dystrophy; its miR-133 assay detects both a and b isoforms. The paper proposes these miRNAs as biomarkers for Duchenne muscular dystrophy, but the passages do not support the claims about heart failure or elevation after a half-marathon run. (LLM, conf=0.87)
hedgedcorrelational- Asserted: passes — The authors put it forward as true.
- Checkable: passes — It can be checked against evidence.
- Load-bearing: fails — The paper’s conclusions may not depend on it.
- Based: passes — The paper gives a reason why it holds.
Probably not a substantial claim. The paper’s conclusions may not depend on it. It may state two separate claims as one.
- Partly supported
A result the paper reports from its own data — it cites no other source for it, so there is none to check. The quote shows it is in the paper.
In the paper
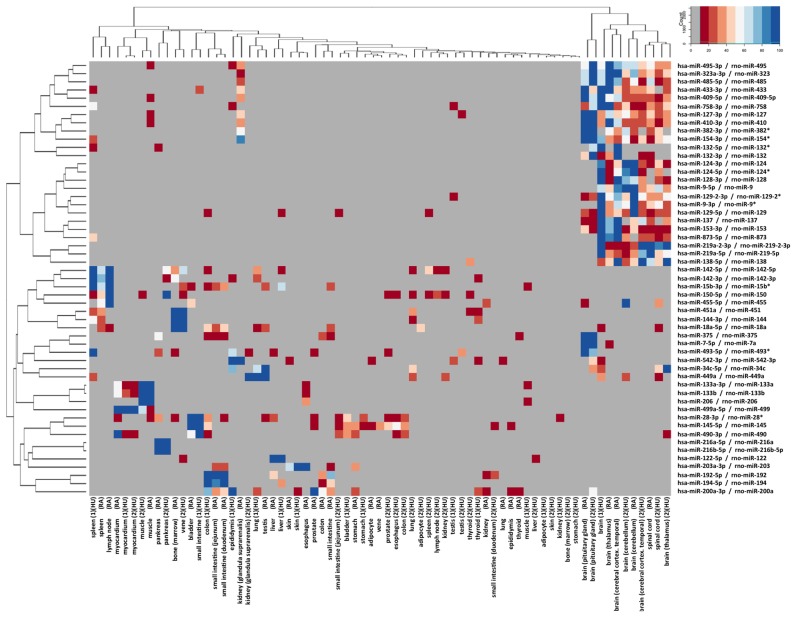
“The miRNAs in this heat map matched the specific miRNAs in Figure 5 very well such as miR-133a-3p, and miR-133b for muscle and myocardium or miR-9–5p, miR-219a-5p, miR-7–5p and miR-124–3p for brain and spinal cord.”
§ Distribution of miRNA expression across human tissues > RESULTS > Homology of tissue specificity in humans and rats
boostedcorrelational- Asserted: passes — The authors put it forward as true.
- Checkable: passes — It can be checked against evidence.
- Load-bearing: passes — The paper’s conclusions depend on it.
- Based: passes — The paper gives a reason why it holds.
It may state two separate claims as one.
A result the paper reports from its own data — it cites no other source for it, so there is none to check. The quote shows it is in the paper.
In the paper
“Additionally, we detected a highly specific expression of miR-205–5p, miR-514a-3p and miR-192–5p in skin, testis and colon samples of one of the bodies, respectively.”
§ Distribution of miRNA expression across human tissues > DISCUSSION
plaincorrelationalSingle case- Asserted: passes — The authors put it forward as true.
- Checkable: passes — It can be checked against evidence.
- Load-bearing: unclear — It is unclear whether the paper’s conclusions depend on it.
- Based: passes — The paper gives a reason why it holds.
It may state two separate claims as one.
A result the paper reports from its own data — it cites no other source for it, so there is none to check. The quote shows it is in the paper.
In the paper
“Of 10 replicated Agilent microarray measurements of the same individual, we calculated 10 * 9/2 pair-wise correlations of technical replicates. Minimal correlation was 0.998 and mean/median correlation 0.999, highlighting the high degree of technical reproducibility of the array platform.”
§ Distribution of miRNA expression across human tissues > RESULTS > Reproducibility of miRNA patterns
plaincorrelationalSingle case- Asserted: passes — The authors put it forward as true.
- Checkable: passes — It can be checked against evidence.
- Load-bearing: passes — The paper’s conclusions depend on it.
- Based: passes — The paper gives a reason why it holds.
It may state two separate claims as one.
A result the paper reports from its own data — it cites no other source for it, so there is none to check. The quote shows it is in the paper.
In the paper
“Overall, our results correlated well with this data, confirming specific expression of miR-122, miR-9, miR-124 and miR-7 in the respective organs.”
§ Distribution of miRNA expression across human tissues > DISCUSSION
boostedcorrelational- Asserted: passes — The authors put it forward as true.
- Checkable: passes — It can be checked against evidence.
- Load-bearing: passes — The paper’s conclusions depend on it.
- Based: passes — The paper gives a reason why it holds.
It may state two separate claims as one.
A result the paper reports from its own data — it cites no other source for it, so there is none to check. The quote shows it is in the paper.
In the paper
“Performing the same analysis with raw data, we detected an increased number of co-expressions, but generally confirmed the observation that has been based on the normalized data.”
§ Distribution of miRNA expression across human tissues > RESULTS > Tissue specificity of miRNA families
plaincorrelationaln = 4- Asserted: passes — The authors put it forward as true.
- Checkable: passes — It can be checked against evidence.
- Load-bearing: unclear — It is unclear whether the paper’s conclusions depend on it.
- Based: passes — The paper gives a reason why it holds.
It may state two separate claims as one.
A result the paper reports from its own data — it cites no other source for it, so there is none to check. The quote shows it is in the paper.
In the paper
“However, the overall correlation of the expression values of rat and human miRNAs was 0.361 (P < 10−16), indicative of a significant matching of human and rat expression profiles.”
§ Distribution of miRNA expression across human tissues > RESULTS > Homology of tissue specificity in humans and rats
hedgedcorrelational- Asserted: passes — The authors put it forward as true.
- Checkable: passes — It can be checked against evidence.
- Load-bearing: passes — The paper’s conclusions depend on it.
- Based: passes — The paper gives a reason why it holds.
It may state two separate claims as one.
A result the paper reports from its own data — it cites no other source for it, so there is none to check. The quote shows it is in the paper.
In the paper
“Mature -5p forms were on average 21% higher expressed as compared to -3p forms (paired t-test P-value of 3.6×10⁻¹⁰).”
- Also stated in: § Tissue specificity of -3p and -5p mature forms · plain
“For both quantile- and VSN-normalized data, we calculated significantly higher expression of the -5p mature forms.”
§ Distribution of miRNA expression across human tissues > RESULTS > Tissue specificity of -3p and -5p mature forms
plaincorrelational- Asserted: passes — The authors put it forward as true.
- Checkable: passes — It can be checked against evidence.
- Load-bearing: passes — The paper’s conclusions depend on it.
- Based: passes — The paper gives a reason why it holds.
It may state two separate claims as one. The quote only partly states this claim.
- Also stated in: § Tissue specificity of -3p and -5p mature forms · plain
A result the paper reports from its own data — it cites no other source for it, so there is none to check. The quote shows it is in the paper.
In the paper
“Highest tissue specificity was observed for the miR-378 family, predominantly being specific for myocardium and muscle.”
§ Distribution of miRNA expression across human tissues > RESULTS > Tissue specificity of miRNA families
plaincorrelational- Asserted: passes — The authors put it forward as true.
- Checkable: passes — It can be checked against evidence.
- Load-bearing: passes — The paper’s conclusions depend on it.
- Based: passes — The paper gives a reason why it holds.
It may state two separate claims as one.
A result the paper reports from its own data — it cites no other source for it, so there is none to check. The quote shows it is in the paper.
In the paper
“miR-449a in lung, kidney and brain”
§ Distribution of miRNA expression across human tissues > RESULTS > Tissue specificity of miRNA families
plain- Asserted: passes — The authors put it forward as true.
- Checkable: passes — It can be checked against evidence.
- Load-bearing: unclear — It is unclear whether the paper’s conclusions depend on it.
- Based: passes — The paper gives a reason why it holds.
It may state two separate claims as one.
A result the paper reports from its own data — it cites no other source for it, so there is none to check. The quote shows it is in the paper.
In the paper
“Altogether, we found high correlations between these technical replicates with the overall lowest correlations at 0.986 and 0.994 observed for liver tissue and pleura, respectively. Highest correlation of 0.999 was reached for the brain samples.”
§ Distribution of miRNA expression across human tissues > RESULTS > Reproducibility of miRNA patterns
plaincorrelational- Asserted: passes — The authors put it forward as true.
- Checkable: passes — It can be checked against evidence.
- Load-bearing: unclear — It is unclear whether the paper’s conclusions depend on it.
- Based: passes — The paper gives a reason why it holds.
It may state two separate claims as one.
A result the paper reports from its own data — it cites no other source for it, so there is none to check. The quote shows it is in the paper.
In the paper
“We found several miRNA families with high TSI values including the above-mentioned mir-378 family with most of the family members showing a high abundance in muscle tissues and the myocardium.”
§ Distribution of miRNA expression across human tissues > RESULTS > Tissue specificity of miRNA families
plaincorrelational- Asserted: passes — The authors put it forward as true.
- Checkable: passes — It can be checked against evidence.
- Load-bearing: unclear — It is unclear whether the paper’s conclusions depend on it.
- Based: passes — The paper gives a reason why it holds.
It may state two separate claims as one.
A result the paper reports from its own data — it cites no other source for it, so there is none to check. The quote shows it is in the paper.
In the paper
“Although these (and similarly differentially abundant miRNAs between both individuals) miRNAs had low TSI values and are not considered tissue specific”
§ Distribution of miRNA expression across human tissues > RESULTS > Inter-individual variations
plain- Asserted: passes — The authors put it forward as true.
- Checkable: passes — It can be checked against evidence.
- Load-bearing: unclear — It is unclear whether the paper’s conclusions depend on it.
- Based: passes — The paper gives a reason why it holds.
It may state two separate claims as one.
A result the paper reports from its own data — it cites no other source for it, so there is none to check. The quote shows it is in the paper.
In the paper
“We observed expression of this miRNA in different areas of the brain but not in other tissues.”
§ Distribution of miRNA expression across human tissues > DISCUSSION
plain- Asserted: passes — The authors put it forward as true.
- Checkable: passes — It can be checked against evidence.
- Load-bearing: unclear — It is unclear whether the paper’s conclusions depend on it.
- Based: passes — The paper gives a reason why it holds.
It may state two separate claims as one.
A result the paper reports from its own data — it cites no other source for it, so there is none to check. The quote shows it is in the paper.
In the paper
“For miR-144, we found highest expression in vein and spleen, consistent with the assumption of residual hematopoietic cells in these samples; additionally, we found high expression of this miRNA in thyroid.”
§ Distribution of miRNA expression across human tissues > DISCUSSION
plain- Asserted: passes — The authors put it forward as true.
- Checkable: passes — It can be checked against evidence.
- Load-bearing: unclear — It is unclear whether the paper’s conclusions depend on it.
- Based: passes — The paper gives a reason why it holds.
It may state two separate claims as one.
A result the paper reports from its own data — it cites no other source for it, so there is none to check. The quote shows it is in the paper.
In the paper
“Inspecting the respective miRNAs, we found that they usually were specific for other organs than the lung and expressed to a very moderate limit in the lung. Here, already small variations lead to artificially high TSI values.”
§ Distribution of miRNA expression across human tissues > RESULTS > Inter-individual variations
plaindirectn = 16- Asserted: passes — The authors put it forward as true.
- Checkable: passes — It can be checked against evidence.
- Load-bearing: passes — The paper’s conclusions depend on it.
- Based: passes — The paper gives a reason why it holds.
It may state two separate claims as one.
A result the paper reports from its own data — it cites no other source for it, so there is none to check. The quote shows it is in the paper.
In the paper
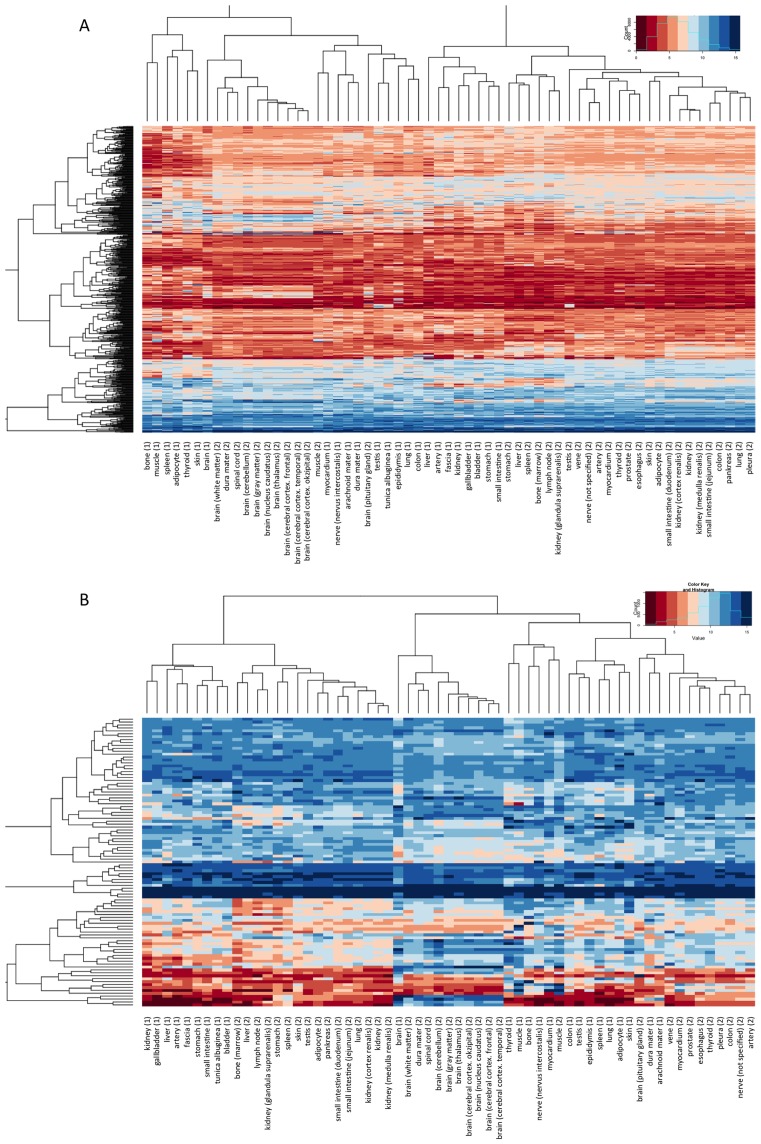
“For VSN-normalized data we observed a similar pattern, however, we found a stronger tendency of clustering of individuals in the different sub-clusters”
§ Distribution of miRNA expression across human tissues > RESULTS > Clustering of tissue patterns and analysis of miRNA families
plaincorrelational- Asserted: passes — The authors put it forward as true.
- Checkable: passes — It can be checked against evidence.
- Load-bearing: unclear — It is unclear whether the paper’s conclusions depend on it.
- Based: passes — The paper gives a reason why it holds.
It may state two separate claims as one.
A result the paper reports from its own data — it cites no other source for it, so there is none to check. The quote shows it is in the paper.
In the paper
“Here, we found three main clusters with the first one containing kidney, liver, stomach and small intestine of both bodies.”
§ Distribution of miRNA expression across human tissues > RESULTS > Clustering of tissue patterns and analysis of miRNA families
plaincorrelationaln = 2- Asserted: passes — The authors put it forward as true.
- Checkable: passes — It can be checked against evidence.
- Load-bearing: passes — The paper’s conclusions depend on it.
- Based: passes — The paper gives a reason why it holds.
The quote only partly states this claim.
A result the paper reports from its own data — it cites no other source for it, so there is none to check. The quote shows it is in the paper.
In the paper
“These figures also indicate that few miRNAs have higher TSI in lung as compared to the overall TSI, i.e. variations between organs are smaller than variations between individuals.”
§ Distribution of miRNA expression across human tissues > RESULTS > Inter-individual variations
hedgedn = 16- Asserted: passes — The authors put it forward as true.
- Checkable: passes — It can be checked against evidence.
- Load-bearing: passes — The paper’s conclusions depend on it.
- Based: passes — The paper gives a reason why it holds.
It may state two separate claims as one.
A result the paper reports from its own data — it cites no other source for it, so there is none to check. The quote shows it is in the paper.
In the paper
“From all miRNAs expressed in our tissue collection, 230 matched in sequence identically between human and rat. Of the tissues included in the human and rat studies, 42 organs could be matched.”
§ Distribution of miRNA expression across human tissues > RESULTS > Homology of tissue specificity in humans and rats
plain- Asserted: passes — The authors put it forward as true.
- Checkable: passes — It can be checked against evidence.
- Load-bearing: passes — The paper’s conclusions depend on it.
- Based: passes — The paper gives a reason why it holds.
It may state two separate claims as one.
A result the paper reports from its own data — it cites no other source for it, so there is none to check. The quote shows it is in the paper.
In the paper
“We found two major clusters, the first of which containing mainly nervous system tissues and muscle tissues from both bodies.”
§ Distribution of miRNA expression across human tissues > RESULTS > Clustering of tissue patterns and analysis of miRNA families
plaincorrelationaln = 2- Asserted: passes — The authors put it forward as true.
- Checkable: passes — It can be checked against evidence.
- Load-bearing: unclear — It is unclear whether the paper’s conclusions depend on it.
- Based: passes — The paper gives a reason why it holds.
It may state two separate claims as one.
A result the paper reports from its own data — it cites no other source for it, so there is none to check. The quote shows it is in the paper.
In the paper
“Altogether, we identified 73 miRNA pairs with tissue co-expression.”
§ Distribution of miRNA expression across human tissues > RESULTS > Tissue specificity of miRNA families
plaincorrelational- Asserted: passes — The authors put it forward as true.
- Checkable: passes — It can be checked against evidence.
- Load-bearing: passes — The paper’s conclusions depend on it.
- Based: passes — The paper gives a reason why it holds.
The quote only partly states this claim.
A result the paper reports from its own data — it cites no other source for it, so there is none to check. The quote shows it is in the paper.
In the paper
“In detail, we detected high expression of miR-133b, miR-133a-3p, miR-1–3p and miR-206 in both muscle samples and, with the exception of miR-206 also in both myocardial samples.”
§ Distribution of miRNA expression across human tissues > RESULTS > Clustering of tissue patterns and analysis of miRNA families
plain- Asserted: passes — The authors put it forward as true.
- Checkable: passes — It can be checked against evidence.
- Load-bearing: unclear — It is unclear whether the paper’s conclusions depend on it.
- Based: passes — The paper gives a reason why it holds.
It may state two separate claims as one.
A result the paper reports from its own data — it cites no other source for it, so there is none to check. The quote shows it is in the paper.
In the paper
“In this analysis we did not observe a predominant clustering in humans and rats but a strong tendency of organs to cluster together.”
§ Distribution of miRNA expression across human tissues > RESULTS > Homology of tissue specificity in humans and rats
plain- Asserted: passes — The authors put it forward as true.
- Checkable: passes — It can be checked against evidence.
- Load-bearing: passes — The paper’s conclusions depend on it.
- Based: passes — The paper gives a reason why it holds.
It may state two separate claims as one.
A result the paper reports from its own data — it cites no other source for it, so there is none to check. The quote shows it is in the paper.
In the paper
“In this analysis the variations between individuals were even lower as compared to the variations between organs. Again, TSI values were significantly lower for prostate tissue (P < 10−16).”
§ Distribution of miRNA expression across human tissues > RESULTS > Inter-individual variations
plain- Asserted: passes — The authors put it forward as true.
- Checkable: passes — It can be checked against evidence.
- Load-bearing: passes — The paper’s conclusions depend on it.
- Based: passes — The paper gives a reason why it holds.
It may state two separate claims as one.
A result the paper reports from its own data — it cites no other source for it, so there is none to check. The quote shows it is in the paper.
In the paper
“We found several groups of miRNAs with tissue-specific expression.”
§ Distribution of miRNA expression across human tissues > RESULTS > Clustering of tissue patterns and analysis of miRNA families
plaincorrelational- Asserted: passes — The authors put it forward as true.
- Checkable: passes — It can be checked against evidence.
- Load-bearing: passes — The paper’s conclusions depend on it.
- Based: passes — The paper gives a reason why it holds.
The quote only partly states this claim.
A result the paper reports from its own data — it cites no other source for it, so there is none to check. The quote shows it is in the paper.
In the paper
“For lung and heart tissue we investigated short- and long-term degradation, highlighting an overall limited impact on the tissue specificity of miRNA profiles. Only very few miRNAs were affected at all.”
§ Distribution of miRNA expression across human tissues > DISCUSSION
plain- Asserted: passes — The authors put it forward as true.
- Checkable: passes — It can be checked against evidence.
- Load-bearing: passes — The paper’s conclusions depend on it.
- Based: passes — The paper gives a reason why it holds.
It may state two separate claims as one.
A result the paper reports from its own data — it cites no other source for it, so there is none to check. The quote shows it is in the paper.
In the paper
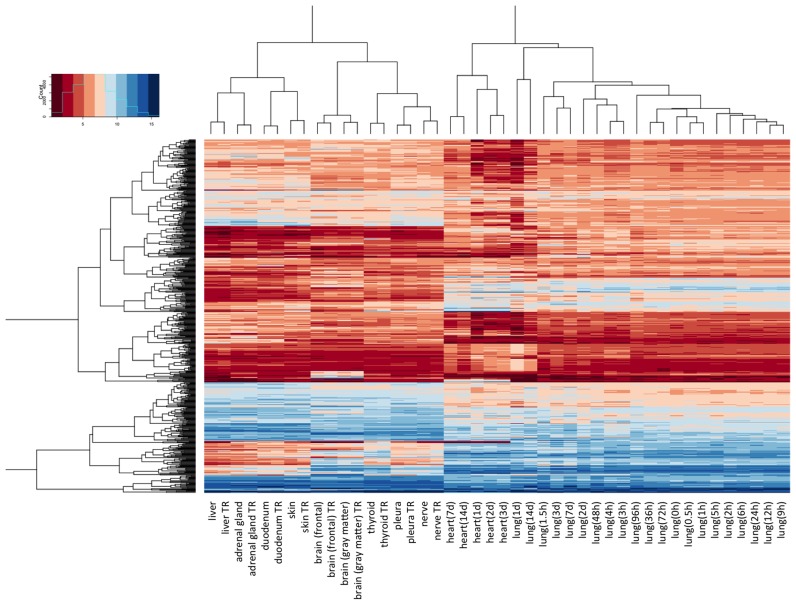
“Hierarchical cluster analysis shows that all lung and all heart samples each cluster together (Figure 1; Supplementary Figure S1).”
§ Distribution of miRNA expression across human tissues > RESULTS > Stability of miRNA patterns in tissues
plainn = 2- Asserted: passes — The authors put it forward as true.
- Checkable: passes — It can be checked against evidence.
- Load-bearing: passes — The paper’s conclusions depend on it.
- Based: passes — The paper gives a reason why it holds.
It may state two separate claims as one.
In the paper
“different donors should be of different age and gender both of which are known to influence the miRNA pattern (12).”
§ Distribution of miRNA expression across human tissues > DISCUSSION
What the sources say
- Not checked — no full text of the sourcecites [12] source
boosteddirect- Asserted: passes — The authors put it forward as true.
- Checkable: passes — It can be checked against evidence.
- Load-bearing: passes — The paper’s conclusions depend on it.
- Based: passes — The paper gives a reason why it holds.
It may state two separate claims as one.
In the paper
“MiR-124 (miR-124–3p) was identified as the third most specific miRNA in the nervous system by Landgraf et al.”
§ Distribution of miRNA expression across human tissues > DISCUSSION
What the sources say
- Not checked — no full text of the sourcecites [3] source
plain- Asserted: passes — The authors put it forward as true.
- Checkable: passes — It can be checked against evidence.
- Load-bearing: fails — The paper’s conclusions may not depend on it.
- Based: passes — The paper gives a reason why it holds.
Probably not a substantial claim. The paper’s conclusions may not depend on it.
In the paper
“MiR-514a-3p belongs to the miR-506 family; the mouse orthologue of miR-506, mmu-201, has been shown to be specifically expressed in reproductive tissues (3).”
§ Distribution of miRNA expression across human tissues > DISCUSSION
What the sources say
- Not checked — no full text of the sourcecites [3] source
plain- Asserted: passes — The authors put it forward as true.
- Checkable: passes — It can be checked against evidence.
- Load-bearing: fails — The paper’s conclusions may not depend on it.
- Based: passes — The paper gives a reason why it holds.
Probably not a substantial claim. The paper’s conclusions may not depend on it. It may state two separate claims as one.
In the paper
“They identified 340 mature human miRNAs including 33 novel miRNAs not listed in the miRBase version 9.1, which was the current version at the time of the study (17).”
§ Distribution of miRNA expression across human tissues > DISCUSSION
What the sources say
- Not checked — no full text of the sourcecites [3] source
plain- Asserted: passes — The authors put it forward as true.
- Checkable: passes — It can be checked against evidence.
- Load-bearing: fails — The paper’s conclusions may not depend on it.
- Based: passes — The paper gives a reason why it holds.
Probably not a substantial claim. The paper’s conclusions may not depend on it.
In the paper
“Amongst others, Landgraf et al. detected tissue-specific expression of miR-122 in liver, of miR-9, miR-124 and miR 128a/b in brain, of miR-7, miR-375, miR-141 and miR-200a in pituitary gland and of miR-142, miR-144, miR-150, miR-155 and miR-223 in hematopoietic cells.”
§ Distribution of miRNA expression across human tissues > DISCUSSION
What the sources say
- Not checked — no full text of the sourcecites [3] source
plaincorrelational- Asserted: passes — The authors put it forward as true.
- Checkable: passes — It can be checked against evidence.
- Load-bearing: unclear — It is unclear whether the paper’s conclusions depend on it.
- Based: passes — The paper gives a reason why it holds.
It may state two separate claims as one.
What the paper did — it cites no source for this, so there is none to check. The quote shows it is in the paper.
In the paper
“We implemented a web-based repository enabling scientists to access and browse the data (https://ccb-web.cs.uni-saarland.de/tissueatlas).”
§ Distribution of miRNA expression across human tissues > Abstract
plaindirect- Asserted: passes — The authors put it forward as true.
- Checkable: passes — It can be checked against evidence.
- Load-bearing: fails — The paper’s conclusions may not depend on it.
- Based: passes — The paper gives a reason why it holds.
Probably not a substantial claim. The paper’s conclusions may not depend on it.
A conclusion the paper draws from its own results — it cites no other source for it, so there is none to check. The quote shows it is in the paper.
In the paper
“Given the data from two organs, we however cannot exclude the possibility that some tissue-specific miRNAs might be affected by degradation of the sample.”
§ Distribution of miRNA expression across human tissues > DISCUSSION
hedgedconditionaln = 2- Asserted: passes — The authors put it forward as true.
- Checkable: passes — It can be checked against evidence.
- Load-bearing: fails — The paper’s conclusions may not depend on it.
- Based: passes — The paper gives a reason why it holds.
Probably not a substantial claim. The paper’s conclusions may not depend on it.
In the paper
“The applied Agilent microarray technology has been proven sensitive and, more important, reproducible in a recent comprehensive platform comparison (5).”
§ Distribution of miRNA expression across human tissues > INTRODUCTION
What the sources say
- Not checked — no full text of the sourcecites [5] source
boosted- Asserted: passes — The authors put it forward as true.
- Checkable: passes — It can be checked against evidence.
- Load-bearing: passes — The paper’s conclusions depend on it.
- Based: passes — The paper gives a reason why it holds.
It may state two separate claims as one.
What the paper did — it cites no source for this, so there is none to check. The quote shows it is in the paper.
In the paper
“As expected for autopsy samples, the RNA integrity values (RIN) ranged between 1.8 and 2.7.”
§ Distribution of miRNA expression across human tissues > MATERIALS AND METHODS > RNA isolation and integrity
plain- Asserted: passes — The authors put it forward as true.
- Checkable: passes — It can be checked against evidence.
- Load-bearing: fails — The paper’s conclusions may not depend on it.
- Based: passes — The paper gives a reason why it holds.
Probably not a substantial claim. The paper’s conclusions may not depend on it.
- Rests on an assumption: RNA integrity values between 1.8 and 2.7 in autopsy samples are sufficient for reliable miRNA profiling.
What the paper did — it cites no source for this, so there is none to check. The quote shows it is in the paper.
In the paper
“Using this technology, we achieved technical Pearson correlation coefficients of between 0.97 and 1 for technical replicates in previous studies.”
§ Distribution of miRNA expression across human tissues > INTRODUCTION
plaincorrelational- Asserted: passes — The authors put it forward as true.
- Checkable: passes — It can be checked against evidence.
- Load-bearing: fails — The paper’s conclusions may not depend on it.
- Based: passes — The paper gives a reason why it holds.
Probably not a substantial claim. The paper’s conclusions may not depend on it.
In the paper
“The, as of now, most comprehensive study on tissue-specific miRNAs in humans was published by Landgraf et al. in 2007 (3).”
§ Distribution of miRNA expression across human tissues > DISCUSSION
What the sources say
- Not checked — no full text of the sourcecites [3] source
plain- Asserted: passes — The authors put it forward as true.
- Checkable: passes — It can be checked against evidence.
- Load-bearing: fails — The paper’s conclusions may not depend on it.
- Based: passes — The paper gives a reason why it holds.
Probably not a substantial claim. The paper’s conclusions may not depend on it.
A claim is checked only against the cited paper’s full text, never its abstract, and none is available for its sources.
In the paper
“These miRNAs are known as myomiRs that regulate key genes in muscle development (19,20).”
§ Distribution of miRNA expression across human tissues > DISCUSSION
What the sources say
boosteddirect- Asserted: passes — The authors put it forward as true.
- Checkable: passes — It can be checked against evidence.
- Load-bearing: fails — The paper’s conclusions may not depend on it.
- Based: passes — The paper gives a reason why it holds.
Probably not a substantial claim. The paper’s conclusions may not depend on it.
A conclusion the paper draws from its own results — it cites no other source for it, so there is none to check. The quote shows it is in the paper.
In the paper
“While these results indicate an overall matching of miRNA abundances in humans and rats, the TSI does not acknowledge the origin of the miRNAs, i.e. a value of 1 for a rat miRNA may indicate specificity for spleen and for the same miRNA specificity for brain in humans.”
§ Distribution of miRNA expression across human tissues > RESULTS > Homology of tissue specificity in humans and rats
hedged- Asserted: passes — The authors put it forward as true.
- Checkable: passes — It can be checked against evidence.
- Load-bearing: unclear — It is unclear whether the paper’s conclusions depend on it.
- Based: passes — The paper gives a reason why it holds.
It may state two separate claims as one.
In the paper
“They sequenced 256 small RNA libraries from 26 different organ systems and cell types of humans and rodents, with ∼1000 clone each.”
§ Distribution of miRNA expression across human tissues > DISCUSSION
What the sources say
- Not checked — no full text of the sourcecites [3] source
plain- Asserted: passes — The authors put it forward as true.
- Checkable: passes — It can be checked against evidence.
- Load-bearing: fails — The paper’s conclusions may not depend on it.
- Based: passes — The paper gives a reason why it holds.
Probably not a substantial claim. The paper’s conclusions may not depend on it.
A conclusion the paper draws from its own results — it cites no other source for it, so there is none to check. The quote shows it is in the paper.
In the paper
“We are also aware that the autopsy samples of the two male individuals provide only a snapshot of the full variability of miRNA expression.”
§ Distribution of miRNA expression across human tissues > DISCUSSION
plainn = 2- Asserted: passes — The authors put it forward as true.
- Checkable: passes — It can be checked against evidence.
- Load-bearing: fails — The paper’s conclusions may not depend on it.
- Based: passes — The paper gives a reason why it holds.
Probably not a substantial claim. The paper’s conclusions may not depend on it.
What the paper did — it cites no source for this, so there is none to check. The quote shows it is in the paper.
In the paper
“Hierarchical cluster analysis shows that the technical replicates always clustered together showing that the applied technology was suited to provide reproducible results”
§ Distribution of miRNA expression across human tissues > RESULTS > Reproducibility of miRNA patterns
plaindirectSingle case- Asserted: passes — The authors put it forward as true.
- Checkable: passes — It can be checked against evidence.
- Load-bearing: passes — The paper’s conclusions depend on it.
- Based: passes — The paper gives a reason why it holds.
It may state two separate claims as one.
The paper relies on this without support.
The two post-mortem male individuals are representative of the general human population for tissue miRNA distribution.
“Tissues analysed in this study originated from two male bodies.”
“we measured all miRNA profiles from only two different individuals to minimize inter-individual variability.”
The paper relies on this without support.
The first individual's multiple myeloma did not substantially alter the miRNA profiles of his non-tumor tissues.
“The first body was from a 65-year-old male patient, who suffered from multiple myeloma, a cancer that forms in a type of white blood cells (plasma cells).”
The paper relies on this without support.
RNA integrity values between 1.8 and 2.7 in autopsy samples are sufficient for reliable miRNA profiling.
“As expected for autopsy samples, the RNA integrity values (RIN) ranged between 1.8 and 2.7.”
The paper relies on this without support.
The majority of studies investigate differential expression in only one organ/tissue.
“Although there is ample evidence for differential miRNA expression in different human tissues, the majority of studies investigate differential expression in only one organ/tissue.”
The paper relies on this without support.
Results of studies are not easily comparable due to different identification methods and normalization strategies, limiting their value for comparison of miRNA expression in different tissues.
“Due to the different identification methods and normalization strategies, the results of these studies are not easily comparable limiting their value for comparison of miRNA expression in different tissues.”
The paper relies on this without support.
Biopsies will be mostly taken from patients with affected organs.
“biopsies will be mostly taken from patients with affected organs”
The paper relies on this without support.
High inter-individual differences can mask tissue-specific differences of miRNA abundances.
“high inter-individual differences can mask tissue-specific differences of miRNA abundances”
The paper relies on this without support.
A bias is likely introduced by multiple centres involved in tissue collections.
“a bias is likely introduced by multiple centres that are involved in tissue collections”
The paper relies on this without support.
Samples of vital organs (e.g., thalamus, spinal cord, cerebellum) are not available from biopsies.
“samples of vital organs, e.g. thalamus, spinal cord or cerebellum, are not available”
The paper relies on this without support.
RNA degradation in autopsy samples due to storage duration, advanced age, or disease status of body donors.
“with the disadvantage of RNA degradation in the samples due to the storage duration of the body and the advanced age or the disease status of the body donors”
The paper relies on this without support.
Many normalization techniques can have a substantial influence on the results.
“Many techniques that are frequently applied such as variance stabilizing normalization or quantile normalization can have a substantial influence on the results.”
Claims other papers make about this one
Each is checked against this paper’s own text: does it say what the citing paper says it does?
The source backs part of the claim, not all of it — or backs it for a different population, condition or comparison.
In the citing paper
“Many miRNAs have a strong tissue-specific expression pattern and 3’ UTR of target gene plays a critical role in determining the miRNA-target interaction [136, 137].”
From MicroRNAs in brain cholesterol metabolism and their implications for Alzheimer's disease (2016) · cites this paper as [136]
Experimental — accuracy not yet measuredThe source backs part of the claim, not all of it — or backs it for a different population, condition or comparison.
In the citing paper
“Notably, five of the top 25 upregulated miRNAs in IS patients were brain-specific or enriched, including hsa-miR-9-3p, hsa-miR-124-3p, hsa-miR-143-3p, hsa-miR-98-5p, and hsa-miR-93-5p.”
From Acute Cerebral Ischemia Increases a Set of Brain-Specific miRNAs in Serum Small Extracellular Vesicles (2022) · cites this paper as Ludwig et al., 2016
Experimental — accuracy not yet measuredThe source backs part of the claim, not all of it — or backs it for a different population, condition or comparison.
In the citing paper
“Likewise, 9 out of the 20 upregulated miRNAs in tMCAO mice are brain-specific or preferentially expressed in brain tissues, including mmu-miR-124-3p, mmu-miR-9-3p, mmu-miR-9-5p, mmu-miR-323-3p, mmu-miR-219b-5p, mmu-miR-129b-3p, mmu-miR-129-5p, mmu-miR-433-3p, and mmu-miR-128-3p (Table 3).”
From Acute Cerebral Ischemia Increases a Set of Brain-Specific miRNAs in Serum Small Extracellular Vesicles (2022) · cites this paper as Ludwig et al., 2016
Experimental — accuracy not yet measuredThe cited source says what the claim attributes to it.
In the citing paper
“We identified both well-described brain-specific miRNAs, such as mir-9, mir-124, mir-219, mir-338 (16, 24, 33), as well as those which are missing from existing catalogs, such as mir-666, mir-878, mir-433, etc.”
From A mouse tissue atlas of small noncoding RNA (2020) · cites this paper as [33]
The cited source says what the claim attributes to it.
In the citing paper
“While providing valuable insights into the relationship of microRNA expression and disease (Lu et al. 2005), these and subsequent studies (Cheng et al. 2015; Ludwig et al. 2016) have not unraveled cellular microRNA expression.”
From Toward the human cellular microRNAome (2017) · cites this paper as Ludwig et al. 2016
Self-check
Percentages, sums and reported differences re-computed from the paper’s own numbers.
Each contradiction between two passages listed here was confirmed by an independent check.
Rated minor: it would not touch a result — a value no result rests on, a p-value that stays on the same side of the significance level, or a conflict that is clerical, resolved elsewhere in the paper, or outside its own findings.
In the paper
§ Distribution of miRNA expression across human tissues > RESULTS > Clustering of tissue patterns and analysis of miRNA families
“miR-122–5p, miR-7–5p and miR-205–5p were each exclusively expressed in liver, pituitary gland and skin, respectively.”
§ Distribution of miRNA expression across human tissues > DISCUSSION
“Our study, however, also identified low expression of miR-122–5p in spleen, gall bladder and veins.”
Rated minor: it would not touch a result — a value no result rests on, a p-value that stays on the same side of the significance level, or a conflict that is clerical, resolved elsewhere in the paper, or outside its own findings.
In the paper
§ Distribution of miRNA expression across human tissues > Abstract
“MiRNAs TSI values of human tissues were significantly (P = 10−8) correlated with those of rats;”
§ Distribution of miRNA expression across human tissues > RESULTS > Homology of tissue specificity in humans and rats
“For all these miRNAs and organs, we calculated the TSI values in human and rat, showing an overall correlation of 0.362 (P-value of 9 × 10⁻⁸).”
Rated minor: it would not touch a result — a value no result rests on, a p-value that stays on the same side of the significance level, or a conflict that is clerical, resolved elsewhere in the paper, or outside its own findings.
In the paper
§ Distribution of miRNA expression across human tissues > MATERIALS AND METHODS > Tissues and RNA extraction
“For 16 normal tissue biopsies from different individuals, the miRNA expression intensity was determined as for the two bodies and the samples from the degradation analysis.”
§ Distribution of miRNA expression across human tissues > MATERIALS AND METHODS > Additional data from literature
“In addition to the 44 tissue samples from the degradation and reproducibility analysis, the 16 individual lung cancer tissues and the 61 tissues from two bodies newly measured for this study, we searched the literature for other studies where normal tissues have been profiled.”
Rated minor: it would not touch a result — a value no result rests on, a p-value that stays on the same side of the significance level, or a conflict that is clerical, resolved elsewhere in the paper, or outside its own findings.
In the paper
§ Distribution of miRNA expression across human tissues > RESULTS > Tissue specificity of miRNA families
“We used a high correlation cut-off and considered only miRNA-pairs with Pearson correlation exceeding 0.95.”
§ Distribution of miRNA expression across human tissues > RESULTS > Tissue specificity of miRNA families
“Each miRNA pair connected by an edge has co-expression across all samples with Spearman correlation coefficient above 0.95.”
Citations
Cites
Gene Expression Omnibus: NCBI gene expression and hybridization array data repository
Edgar, R. (2002) · Nucleic Acids Research · doi:10.1093/nar/30.1.207 · Cited by 13,288
miRBase: microRNA sequences, targets and gene nomenclature
Griffiths-Jones, S. (2006) · Nucleic Acids Research · doi:10.1093/nar/gkj112 · Cited by 3,950
A Mammalian microRNA Expression Atlas Based on Small RNA Library Sequencing
Landgraf, P., Rusu, M., Sheridan, R., Sewer, A., Iovino, N., Aravin, A., Pfeffer, S., Rice, A., Kamphorst, A. O., Landthaler, M., et al. (2007) · Cell · doi:10.1016/j.cell.2007.04.040 · Cited by 3,626
Huber, W., von Heydebreck, A., Sültmann, H., Poustka, A., & Vingron, M. (2002) · Bioinformatics · doi:10.1093/bioinformatics/18.suppl_1.s96 · Cited by 2,440
Yanai, I., Benjamin, H., Shmoish, M., Chalifa-Caspi, V., Shklar, M., Ophir, R., Bar-Even, A., Horn-Saban, S., Safran, M., Domany, E., et al. (2005) · Bioinformatics · doi:10.1093/bioinformatics/bti042 · Cited by 1,300
The Human Protein Atlas—a tool for pathology
Pontén, F., Jirström, K., & Uhlén, M. (2008) · The Journal of Pathology · doi:10.1002/path.2440 · Cited by 1,126
Evaluation of quantitative miRNA expression platforms in the microRNA quality control (miRQC) study
Mestdagh, P., Hartmann, N., Baeriswyl, L., Andreasen, D., Bernard, N., Chen, C., Cheo, D., D'Andrade, P., DeMayo, M., Dennis, L., et al. (2014) · Nature Methods · doi:10.1038/nmeth.3014 · Cited by 660
Xu, J., Wu, C., Che, X., Wang, L., Yu, D., Zhang, T., Huang, L., Li, H., Tan, W., Wang, C., et al. (2011) · Molecular Carcinogenesis · doi:10.1002/mc.20712 · Cited by 567
Pirola, C. J., Fernández Gianotti, T., Castaño, G. O., Mallardi, P., San Martino, J., Mora Gonzalez Lopez Ledesma, M., Flichman, D., Mirshahi, F., Sanyal, A. J., & Sookoian, S. (2015) · Gut · doi:10.1136/gutjnl-2014-306996 · Cited by 564
MicroRNAs: novel regulators in cardiac development and disease
Thum, T., Catalucci, D., & Bauersachs, J. (2008) · Cardiovascular Research · doi:10.1093/cvr/cvn137 · Cited by 377
Cited by
Sorted by citations
Items 801–900 of 968
Hypoxia Regulates MicroRNA Expression in the Human Carotid Body
Mkrtchian, S., Lee, K. L., Kåhlin, J., Ebberyd, A., Poellinger, L., Fagerlund, M. J., & Eriksson, L. I. (2018) · Advances in experimental medicine and biology · doi:10.1007/978-3-319-91137-3_3 · Cited by 2
Zhang, T., Yang, Z., Kusumanchi, P., Han, S., & Liangpunsakul, S. (2023) · Elsevier eBooks · doi:10.1016/b978-0-12-820719-2.00016-8 · Cited by 2
MicroRNAs and Mammarenaviruses: Modulating Cellular Metabolism
Fernandes, J., Miranda, R. L., de Lemos, E. R. S., & Guterres, A. (2020) · Cells · doi:10.3390/cells9112525 · Cited by 2
mir200a and miR4695-5p profiling as potential biomarkers for preterm birth
Seyedhashemi, E., Entezari, M., Dargahi, R., Ghavami, Z., & Asl, S. H. (2021) · Gene Reports · doi:10.1016/j.genrep.2021.101021 · Cited by 2
miRNA Landscape in Primary Tumors and Matched Metastases in Gastrointestinal Stromal Tumors
Ravegnini, G., Serrano, C., Ricci, R., Zhang, Q., Terrenato, I., Graziosi, A., Valori, G., Landolfi, S., Hrelia, P., & Angelini, S. (2021) · Epigenomics · doi:10.2217/epi-2020-0303 · Cited by 2
The methodological challenge in high‐throughput profiling and quantifying microRNAs
Chai, M., Xiong, X., Wang, H., & Xu, L. (2021) · Quantitative Biology · doi:10.15302/j-qb-021-0284 · Cited by 1
Fu, T., Lin, Y., Lin, L., Yang, Y., Guo, Q., Long, Y., He, H., Bao, Y., Lin, T., Chen, J., et al. (2022) · Urologic Oncology Seminars and Original Investigations · doi:10.1016/j.urolonc.2022.05.003 · Cited by 1
Condello, V., & Juhlin, C. C. (2024) · European Thyroid Journal · doi:10.1530/etj-24-0298 · Cited by 1
-, S., -, K. S. B., -, D. N. G., Kumar, V., & -, S. S. (2025) · International Journal on Science and Technology · doi:10.71097/ijsat.v16.i2.4780 · Cited by 1
González‐Muñoz, S., Cerván‐Martín, M., Guzmán‐Jiménez, A., Rodríguez-Martín, A. I., Garrido, N., Castilla, J. A., Gonzalvo, M. C., Clavero, A., Molina, M., Vilches, M. Á., et al. (2025) · Human Reproduction · doi:10.1093/humrep/deaf107 · Cited by 1
Ren, T., Zhou, L., Li, Z., Pan, M., & Han, X. (2025) · Discover Oncology · doi:10.1007/s12672-025-02872-x · Cited by 1
Profiling of the microRNA transcriptome in feline whole blood
Ohlsson, Å., Hanås, S., Holst, B. S., Lorent, J., Andersson, G., Höglund, K., Tidholm, A., Ljungvall, I., & Häggström, J. U. (2025) · Scientific Reports · doi:10.1038/s41598-025-09478-x · Cited by 1
Cong, Z., Qiu, D., & Hu, H. (2025) · Medicine · doi:10.1097/md.0000000000043613 · Cited by 1
Ando, D., Rashad, S., & Niizuma, K. (2025) · International Journal of Molecular Sciences · doi:10.3390/ijms26188772 · Cited by 1
Zhang, J., Zhang, J., Zhang, M., Zhao, W., Wu, H., & Wang, R. (2025) · World Journal of Surgical Oncology · doi:10.1186/s12957-025-04032-5 · Cited by 1
Xie, H., Xue, Y., Deng, R., Chen, L., Wang, Y., Xu, J., Liu, H., Li, X., Cui, W., & Zhang, J. (2025) · Journal of Affective Disorders · doi:10.1016/j.jad.2025.120841 · Cited by 1
Pasquardini, L., Pitruzzella, R., Arcadio, F., Rizzuti, M., Melzi, V., Sironi, F. M., Vanzetti, L., Chiappini, A., Perri, C., Ottoboni, L., et al. (2025) · Sensors and Actuators Reports · doi:10.1016/j.snr.2025.100417 · Cited by 1
The role of microRNAs in calcific aortic valve disease
Yi-zhou, P., He, Y., Yang, Y., & Tang, L. L. (2026) · Frontiers in Cardiovascular Medicine · doi:10.3389/fcvm.2025.1637753 · Cited by 1
Something Old, Something New, Something Borrowed… About the Placenta
Nikolova, M., Mandadzhieva, S., Milova, N., Milov, A. D., & Yordanov, A. D. (2026) · Epigenomes · doi:10.3390/epigenomes10010005 · Cited by 1
Swolin‐Eide, D., Lyckå, A. P., Forsander, G., Novák, D., Grillari, J., Diendorfer, A. B., Hackl, M. J., & Magnusson, P. (2026) · PLoS ONE · doi:10.1371/journal.pone.0343117 · Cited by 1
“More” Artificial mRNAs: Beyond the Art of Nature
Cui, Y., Fukui, M., Ohno, H., & Saito, H. (2026) · Advanced Science · doi:10.1002/advs.202521523 · Cited by 1
Non-coding RNAs and Pain: From Bench to Bedside
Kummer, K. K., Kalpachidou, T., & Kress, M. (2020) · Elsevier eBooks · doi:10.1016/b978-0-12-805408-6.00010-5 · Cited by 1
Knyazeva, M. S., Zagoruiko, V. A., Khokhlova, A. V., Nazarova, I. V., Shalaev, A., Sidina, E., Zabegina, L., Artemyeva, A. S., Носов, А. К., Анатольевна, П. С., et al. (2022) · Advances in molecular oncology · doi:10.17650/2313-805x-2022-9-1-20-32 · Cited by 1
MicroRNA target prediction and validation
Thillaiyampalam, G., & Cristino, A. S. (2022) · Elsevier eBooks · doi:10.1016/b978-0-323-89774-7.00024-8 · Cited by 1
The autophagy pathway and its key regulators
Kataura, T., Hattori, N., & Saiki, S. (2022) · Elsevier eBooks · doi:10.1016/b978-0-323-89906-2.00013-7 · Cited by 1
Research Progress of miR-21 in Non-Alcoholic Fatty Liver Disease
彭, 冉. (2022) · Advances in Clinical Medicine · doi:10.12677/acm.2022.12121673 · Cited by 1
Dąbala, M., Świder, M., Kasela, T., Buda, P., & Grabarek, B. O. (2023) · Current Pharmaceutical Biotechnology · doi:10.2174/1389201024666230407122254 · Cited by 1
Single Cell Micro RNA Sequencing Library Preparation
Hücker, S. M., & Kirsch, S. (2024) · Methods in molecular biology · doi:10.1007/978-1-0716-3621-3_12 · Cited by 1
Begum, R. F., Mohan, S., Chitra, V., & Devi, S. (2022) · The Thai Journal of Pharmaceutical Sciences · doi:10.56808/3027-7922.2632 · Cited by 1
Wu, X., Heng, J.-H., Li, M., Deng, D.-X., Wu, B., Wang, M., Li, S., Gao, S., Qi, Y., & Li, E. (2024) · MedComm – Oncology · doi:10.1002/mog2.86 · Cited by 1
Ivovič, D., Kabelíková, P., Petrova, I. G., Holíčková, A., & Jurkovičová, D. (2024) · Elsevier eBooks · doi:10.1016/b978-0-443-21790-6.00011-0 · Cited by 1
Exploratory miRNA profiling from serum and bone tissue of mice with T1D-induced bone loss
Daamouch, S., Diendorfer, A. B., Hackl, M., Christoffel, G., Hofbauer, L. C., & Rauner, M. (2024) · Frontiers in Endocrinology · doi:10.3389/fendo.2024.1477257 · Cited by 1
Harnessing endogenous miRNA targeting ZIKV: A cutting-edge strategy to inhibit virus infection
Rosa, R. S. M., Palameta, S., Toscaro, J. M., Miller, M. E., Lopes-de-Oliveira, P. S., & Bajgelman, M. C. (2025) · Molecular Therapy — Nucleic Acids · doi:10.1016/j.omtn.2025.102562 · Cited by 1
Liu, W., Fu, H., Fang, S., Ni, J., & Peng, B. (2025) · International Journal of Molecular Sciences · doi:10.3390/ijms26167957 · Cited by 1
MIR192 upregulates GLP-1 receptor and rescues statin-induced impairment of insulin secretion
Kuang, Y., Locatelli, C. A. A., Zhang, Y., Qin, Y., Theusch, E., Munoz-Howell, A., Sanchez, G., Lu, M., Nguyen, M.-A., Yalamanchili, T., et al. (2026) · Cardiovascular Diabetology · doi:10.1186/s12933-026-03353-3 · Cited by 1
Patil, K. S., & Møller, S. G. (2019) · Springer eBooks · doi:10.1007/978-3-319-55530-0_58 · Cited by 1
MicroRNAs and Reference Gene Methodology
Matoušková, P. (2019) · Springer eBooks · doi:10.1007/978-3-319-55530-0_34 · Cited by 1
In Situ Hybridization for Detecting Mature MicroRNAs In Vivo at Single‐Cell Resolution
Minogue, A. L., & Arur, S. (2019) · Current Protocols in Molecular Biology · doi:10.1002/cpmb.93 · Cited by 1
Granzyme B and miR-378a Interaction in Acetaminophen Toxicity in Children
McCullough, S. S., Dweep, H., McGill, M. R., Bhattacharyya, S., James, L. P., Frankowski, S., Woodall, A., Kearns, G. L., & Gill, P. S. (2019) · MicroRNA · doi:10.2174/2211536608666190808144456 · Cited by 1
Catarata, M. J., Medeiros, R., Oliveira, M. J., Pêgo, A., Frade, J. G., Martins, M. F., Cordeiro, C. R. R., Herth, F. J. F., Thomas, M., Kriegsmann, M., et al. (2020) · Cancers · doi:10.3390/cancers12123834 · Cited by 1
Genome-wide Discovery of MicroRNA Biomarkers for Cancer Precision Medicine
Zhu, Z., Han, G., Huang, H., He, L., Chen, Y., Ke, J., Gao, F., Vermeulen, L., & Wang, X. (2020) · Royal Society of Chemistry eBooks · doi:10.1039/9781788019958-00001 · Cited by 1
microRNAs and Reference Gene Methodology
Matoušková, P. (2017) · Springer eBooks · doi:10.1007/978-3-319-31143-2_34-1 · Cited by 1
Jia, B., Wang, X., Ma, F., Li, X., Han, X., Zhang, L., Li, J., Diao, N.-C., Shi, K., Chen-xia, G., et al. (2022) · Frontiers in Veterinary Science · doi:10.3389/fvets.2022.1042445 · Cited by 1
miRNAs as Epigenetic Cancer Biomarker
Mamoori, A. (2023) · BENTHAM SCIENCE PUBLISHERS eBooks · doi:10.2174/9789815079364123010015 · Cited by 1
Bordeynik‐Cohen, M., Sperber, M., Ebbers, L., Messika-Gold, N., Krohs, C., Koffler-Brill, T., Noy, Y., Elkon, R., Nothwang, H. G., & Avraham, K. B. (2023) · RNA Biology · doi:10.1080/15476286.2023.2247628 · Cited by 1
Multicancer Early Detection Tests for Cancer Diagnosis
Hajra, K., Tripathi, D., & Maity, D. (2024) · Journal of Exploratory Research in Pharmacology · doi:10.14218/jerp.2023.00007 · Cited by 1
The plasma miR-122 basal levels respond to circulating catecholamines in ratsPreprint
Xu, P., Li, Q., Lu, S., He, X., Yu, S., Zhang, Z., Xu, G., Lu, L., Yang, T., Zhu, J., et al. (2018) · bioRxiv (Cold Spring Harbor Laboratory) · doi:10.1101/257402 · Cited by 1
Ago2-seq identifies new microRNA targets for seizure controlPreprint
Venø, M. T., Reschke, C. R., Morris, G., Connolly, N. M. C., Su, J., Yan, Y., Engel, T., Jimenez-Mateos, E. M., Harder, L. M., Pultz, D., et al. (2019) · bioRxiv (Cold Spring Harbor Laboratory) · doi:10.1101/777144 · Cited by 1
Harden, M. E. (2017) · Digital Access to Scholarship at Harvard (DASH) (Harvard University) · Cited by 1
Plasma Exosome-Derived MicroRNAs Panel: A Novel Predictor of Liver Injury in Cholecystitis PatientsPreprint
Wu, Z., Hou, M., Peng, H., Jin, Y., Tian, W., Zhuang, X., Zhang, Q., Zhang, L., Xing, X., Yu, Q., et al. (2022) · Research Square · doi:10.21203/rs.3.rs-1945357/v1 · Cited by 1
Gutmann, C., Stojković, S., & Mayr, M. (2023) · Circulation · doi:10.1161/circulationaha.122.062334 · Cited by 1
circHIPK3 nucleates IGF2BP2 and functions as a competing endogenous RNAPreprint
Okholm, T. L. H., Kamstrup, A. B., Nielsen, M. M., Hollensen, A. K., Graversgaard, M. L., Sørensen, M. H., Kristensen, L. S., Vang, S., Park, S. S., Yeo, G. W.-M., et al. (2024) · eLife · doi:10.7554/elife.91783.2 · Cited by 1
circHIPK3 nucleates IGF2BP2 and functions as a competing endogenous RNAPreprint
Okholm, T. L. H., Kamstrup, A. B., Nielsen, M. M., Hollensen, A. K., Graversgaard, M. L., Sørensen, M. H., Kristensen, L. S., Vang, S., Park, S. S., Yeo, G. W.-M., et al. (2024) · eLife · doi:10.7554/elife.91783.4 · Cited by 1
The functions of SETD5 and miR-221 in embryonic stem cell differentiation
Chen, T. (2017) · Digital Commons-TMC (Texas Medical Center)
MinQiang, Z. H. O. U., Zhang, Q., XingZhuo, Y. A. N. G., Yuan, M., Jia, C., & Li, M. (2018) · Scientia Sinica Vitae · doi:10.1360/n052017-00300
Comprehensive Analysis of Hippocampal Mirnaomes in Humans and Mice
Chen, W., Zhang, L., Shi, C., Ren, G., Kong, Q., & Qin, C. (2018) · Epigenomics · doi:10.2217/epi-2017-0161
Genome-wide profiling of microRNAs and prediction of mRNA targets in 17 bovine tissuesPreprint
Wang, M., Chamberlain, A. J., Prowse-Wilkins, C., Jagt, C. J. V., Hancock, T., Pryce, J. E., Cocks, B. G., Goddard, M. E., & Hayes, B. J. (2019) · bioRxiv (Cold Spring Harbor Laboratory) · doi:10.1101/574954
Analysis of spatiotemporal specificity of small RNAs regulating hPSC differentiation and beyondPreprint
Li, L., Li, J. F., Cao, D., Papadopoulos, V., & Chan, W. (2019) · bioRxiv (Cold Spring Harbor Laboratory) · doi:10.1101/784819
Agrawal, S., & Becker, C. M. (2019) · Springer eBooks · doi:10.1007/978-3-030-28584-5_12
Diagnostic and Prognostic Value of Selected MicroRNAs in Patients with Acute Heart FailurePreprint
Sadat‐Ebrahimi, S., Aslanabadi, N., Asadi, M., Zafari, V., Shanebandi, D., Zarredar, H., Enamzadeh, E., Taghizadeh, H., & Badalzadeh, R. (2020) · Research Square · doi:10.21203/rs.3.rs-117036/v1
Epigenetic Biomarker and Therapeutic Intervention for Dementia
Islam, R. (2021) · eDiss (Georg-August-Universität Göttingen) · doi:10.53846/goediss-8394
Epigenetics and physical exercise
Iglesias‐Gutiérrez, E., Pinilla, L., Barbé, F., & de Gonzalo‐Calvo, D. (2021) · Elsevier eBooks · doi:10.1016/b978-0-12-822258-4.00007-9
Lin, Z. (2018) · TSpace (University of Toronto)
miRNA-Detektion bei Osteoblasten
Schneider, S., Biberthaler, P., & Hanschen, M. (2020) · BIOspektrum · doi:10.1007/s12268-020-1464-5
Circulating miRNA Profiles Associated with Lung Function DeclinePreprint
Cheng, M., Xiao, Y., Ye, Z., Yu, L., Wang, B., Feng, X., Mu, G., Ma, J., & Chen, W. (2021) · Research Square · doi:10.21203/rs.3.rs-571086/v1
Elias, F. M. (2020) · Digital Library of Theses and Dissertations (Universidade de São Paulo) · doi:10.11606/d.5.2020.tde-22072021-142734
Purmann, C., Ang, C. E., Tanabe, K., Zhang, Y., Kundu, S., Dankó, T., Ma, S., Mitelpunkt, A., Wong, W. H., Bernstein, J. A., et al. (2021) · bioRxiv (Cold Spring Harbor Laboratory) · doi:10.1101/2021.10.14.464344
de Freitas, R. M., Pacheco, C., Felipe, S. M. D. S., Cavalcante, J. K. R., de Oliveira, P. E. G., Silva, D. S. D., & Ceccatto, V. M. (2021) · International Journal of Biochemistry Research & Review · doi:10.9734/ijbcrr/2021/v30i630274
The potential use of miRNAs in forensic science
Фанилевич, Г. И., Beylerli, O., & Измайлов, А. А. (2021) · Bulletin of Siberian Medicine · doi:10.20538/1682-0363-2021-3-129-140
MicroRNA Candidate Biomarkers for Parkinson’s Disease and Idiopathic REM Sleep Behavior DisorderPreprint
Wu, L., Liu, J., Li, Y., Cao, Y. J., Liu, W., Zhang, H., Zhao, A., & Luo, N. (2021) · Research Square · doi:10.21203/rs.3.rs-1163742/v1
MiRNA as Biomarkers of Mitochondrial Toxicity
Vleet, T. R. V., & Mahalingaiah, P. K. S. (2018) · Wiley eBooks · doi:10.1002/9781119329725.ch22
MicroRNAs as Future Treatment Tools and Diagnostic Biomarkers in Alzheimer’s Disease
Chauhan, H., Gupta, P. K., & Saxena, B. (2022) · IntechOpen eBooks · doi:10.5772/intechopen.103173
Chen, X., Huang, F., Liu, Y., Liu, S., & Ta, G. (2022) · Journal of Clinical Images and Medical Case Reports · doi:10.52768/2766-7820/1606
Micro RNA s as Non‐invasive Biomarkers of Toxicity and Chemical Hazard
Nelson, G. M., & Chorley, B. N. (2022) · Wiley eBooks · doi:10.1002/9781119807704.ch2
Patil, K. S., & Møller, S. G. (2017) · Springer eBooks · doi:10.1007/978-3-319-31143-2_58-1
OBSOLETE: Non-coding RNAs and Pain: From Bench to Bedside
Kummer, K. K. (2016) · Elsevier eBooks · doi:10.1016/b978-0-12-809324-5.00010-9
Xu, S., Li, X., Wu, S., & Yang, M. (2020) · Research Square · doi:10.21203/rs.3.rs-120610/v1
A Structural Potential of Rare Trinucleotide Repeat Tracts in RNA
Magner, D., Nowak, R., Lenartowicz, E., Pasternak, A., & Kierzek, R. (2022) · International Journal of Molecular Sciences · doi:10.3390/ijms23105850
MicroRNAs and epigenetic processes in FSE-provoked epilepsy
Henshall, D. C., & Brennan, G. P. (2022) · Elsevier eBooks · doi:10.1016/b978-0-323-89932-1.00016-0
Rocha, K. C. E. (2021) · Digital Library of Theses and Dissertations (Universidade de São Paulo) · doi:10.11606/t.42.2021.tde-18022022-122839
Role of Biomarker in the Diagnosis of Neurodegenerative Diseases
Haque, S. S., & Salam, M. (2022) · Neurological Sciences and Neurosurgery · doi:10.47275/2692-093x-121
Personalised Health Monitoring for Early Disease DetectionPreprint
Proksch, K., Bucchianico, A. D., Keizer, S., de Jongh, M., Regis, M., Rocchetta, R., Hang, C., Gomaz, L., Marjanovic, A., Nesenberend, D., et al. (2023) · doi:10.33774/miir-2023-mgp7g
Schmid, T., Wegener, F., Hotfiel, T., & Hoppe, M. W. (2023) · Journal of Experimental Orthopaedics · doi:10.1186/s40634-023-00645-5
Kijpaisalratana, N., Charnnarong, N., Payungporn, S., & Pisitkun, T. (2019) · Chula Digiverse · doi:10.58837/chula.the.2019.371
miRNA jako potencjalne biomarkery padaczki u dzieci
Rzepka-Migut, B., & Paprocka, J. (2024) · Child Neurology · doi:10.5603/cn.99009
Diagnostic, Prognostic and Theranostic Potential of miRNAs in Prostate Cancer
Savic-Radojevic, A. R., & Pljesa-Ercegovac, M. S. (2024) · Springer eBooks · doi:10.1007/978-3-031-51712-9_7
circHIPK3 nucleates IGF2BP2 and functions as a competing endogenous RNAPreprint
Okholm, T. L. H., Kamstrup, A. B., Nielsen, M. M., Hollensen, A. K., Graversgaard, M. L., Sørensen, M. H., Kristensen, L. S., Vang, S., Park, S. S., Yeo, G. W.-M., et al. (2024) · eLife · doi:10.7554/elife.91783.3
The expression levels of MIR375 and MIR451a genes in subacute thyroiditis
Koçak, M., Karakuş, N., & Çatak, M. (2024) · Çukurova medical journal (Online)/Çukurova medical journal · doi:10.17826/cumj.1379775
Author response: circHIPK3 nucleates IGF2BP2 and functions as a competing endogenous RNA
Okholm, T. L. H., Kamstrup, A. B., Nielsen, M. M., Hollensen, A. K., Graversgaard, M. L., Sørensen, M. H., Kristensen, L. S., Vang, S., Park, S. S., Yeo, G. W.-M., et al. (2024) · eLife · doi:10.7554/elife.91783.4.sa4
eLife Assessment: circHIPK3 nucleates IGF2BP2 and functions as a competing endogenous RNA
Golemis, E. A. (2024) · eLife · doi:10.7554/elife.91783.4.sa3
Metadata
- Authors
- Ludwig, N., Leidinger, P., Becker, K., Backes, C., Fehlmann, T., Pallasch, C., Rheinheimer, S., Meder, B., Stähler, C., Meese, E., & Keller, A.
- Affiliations
- Saarland University (DE)
- Cologne Excellence Cluster on Cellular Stress Responses in Aging Associated Diseases (DE)
- University Hospital Heidelberg (DE)
- Siemens Healthineers (Germany) (DE)
- Corresponding author
- Keller, Andreas
- ORCID
- Venue
- Nucleic Acids Research
- Publisher
- Oxford University Press (OUP)
- Published
- 2016-02-25
- Volume
- 44
- Issue
- 8
- Pages
- 3865-3877
- ISSN
- 0305-1048 (ISSN-L)
- 1362-4962
- PMC
- PMC4856985
- OpenAlex
- W2288482887
- Semantic Scholar
- dc9823564677f04a2e1f18bb6ed9f2c7fef80a0e
- Cited by
- 968
- References
- 29
- Citations by year
- 2026: 45 · 2025: 73 · 2024: 93 · 2023: 97 · 2022: 104 · 2021: 138 · 2020: 141 · 2019: 109 · 2018: 88 · 2017: 61 · 2016: 17
- FWCI
- 32.73
- Type
- journal article
- Language
- en
- Open access
- gold
- doi.org
- Licence
- Locations
- Nucleic Acids Research (publishedVersion, cc-by-nc)
- PubMed Central (publishedVersion, cc-by-nc)
- PubMed (publishedVersion)
- Kölner Universitäts PublikationsServer (Universität zu Köln) (publishedVersion)
- HighWire Press Open Archive (submittedVersion)
- Funders
- Universität des Saarlandes
- Topics
- Life Sciences › Biochemistry, Genetics and Molecular Biology › Cancer Research › MicroRNA in disease regulation
- Life Sciences › Biochemistry, Genetics and Molecular Biology › Molecular Biology › Gene expression and cancer classification
- Life Sciences › Agricultural and Biological Sciences › Plant Science › Plant Molecular Biology Research
- Keywords
- microRNA expression, human tissue atlas, miRNA abundance, miR-150, brain, lung, prostate, heart, rat comparison, postmortem tissue, web-based repository
- MeSH terms
- Adult, Aged, Animals, Humans, Male, Organ Specificity, Tissue Distribution, Reproducibility of Results, Databases, Nucleic Acid, MicroRNAs, Rats
About these checks
Registry, retraction, Cites and statistics results are computed, not judged, with one exception: a printed reference that no index lists is read once by a model before it counts as a citation error. Claims are extracted by a model and kept only when their quote appears verbatim in the text; each cited source is then checked, with a model’s help, for whether it says what the claim relies on. Those verdicts can be wrong — read the claim’s quote and the cited source before relying on one.
A language model drew the claims from the paper on 2026-11-06, under version 3 of the claim definition (model deepseek-v4.1-flash, prompt extract-v3).
A second model labelled each claim on 2026-11-06 (model jev-1.13-20260917, definition revision gold-guideline-v0.2).
Cited sources are checked with a language model’s help (gpt-6-sol).
Statistics and arithmetic are recomputed, not judged.
Confidence bands are shown only for fields calibrated on our annotated test set. None is calibrated yet, so no band is shown.
What counts as a claim ›How we measure confidence ›How we check this ›
Are you an author, or do you see a problem with this page? Request a review
