

The DOI matches its Crossref record; 44 of the 44 references it cites were found in a registry or an index.
Cross-reactive serum and memory B cell responses to spike protein in SARS-CoV-2 and endemic coronavirus infection
Open accessPreprint — published as 10.1038/s41467-021-23074-3
Abstract
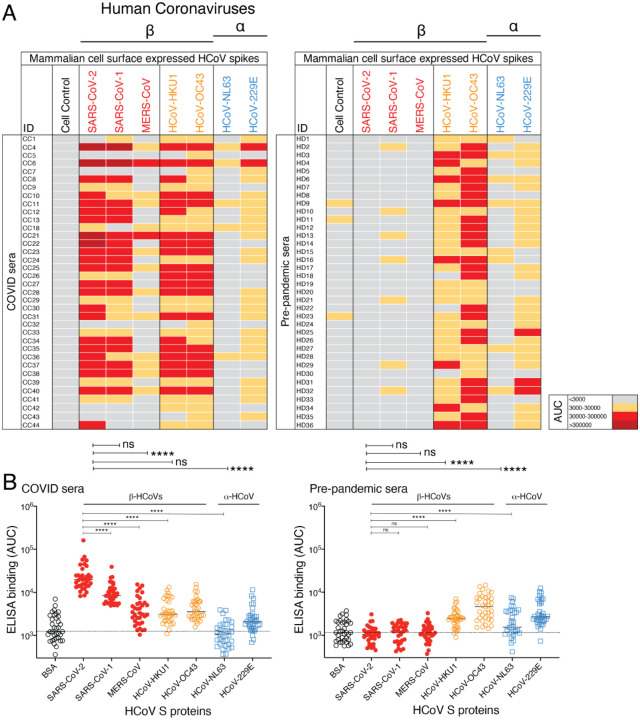
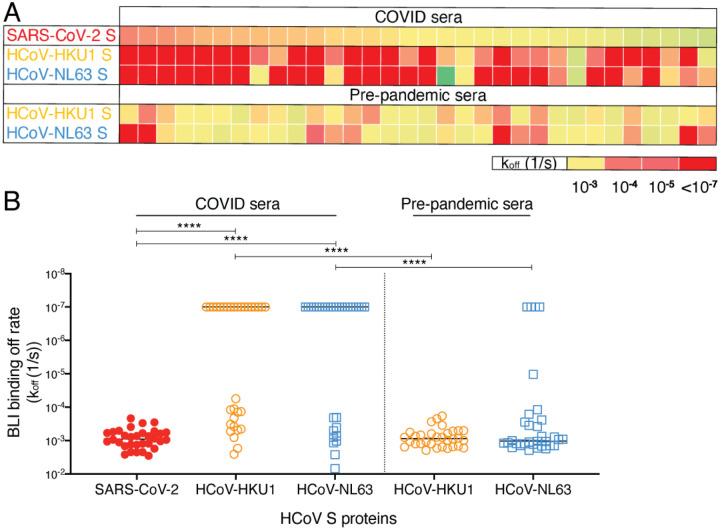
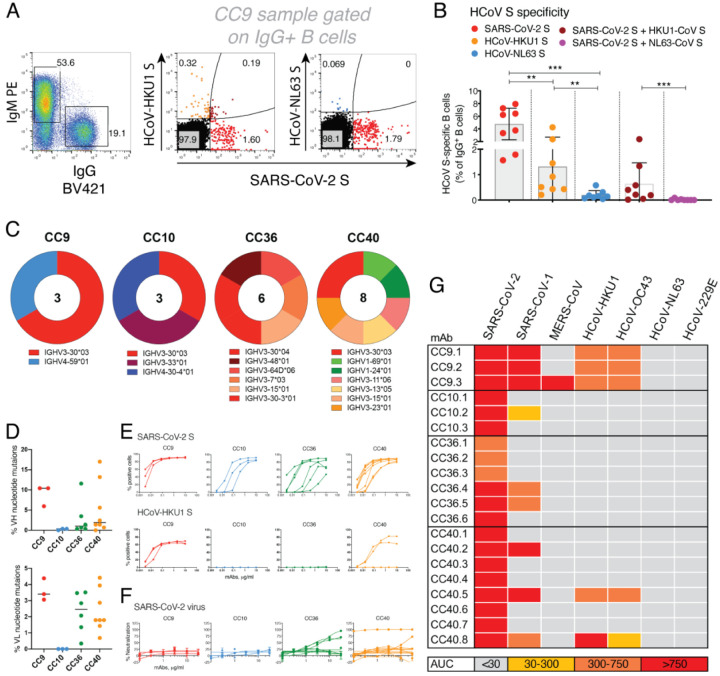
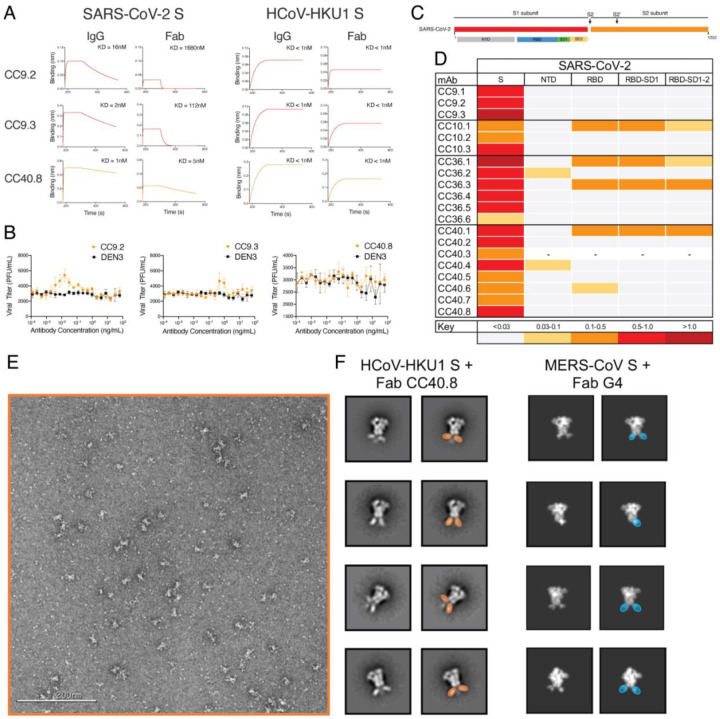
Pre-existing immune responses to seasonal endemic coronaviruses could have profound consequences for antibody responses to SARS-CoV-2, either induced in natural infection or through vaccination. Such consequences are well established in the influenza and flavivirus fields. A first step to establish whether pre-existing responses can impact SARS-CoV-2 infection is to understand the nature and extent of cross-reactivity in humans to coronaviruses. We compared serum antibody and memory B cell responses to coronavirus spike (S) proteins from pre-pandemic and SARS-CoV-2 convalescent donors using a series of binding and functional assays. We found weak evidence of pre-existing SARS-CoV-2 cross-reactive serum antibodies in pre-pandemic donors. However, we found stronger evidence of pre-existing cross-reactive memory B cells that were activated on SARS-CoV-2 infection. Monoclonal antibodies (mAbs) isolated from the donors showed varying degrees of cross-reactivity with betacoronaviruses, including SARS and endemic coronaviruses. None of the cross-reactive mAbs were neutralizing except for one that targeted the S2 subunit of the S protein. The results suggest that pre-existing immunity to endemic coronaviruses should be considered in evaluating antibody responses to SARS-CoV-2.
Overview
The claims and statistics of this paper haven’t been checked yet.
Run the check — free, no account needed. It reads the open-access text and checks the sources it cites.
Integrity signals
Registry
Cites
Statistics
Figures
Verification
Claims the paper makes
The claims and statistics of this paper haven’t been checked yet.
Run the check — free, no account needed. It reads the open-access text and checks the sources it cites.
Claims other papers make about this one
Each is checked against this paper’s own text: does it say what the citing paper says it does?
In the citing paper
“Neutralizing mAbs that bind regions of the viral spike have also been identified (24, 33, 38–42).”
From mRNA vaccination boosts cross-variant neutralizing antibodies elicited by SARS-CoV-2 infection (2021) · cites this paper as [41]
Self-check
Percentages, sums and reported differences re-computed from the paper’s own numbers.
The self-check needs the paper’s full text.
Citations
Cites
Lu, R., Zhao, X., Li, J., Niu, P., Yang, B., Wu, H., Wang, W., Song, H., Huang, B., Zhu, N., et al. (2020) · The Lancet · doi:10.1016/s0140-6736(20)30251-8 · Cited by 11,907
Cryo-EM structure of the 2019-nCoV spike in the prefusion conformation
Wrapp, D., Wang, N., Corbett, K. S., Goldsmith, J. A., Hsieh, C.-L., Abiona, O., Graham, B. S., & McLellan, J. S. (2020) · Science · doi:10.1126/science.abb2507 · Cited by 8,897
RELION: Implementation of a Bayesian approach to cryo-EM structure determination
Scheres, S. H. W. (2012) · Journal of Structural Biology · doi:10.1016/j.jsb.2012.09.006 · Cited by 5,446
Grifoni, A., Weiskopf, D., Ramirez, S. I., Mateus, J., Dan, J. M., Moderbacher, C. R., Rawlings, S. A., Sutherland, A., Premkumar, L., Jadi, R. S., et al. (2020) · Cell · doi:10.1016/j.cell.2020.05.015 · Cited by 3,595
Self-citationEmerging coronaviruses: Genome structure, replication, and pathogenesis
Chen, Y. Z., Liu, Q., & Guo, D. (2020) · Journal of Medical Virology · doi:10.1002/jmv.25681 · Cited by 3,069
Coronavirus Infections—More Than Just the Common Cold
Paules, C. I., Marston, H. D., & Fauci, A. S. (2020) · JAMA · doi:10.1001/jama.2020.0757 · Cited by 2,135
Convergent Antibody Responses to SARS-CoV-2 in Convalescent Individuals
Robbiani, D. F., Gaebler, C., Muecksch, F., Lorenzi, J. C. C., Wang, Z., Cho, A., Agudelo, M., Barnes, C. O., Gazumyan, A., Finkin, S., et al. (2020) · Nature · doi:10.1038/s41586-020-2456-9 · Cited by 1,853
Broad and Potent Neutralizing Antibodies from an African Donor Reveal a New HIV-1 Vaccine Target
Walker, L., Phogat, S., Chan-hui, P., Wagner, D., Pham, P., Goss, J. L., Wrin, T., Simek, M., Fling, S., Mitcham, J., et al. (2009) · Science · doi:10.1126/science.1178746 · Cited by 1,849
Self-citationRobust T Cell Immunity in Convalescent Individuals with Asymptomatic or Mild COVID-19
Sekine, T., Perez-Potti, A., Rivera-Ballesteros, O., Strålin, K., Gorin, J.-B., Olsson, A., Llewellyn-Lacey, S., Kamal, H., Bogdanovic, G., Muschiol, S., et al. (2020) · Cell · doi:10.1016/j.cell.2020.08.017 · Cited by 1,788
Rational Design of Envelope Identifies Broadly Neutralizing Human Monoclonal Antibodies to HIV-1
Wu, X., Yang, Z., Li, Y., Högerkorp, C., Schief, W. R., Seaman, M. S., Zhou, T., Schmidt, S. D., Wu, L., Xu, L., et al. (2010) · Science · doi:10.1126/science.1187659 · Cited by 1,724
Research works printed but not linked: 1
- 10.1016/S0140-6736(20)302518 · DOI
Cited by
Sorted by citations
Adaptive immunity to SARS-CoV-2 and COVID-19
Sette, A., & Crotty, S. (2021) · Cell · doi:10.1016/j.cell.2021.01.007 · Cited by 1,860
“The data also indicate that SARS-CoV-2 neutralizing antibody responses generally develop from naive B cells, not frompre-existing cross-reactive memory B cells (Anderson et al., 2020; Ng et al., 2020; Nguyen-Contant et al., 2020; Shrock et al., 2020; Song et al., 2020).”
Viral targets for vaccines against COVID-19
Dai, L., & Gao, G. F. (2020) · Nature reviews. Immunology · doi:10.1038/s41577-020-00480-0 · Cited by 1,056
Preexisting and de novo humoral immunity to SARS-CoV-2 in humans
Ng, K. W., Faulkner, N., Cornish, G. H., Rosa, A., Harvey, R., Hussain, S., Ulferts, R., Earl, C., Wrobel, A. G., Benton, D. J., et al. (2020) · Science · doi:10.1126/science.abe1107 · Cited by 886
Functional SARS-CoV-2-Specific Immune Memory Persists after Mild COVID-19
Rodda, L. B., Netland, J., Shehata, L., Pruner, K. B., Morawski, P. A., Thouvenel, C. D., Takehara, K. K., Eggenberger, J., Hemann, E. A., Waterman, H. R., et al. (2021) · Cell · doi:10.1016/j.cell.2020.11.029 · Cited by 647
“Because we detected RBD-specific IgM and IgD MBCs in HCs, we hypothesize that some of these could be cross-reactive MBCs generated in response to a previous human coronavirus infection as recent work suggests (Song et al., 2020).”
COVID-19 neutralizing antibodies predict disease severity and survivalPreprint
Garcia-Beltran, W., Lam, E., Astudillo, M., Yang, D., Miller, T., Feldman, J., Hauser, B., Caradonna, T. M., Clayton, K., Nitido, A. D., et al. (2020) · medRxiv · doi:10.1101/2020.10.15.20213512 · Cited by 683
“…particular, early rise of IgG and in some cases IgA—suggests the possibility of a contribution from class-switched (IgG+ or IgA+) memory B cells early in the humoral immune response rather than solely from the naive (IgM+) B cell pool, as has been recently postulated (Song et al. , 2020) .”
Metadata
- Authors
- Song, G., He, W.-T., Callaghan, S., Anzanello, F., Huang, D., Ricketts, J., Torres, J. L., Beutler, N., Peng, L., Vargas, S., Cassell, J., Parren, M., Yang, L., Ignacio, C., Smith, D. M., Voss, J. E., Nemazee, D., Ward, A. B., Rogers, T., Burton, D. R., & Andrabi, R.
- Affiliations
- Scripps Research Institute (US)
- University of California San Diego (US)
- Corresponding author
- Burton, Dennis R.
- Andrabi, Raiees
- ORCID
- Venue
- Nature Communications
- Publisher
- openRxiv
- Published
- 2020-09-23
- Volume
- 12
- Issue
- 1
- Pages
- 2938-2938
- ISSN
- 2041-1723 (ISSN-L)
- PMC
- PMC7523096
- OpenAlex
- W3161511556
- Cited by
- 285
- References
- 40
- Citations by year
- 2026: 15 · 2025: 17 · 2024: 30 · 2023: 53 · 2022: 78 · 2021: 85 · 2020: 7
- FWCI
- 19.48
- Type
- journal article
- Language
- en
- Open access
- gold
- doi.org
- Licence
- Locations
- Nature Communications (publishedVersion, cc-by)
- bioRxiv (Cold Spring Harbor Laboratory) (acceptedVersion, cc-by-nc-nd)
- PubMed Central (publishedVersion, cc-by)
- PubMed (publishedVersion)
- eScholarship (California Digital Library) (submittedVersion, cc-by)
- PubMed Central (submittedVersion, cc-by-nc-nd)
- RePEc: Research Papers in Economics (submittedVersion)
- DOAJ (DOAJ: Directory of Open Access Journals) (submittedVersion, cc-by-sa)
- eScholarship (California Digital Library) (submittedVersion)
- Funders
- Bill and Melinda Gates Foundation (OPP1170236, UM1 AI44462)
- International AIDS Vaccine Initiative
- National Institutes of Health (UM1 AI44462, COVID-19)
- National Institute of Allergy and Infectious Diseases (R01AI132317, R01AI073148, R56AI073148)
- Topics
- Health Sciences › Medicine › Infectious Diseases › SARS-CoV-2 and COVID-19 Research
- Life Sciences › Agricultural and Biological Sciences › Animal Science and Zoology › Animal Virus Infections Studies
- Life Sciences › Biochemistry, Genetics and Molecular Biology › Molecular Biology › vaccines and immunoinformatics approaches
- Keywords
- SARS-CoV-2, cross-reactive antibodies, memory B cells, spike protein, endemic coronaviruses, pre-existing immunity, SARS-CoV-1, betacoronaviruses, neutralizing antibodies, S2 subunit, monoclonal antibodies, antibody cross-reactivity, convalescent donors
About these checks
Registry, retraction, Cites and statistics results are computed, not judged, with one exception: a printed reference that no index lists is read once by a model before it counts as a citation error. Claims are extracted by a model and kept only when their quote appears verbatim in the text; each cited source is then checked, with a model’s help, for whether it says what the claim relies on. Those verdicts can be wrong — read the claim’s quote and the cited source before relying on one.
Statistics and arithmetic are recomputed, not judged.
Confidence bands are shown only for fields calibrated on our annotated test set. None is calibrated yet, so no band is shown.
What counts as a claim ›How we measure confidence ›How we check this ›
Are you an author, or do you see a problem with this page? Request a review
