

The DOI matches its Crossref record; 71 of the 71 references it cites were found in a registry or an index; 19 of the 29 sources its claims cite were checked for support.
Improved prediction of protein-protein interactions using AlphaFold2
Open accessPreprint — published as 10.1038/s41467-022-28865-w · Paper page
Abstract
Predicting the structure of interacting protein chains is a fundamental step towards understanding protein function. Unfortunately, no computational method can produce accurate structures of protein complexes. AlphaFold2, has shown unprecedented levels of accuracy in modelling single chain protein structures. Here, we apply AlphaFold2 for the prediction of heterodimeric protein complexes. We find that the AlphaFold2 protocol together with optimized multiple sequence alignments, generate models with acceptable quality (DockQ≥0.23) for 63% of the dimers. From the predicted interfaces we create a simple function to predict the DockQ score which distinguishes acceptable from incorrect models as well as interacting from non-interacting proteins with state-of-art accuracy. We find that, using the predicted DockQ scores, we can identify 51% of all interacting pairs at 1% FPR. The protocol can be found at: https://gitlab.com/ElofssonLab/FoldDock .
Overview
AI snapshot
Written from the paper’s full text.
TL;DR
AlphaFold2, combined with optimized paired MSAs, can fold-and-dock many heterodimeric protein complexes and predict model quality from the resulting interfaces. The derived pDockQ score separates acceptable from incorrect models and interacting from non-interacting proteins with state-of-art accuracy.
Key findings
- On the test set, AF2 + paired MSAs reached a success rate of 57.8% (856/1481), rising to 61.7% when five seeds were ranked by pDockQ; block diagonalization + paired MSAs with top-ranked models reached 62.7%. The best development-set result was 39.4% for AF2 + paired MSAs.
- pDockQ, a sigmoidal fit to interface pLDDT × log(interface contacts), predicted DockQ with an average error of 0.11 and separated acceptable models (DockQ ≥ 0.23) from incorrect ones with AUC 0.95; 31% of models were acceptable at 1% error and 54% at 10% error.
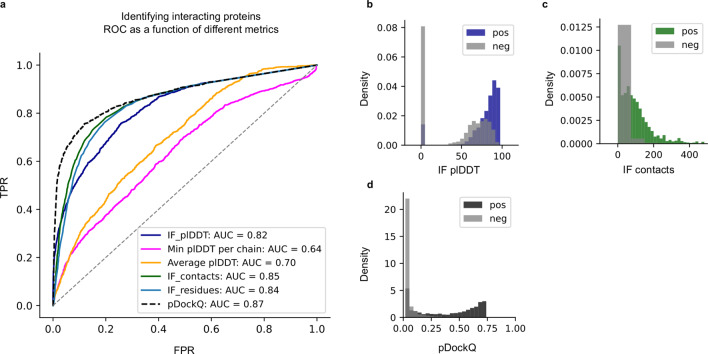
- For interacting vs non-interacting proteins (1481 positives, 5694 negatives), pDockQ gave AUC 0.87 and identified 51% of interacting pairs at 1% FPR, compared with 27%, 18%, and 13% for interface pLDDT, interface contacts, and interface residues, respectively.
- Performance varied by group: bacteria 73.7%, archaea 84.5%, eukarya 61%, virus 60%; E. coli 76.4%, S. cerevisiae 66.2%, H. sapiens 58.1%; helix interfaces 62%, sheet 59%, loop 53%; largest interface tertile 74% vs smallest 47%. AF2 outperformed tested docking methods, while AF-multimer reached 72.2% but was trained on the same data as the test set.
Methods
- AF2 was used to model heterodimeric complexes with a chain break, no templates, and relaxation off. The development set contained 216 Dockground complexes; the test set contained 1481 complexes; additional sets included six CASP14 heterodimers, eight novel PDB complexes, and 5694 non-interacting pairs (3989 E. coli + 1705 mammalian).
- MSA strategies compared default AF2 MSAs, organism-paired MSAs, block diagonalization MSAs, and combinations; AF2 model_1 vs model_1_ptm and different recycle/ensemble configurations were tested, with five seeds for the best strategy.
- Models were assessed with DockQ (acceptable ≥ 0.23), ROC/AUC, and pDockQ; comparisons included RoseTTAFold, GRAMM, MDockPP, TMdock, and AF-multimer.
Limitations
- Stated: only heterodimeric states are considered; alternative oligomeric states and larger biological assemblies are outside scope. Stated: interaction/non-interaction separation needs extension to compare interactions within individual organisms. Stated: the development vs test success-rate discrepancy (39.4% vs 57.8%) suggests unknown selection bias, and the development set is much smaller (216 vs 1481).
- Evident: AF-multimer comparison is difficult because it was trained using the same data as the test set. Evident: the initial non-interacting set was only E. coli while positives were mainly eukaryotic, so the authors added mammalian negatives to obtain a more realistic estimate.
- Evident: several analyses excluded complexes due to memory limits, MSA errors, missing Cβs, or DSSP failures (e.g., final test set 1481; DSSP 1391; RoseTTAFold 1455; AF-multimer 1458), which may affect generalizability.
Model-written summary. Check it against the paper before relying on it.
Integrity signals
Registry
Cites
Statistics
Figures
Verification
Claims the paper makes
39 Own result · 21 Own method · 13 Own interpretation · 12 Couldn’t confirm · 4 Supported · 4 No full text of the sources · 4 No basis given · 1 Supported so far · 1 Partly supported · 1 Not supported · 1 Sources not found · accuracy not yet measured
The sources with a verdict support this claim; the rest weren’t checked yet, have no full text we could read, or their verdicts aren’t rated yet.
In the paper
“We find that the MSA generation process can be sped up substantially at no performance loss (performance increase of 1% SR) by simply fusing MSAs from two HHblits34 runs on Uniclust3035 instead of using the MSAs from AF2.”
§ Improved prediction of protein-protein interactions using AlphaFold2 > Results and discussion > Findings and future prospects
What the sources say
- Supportedcites [34] source
The citation is attached to “HHblits,” while “We find” presents the speed and success-rate comparison as the citing authors’ own result. The source’s Software section describes using HHblits to build query MSAs, supporting that method citation. (LLM, conf=0.88)
- Not checked — no full text of the sourcecites [35] source
plaindirect- Asserted: passes — The authors put it forward as true.
- Checkable: passes — It can be checked against evidence.
- Load-bearing: passes — The paper’s conclusions depend on it.
- Based: passes — The paper gives a reason why it holds.
- Supported
The cited sources that could be checked couldn’t confirm or dispute this claim.
In the paper
“The higher performance in prokaryotes is consistent with previous observations regarding the availability of evolutionary information in prokaryotes compared to Eukarya27 (Supplementary Fig. 1).”
§ Improved prediction of protein-protein interactions using AlphaFold2 > Results and discussion > Bacterial complexes are predicted more accurately
What the sources say
- Could not verifycites [27] sourceExperimental — accuracy not yet measured
The Results section on PNN removal and the Discussion address grid-cell activity in rats, not evolutionary information or performance comparisons between prokaryotes and Eukarya. Searches for those terms and the claim’s distinctive phrase found no passage addressing the claim in our copy. (LLM, conf=0.78)
plaincorrelationaln = 1,481- Asserted: passes — The authors put it forward as true.
- Checkable: passes — It can be checked against evidence.
- Load-bearing: unclear — It is unclear whether the paper’s conclusions depend on it.
- Based: passes — The paper gives a reason why it holds.
- Could not verify
The cited sources that could be checked couldn’t confirm or dispute this claim.
In the paper
“The study of AF2s ability to separate interacting and non-interacting proteins here contains more extensive data than recent studies27.”
§ Improved prediction of protein-protein interactions using AlphaFold2 > Results and discussion > Limitations
What the sources say
- Could not verifycites [27] sourceExperimental — accuracy not yet measured
The Results section, “Reduced pairwise grid cell stability in a novel environment” (page unavailable), discusses correlations between rat grid cells after perineuronal-net degradation. Searches for AF2 and for interacting versus non-interacting proteins found no passage addressing that topic or comparing the extent of data with recent studies. (LLM, conf=0.78)
plain- Asserted: passes — The authors put it forward as true.
- Checkable: passes — It can be checked against evidence.
- Load-bearing: unclear — It is unclear whether the paper’s conclusions depend on it.
- Based: passes — The paper gives a reason why it holds.
- Could not verify
The cited sources that could be checked couldn’t confirm or dispute this claim.
In the paper
“Another recently published method obtains AUC 0.76 on this set27.”
§ Improved prediction of protein-protein interactions using AlphaFold2 > Results and discussion > Identifying interacting proteins
What the sources say
- Could not verifycites [27] sourceExperimental — accuracy not yet measured
The Results section reports 0.76 as a median spatial correlation for control grid cells, not as an AUC. A search for “AUC 0.76” and “area under the curve” found no passage reporting an AUC for a method on the cited set; the paper’s reported analyses concern grid-cell activity. (LLM, conf=0.76)
plain- Asserted: passes — The authors put it forward as true.
- Checkable: passes — It can be checked against evidence.
- Load-bearing: unclear — It is unclear whether the paper’s conclusions depend on it.
- Based: passes — The paper gives a reason why it holds.
- Could not verify
The cited sources that could be checked couldn’t confirm or dispute this claim.
In the paper
“There are currently 64,006 pairwise human protein interactions in the human reference interactome36.”
§ Improved prediction of protein-protein interactions using AlphaFold2 > Results and discussion > Findings and future prospects
What the sources say
- Could not verifycites [36] sourceExperimental — accuracy not yet measured
The Results section reports counts for the E. coli interactome, not a human reference interactome. Searches for “64,006 pairwise human protein interactions” and “human reference interactome” found no passage in our copy giving the claimed human interaction count. (LLM, conf=0.76)
plain- Asserted: passes — The authors put it forward as true.
- Checkable: passes — It can be checked against evidence.
- Load-bearing: passes — The paper’s conclusions depend on it.
- Based: passes — The paper gives a reason why it holds.
- Could not verify
The cited sources that could be checked couldn’t confirm or dispute this claim.
In the paper
“Pairing the correct sequences should result in MSAs containing inter-chain co-evolutionary information27.”
§ Improved prediction of protein-protein interactions using AlphaFold2 > Methods > Paired MSA generation
What the sources say
- Could not verifycites [27] sourceExperimental — accuracy not yet measured
The Methods section on spatiotemporal pairwise cross-correlations and the Results section on grid-cell stability concern correlations between neuronal firing patterns, not paired sequences. Searches for MSAs, inter-chain co-evolutionary information, and protein-sequence pairing found no passage addressing the claim; page numbers were not available in our copy. (LLM, conf=0.78)
hedgeddirect- Asserted: passes — The authors put it forward as true.
- Checkable: passes — It can be checked against evidence.
- Load-bearing: passes — The paper’s conclusions depend on it.
- Based: passes — The paper gives a reason why it holds.
- Could not verify
The cited sources that could be checked couldn’t confirm or dispute this claim.
In the paper
“The second set contains 1964 unique mammalian protein complexes filtered against the IntAct43 dataset from Negatome31.”
§ Improved prediction of protein-protein interactions using AlphaFold2 > Methods > Non-interacting proteins
What the sources say
- Could not verifycites [43] sourceExperimental — accuracy not yet measured
The Abstract and §2.1 Source data describe UniRef protein-sequence clusters built from UniProtKB and UniParc, not a set of non-interacting mammalian protein complexes. Searches for “1964,” “Negatome,” and “IntAct” found no passage in our copy addressing the claimed set or filtering step. (LLM, conf=0.78)
- Not matchedcites [31] 1997, Evaluation of GRAMM low-resolution docking methodology on the hemagglutinin-antibody complex, Proteins
Couldn’t be matched to a paper in Crossref, so it can’t be checked.
plain- Asserted: passes — The authors put it forward as true.
- Checkable: passes — It can be checked against evidence.
- Load-bearing: passes — The paper’s conclusions depend on it.
- Based: passes — The paper gives a reason why it holds.
- Could not verify
The cited sources that could be checked couldn’t confirm or dispute this claim.
In the paper
“Two methods were used to identify non-interacting proteins, first a set of proteins with no reported interaction signal in Yeast Two-Hybrid Experiments41 and secondly complexes whose individual proteins were found in different APMS benchmark complexes42. This dataset contains in total 3989 non-interacting pairs.”
§ Improved prediction of protein-protein interactions using AlphaFold2 > Methods > Non-interacting proteins
What the sources say
- Could not verifycites [41] sourceExperimental — accuracy not yet measured
The Results (‘Sensitivity benchmark’; page unavailable) describe a SCOP-domain benchmark for detecting homologous sequences, not a dataset of non-interacting E. coli protein pairs. Searches for ‘3989 non-interacting pairs’ and for yeast two-hybrid and APMS methods found no passage supporting the claimed dataset or its construction. (LLM, conf=0.76)
- Not matchedcites [42] 2020, MGnify: the microbiome analysis resource in 2020, Nucleic Acids Res
Couldn’t be matched to a paper in Crossref, so it can’t be checked.
plain- Asserted: passes — The authors put it forward as true.
- Checkable: passes — It can be checked against evidence.
- Load-bearing: passes — The paper’s conclusions depend on it.
- Based: passes — The paper gives a reason why it holds.
- Could not verify
A result the paper reports from its own data — it cites no other source for it, so there is none to check. The quote shows it is in the paper.
In the paper
“It is thereby evident that combining both paired and AF2 MSAs is superior to using them separately.”
- Also stated in: § Test set performance · hedged
“Using the combination of AF2 and paired MSAs increases performance, suggesting that AF2 gains both from larger and paired MSAs, although it often can manage with less information.”
hedgeddirect- Asserted: passes — The authors put it forward as true.
- Checkable: passes — It can be checked against evidence.
- Load-bearing: passes — The paper’s conclusions depend on it.
- Based: passes — The paper gives a reason why it holds.
- Also stated in: § Test set performance · hedged
A result the paper reports from its own data — it cites no other source for it, so there is none to check. The quote shows it is in the paper.
In the paper
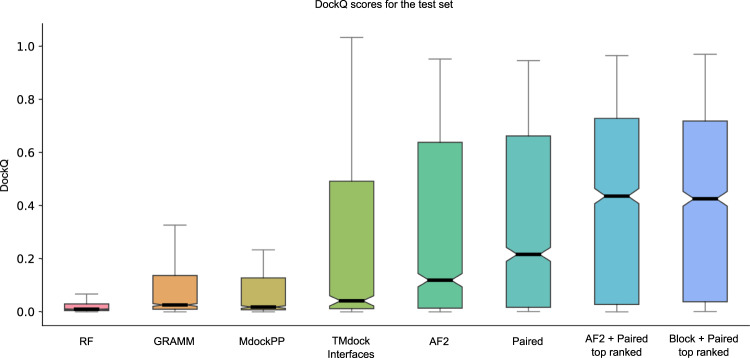
“What is most striking is that AF2 outperforms all other tested docking methods by a large margin (Fig. 1, Table 2).”
- Also stated in: § Findings and future prospects · boosted
“Even using the default settings, it is clear that AF2 is superior to all other tested docking methods, including other Fold and Dock methods17,24, methods based on shape complementarity30,32 and template-based docking.”
boosteddirect- Asserted: passes — The authors put it forward as true.
- Checkable: passes — It can be checked against evidence.
- Load-bearing: passes — The paper’s conclusions depend on it.
- Based: passes — The paper gives a reason why it holds.
- Also stated in: § Findings and future prospects · boosted
- It may state two separate claims as one. 38
- Probably not a substantial claim. 36
- The quote only partly states this claim. 1
At least one cited source doesn’t support this claim or points to a different paper, and none confirmed it — see the verdicts below.
In the paper
“This method was trained using the same data as the test set, which makes a direct comparison difficult.”
§ Improved prediction of protein-protein interactions using AlphaFold2 > Results and discussion > Test set performance
What the sources say
- Disputedcites [28] sourceExperimental — accuracy not yet measured
The Training Regimen (p. 4) limits training structures to those released by 2018-04-30. The Results (p. 5) say Benchmark 2 contains structures released after that cutoff and that the reported Recent-PDB-Multimers pairs were filtered for similarity to the training set. The paper therefore contradicts the claim that AlphaFold-Multimer was trained on the same data as its test set; it does not attribute difficulty in direct comparison to such overlap. (LLM, conf=0.90)
Checked by a reasoning model — may be wrong.
plaindirect- Asserted: passes — The authors put it forward as true.
- Checkable: passes — It can be checked against evidence.
- Load-bearing: passes — The paper’s conclusions depend on it.
- Based: passes — The paper gives a reason why it holds.
It may state two separate claims as one.
- Disputed
Every source the paper cites for this claim was checked and supports it.
In the paper
“The recently developed AF-multimer28 has the best performance (SR = 72.2%, median = 0.560, Table 2).”
§ Improved prediction of protein-protein interactions using AlphaFold2 > Results and discussion > Test set performance
What the sources say
- Supportedcites [28] source
The paper identifies the system as AlphaFold-Multimer and reports improved performance over comparison systems (p. 1; Results, p. 6). In the citing sentence, reference 28 identifies AF-multimer; the 72.2% success rate and 0.560 median are attributed to the citing paper’s Table 2, not to this source. (LLM, conf=0.90)
plain- Asserted: passes — The authors put it forward as true.
- Checkable: passes — It can be checked against evidence.
- Load-bearing: passes — The paper’s conclusions depend on it.
- Based: passes — The paper gives a reason why it holds.
It may state two separate claims as one.
- Supported
Every source the paper cites for this claim was checked and supports it.
In the paper
“Here we show that AlphaFold216 (AF2) can predict the structure of many heterodimeric protein complexes, although it is trained to predict the structure of individual protein chains.”
§ Improved prediction of protein-protein interactions using AlphaFold2 > Results and discussion > Findings and future prospects
What the sources say
- Supportedcites [16] 2021, Highly accurate protein structure prediction with AlphaFold, Nature source
The citation identifies AlphaFold2 and supports the statement that it was trained on individual protein chains: Methods > Training regimen says that chains were sampled from PDB structures for training. The claim that it can predict many heterodimeric complexes is introduced as the citing authors’ own finding (‘Here we show’), not attributed to this source. (LLM, conf=0.90)
plain- Asserted: passes — The authors put it forward as true.
- Checkable: passes — It can be checked against evidence.
- Load-bearing: passes — The paper’s conclusions depend on it.
- Based: passes — The paper gives a reason why it holds.
It may state two separate claims as one.
- Supported
The cited sources that could be checked couldn’t confirm or dispute this claim.
In the paper
“We used 1661 protein complexes with known interfaces from a recent study27 to test the developed pipeline.”
§ Improved prediction of protein-protein interactions using AlphaFold2 > Methods > Test set
What the sources say
- Could not verifycites [27] sourceExperimental — accuracy not yet measured
The Results section on grid cell representations in familiar environments reports recorded neuronal units, not protein complexes. Searches for “1661 protein complexes with known interfaces” and “protein complexes interface pipeline test set” found no passage in our copy addressing the claimed test set. (LLM, conf=0.78)
plain- Asserted: passes — The authors put it forward as true.
- Checkable: passes — It can be checked against evidence.
- Load-bearing: passes — The paper’s conclusions depend on it.
- Based: passes — The paper gives a reason why it holds.
Probably not a substantial claim.
- Could not verify
The cited sources that could be checked couldn’t confirm or dispute this claim.
In the paper
“Interestingly, no additional constraints are implemented in AF2 to pull two chains in contact, meaning that chain interactions (and subsequently interface sizes) are exclusively determined by the amount of inter-chain signals extracted by the predictor.”
§ Improved prediction of protein-protein interactions using AlphaFold2 > Results and discussion > Findings and future prospects
What the sources say
- Could not verifycites [16] 2021, Highly accurate protein structure prediction with AlphaFold, Nature sourceExperimental — accuracy not yet measured
The “MSA depth and cross-chain contacts” section discusses how contacts with other chains affect prediction accuracy and shows a homotrimer predicted without input stoichiometry. It does not say whether AF2 applies constraints to bring chains together or whether inter-chain signals exclusively determine interactions and interface sizes. Searches for those constraints, signals, and interface size found no passage addressing that claim. (LLM, conf=0.73)
plaindirect- Asserted: passes — The authors put it forward as true.
- Checkable: passes — It can be checked against evidence.
- Load-bearing: passes — The paper’s conclusions depend on it.
- Based: passes — The paper gives a reason why it holds.
It may state two separate claims as one.
- Could not verify
Every source the paper cites for this claim was checked and supports it.
In the paper
“We note that performing model relaxation did not increase performance in the AF2 paper16 and was, therefore, ignored to save computational cost.”
§ Improved prediction of protein-protein interactions using AlphaFold2 > Methods > AlphaFold2
What the sources say
- Supportedcites [16] 2021, Highly accurate protein structure prediction with AlphaFold, Nature source
The End-to-end structure prediction section states that final relaxation did not improve accuracy as measured by GDT or lDDT-Cα. The decision to omit relaxation to save computational cost is the citing authors’ own choice, not a claim attributed to the AF2 paper; the AF2 paper says it performed relaxation. (LLM, conf=0.93)
plain- Asserted: passes — The authors put it forward as true.
- Checkable: passes — It can be checked against evidence.
- Load-bearing: passes — The paper’s conclusions depend on it.
- Based: passes — The paper gives a reason why it holds.
It may state two separate claims as one.
- Supported
Every source the paper cites for this claim was checked and supports it.
In the paper
“Further, AF2 has been shown to perform well for single chains without templates and has reported higher accuracy than template-based methods even when robust templates are available16.”
§ Improved prediction of protein-protein interactions using AlphaFold2 > Methods > AlphaFold2
What the sources say
- Supportedcites [16] 2021, Highly accurate protein structure prediction with AlphaFold, Nature source
The Main section (page unavailable) reports high accuracy for full-chain predictions, including new folds, and says AlphaFold considerably improves on template-based methods even when strong templates are available. The Methods section states that some models were trained without templates. (LLM, conf=0.90)
boostedcorrelational- Asserted: passes — The authors put it forward as true.
- Checkable: passes — It can be checked against evidence.
- Load-bearing: fails — The paper’s conclusions may not depend on it.
- Based: passes — The paper gives a reason why it holds.
Probably not a substantial claim. The paper’s conclusions may not depend on it. It may state two separate claims as one.
- Supported
The cited sources that could be checked couldn’t confirm or dispute this claim.
In the paper
“As the bound form of the proteins is used, this should represent an easy case for GRAMM-based docking, and performance drops significantly when unbound structures or models are used53.”
§ Improved prediction of protein-protein interactions using AlphaFold2 > Methods > GRAMM
What the sources say
- Could not verifycites [53] 2016, DockQ: A Quality Measure for Protein-Protein Docking Models, PLoS One sourceExperimental — accuracy not yet measured
The Materials and Methods (Training set; page unavailable) describes docking models generated with SwarmDock, while the Results and Discussion evaluates DockQ as a quality measure. Searches for GRAMM and bound-versus-unbound docking performance found no passage supporting the claimed performance drop. (LLM, conf=0.76)
plaindirect- Asserted: passes — The authors put it forward as true.
- Checkable: passes — It can be checked against evidence.
- Load-bearing: fails — The paper’s conclusions may not depend on it.
- Based: passes — The paper gives a reason why it holds.
Probably not a substantial claim. The paper’s conclusions may not depend on it. It may state two separate claims as one.
- Could not verify
The cited sources support only part of this claim — read each source’s verdict below.
In the paper
“The second model, model_1_ptm, is a fine-tuned version of model_1 that predicts the TMscore52 and alignment errors16.”
§ Improved prediction of protein-protein interactions using AlphaFold2 > Methods > AlphaFold2
What the sources say
- Partly supportedcites [16] 2021, Highly accurate protein structure prediction with AlphaFold, Nature sourceExperimental — accuracy not yet measured
The Methods > Training regimen section says the authors fine-tuned five models to add a pTM prediction objective. End-to-end structure prediction says the TM-score estimate is obtained from a pairwise error prediction. Our copy does not identify the fine-tuned model specifically as model_1_ptm or establish its relationship to a model named model_1. (LLM, conf=0.82)
- Not checked — no full text of the sourcecites [52] 2018, Contact Potential for Structure Prediction of Proteins and Protein Complexes from Potts Model, Biophys. J source
plain- Asserted: passes — The authors put it forward as true.
- Checkable: passes — It can be checked against evidence.
- Load-bearing: fails — The paper’s conclusions may not depend on it.
- Based: passes — The paper gives a reason why it holds.
Probably not a substantial claim. The paper’s conclusions may not depend on it.
- Partly supported
The cited sources that could be checked couldn’t confirm or dispute this claim.
In the paper
“The RoseTTAFold pipeline for complex modelling only generates MSAs for bacterial protein complexes, while the proteins in our test set are mainly Eukaryotic.”
§ Improved prediction of protein-protein interactions using AlphaFold2 > Methods > RoseTTAFold
What the sources say
- Could not verifycites [17] sourceExperimental — accuracy not yet measured
The ‘Direct generation of protein-protein complex models’ section says RoseTTAFold was tested on paired sequence alignments and describes a model of a human complex, but it does not say that its pipeline generates MSAs only for bacterial complexes. The source also cannot establish the composition of the citing authors’ test set. Searches for bacterial-only MSA generation and eukaryotic complexes did not resolve either point. (LLM, conf=0.72)
plain- Asserted: passes — The authors put it forward as true.
- Checkable: passes — It can be checked against evidence.
- Load-bearing: passes — The paper’s conclusions depend on it.
- Based: passes — The paper gives a reason why it holds.
It may state two separate claims as one.
- Could not verify
The cited sources that could be checked couldn’t confirm or dispute this claim.
In the paper
“The atom-atom contact energy AACE18 is used to score and rank all poses, as this has been shown to provide better results than shape-complementarity alone54.”
§ Improved prediction of protein-protein interactions using AlphaFold2 > Methods > GRAMM
What the sources say
- Could not verifycites [18] sourceExperimental — accuracy not yet measured
The Introduction discusses predicting inter-residue contacts, and §2.4.2 describes ranking structural matches by TM-score. Neither addresses AACE, docking-pose ranking, or a comparison with shape complementarity. Searches for those terms in our copy found no supporting passage; page numbers were not available. (LLM, conf=0.76)
- Not checked — no full text of the sourcecites [54] source
boosteddirect- Asserted: passes — The authors put it forward as true.
- Checkable: passes — It can be checked against evidence.
- Load-bearing: fails — The paper’s conclusions may not depend on it.
- Based: passes — The paper gives a reason why it holds.
Probably not a substantial claim. The paper’s conclusions may not depend on it. It may state two separate claims as one.
- Could not verify
The paper states this without a source or data behind it here, so there is nothing to check it against. The quote shows it is in the paper.
In the paper
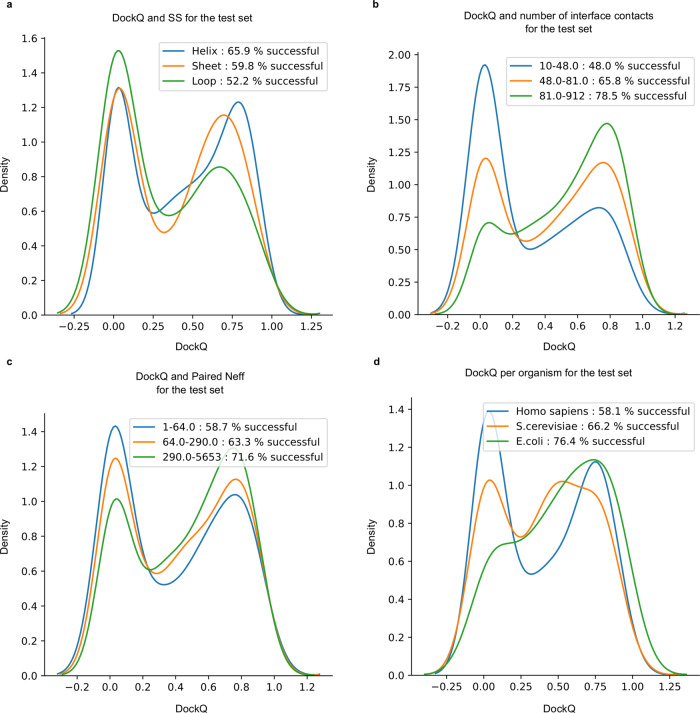
“It is clear that the fraction of correctly modelled sequences increases with larger Neff scores (Fig. 3c).”
direct- Asserted: fails — The authors may not put it forward as true.
- Checkable: passes — It can be checked against evidence.
- Load-bearing: fails — The paper’s conclusions may not depend on it.
- Based: fails — The paper may give no reason why it holds.
Probably not a substantial claim. The authors may not put it forward as true. The paper’s conclusions may not depend on it. The paper may give no reason why it holds.
A result the paper reports from its own data — it cites no other source for it, so there is none to check. The quote shows it is in the paper.
In the paper
“We find that the AlphaFold2 protocol together with optimised multiple sequence alignments, generate models with acceptable quality (DockQ ≥ 0.23) for 63% of the dimers.”
- Also stated in: § Findings and future prospects · plain
“Using optimised MSAs with AF2, we can accurately predict the structure of heterodimeric complexes for an unprecedented SR of 62.7% on a large test set.”
§ Improved prediction of protein-protein interactions using AlphaFold2 > Abstract
plaindirect- Asserted: passes — The authors put it forward as true.
- Checkable: passes — It can be checked against evidence.
- Load-bearing: passes — The paper’s conclusions depend on it.
- Based: passes — The paper gives a reason why it holds.
The quote only partly states this claim.
- Also stated in: § Findings and future prospects · plain
A result the paper reports from its own data — it cites no other source for it, so there is none to check. The quote shows it is in the paper.
In the paper
“The highest SR is obtained mainly for helix interfaces (62%), followed by interfaces containing mainly sheets (59%). The loop interface SR of 53% is substantially lower than the others, suggesting that interfaces with more flexible structures are harder to predict.”
§ Improved prediction of protein-protein interactions using AlphaFold2 > Results and discussion > Bacterial complexes are predicted more accurately
plaincorrelational- Asserted: passes — The authors put it forward as true.
- Checkable: passes — It can be checked against evidence.
- Load-bearing: unclear — It is unclear whether the paper’s conclusions depend on it.
- Based: passes — The paper gives a reason why it holds.
It may state two separate claims as one.
A result the paper reports from its own data — it cites no other source for it, so there is none to check. The quote shows it is in the paper.
In the paper
“The SRs for each kingdom is; Eukarya 61%, Bacteria 73.7%, Archaea 84.5%, and Virus 60% (Supplementary Fig. 1b).”
§ Improved prediction of protein-protein interactions using AlphaFold2 > Results and discussion > Bacterial complexes are predicted more accurately
plain- Asserted: passes — The authors put it forward as true.
- Checkable: passes — It can be checked against evidence.
- Load-bearing: passes — The paper’s conclusions depend on it.
- Based: passes — The paper gives a reason why it holds.
It may state two separate claims as one.
A result the paper reports from its own data — it cites no other source for it, so there is none to check. The quote shows it is in the paper.
In the paper
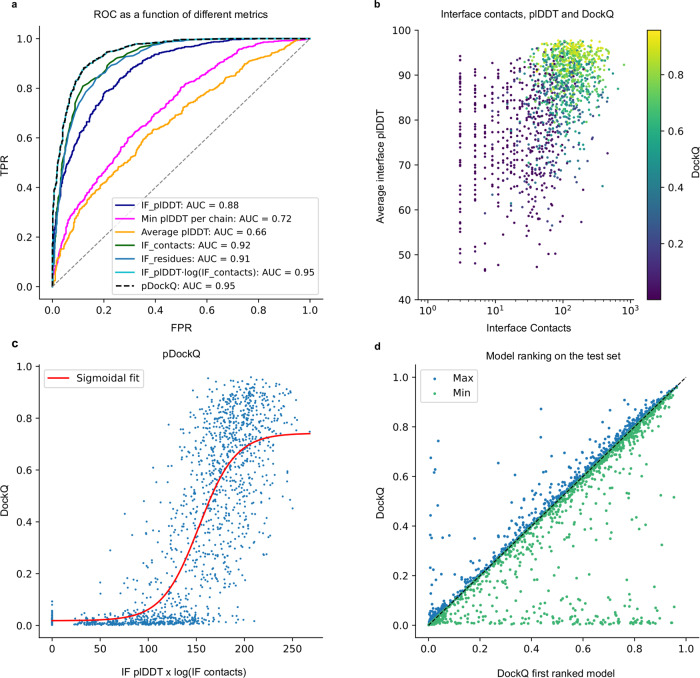
“At FPR 5%, the number of interface contacts and residues report TPRs of 49 and 42%, respectively, compared to 43% for the average interface plDDT and 66% for pDockQ.”
§ Improved prediction of protein-protein interactions using AlphaFold2 > Results and discussion > Identifying interacting proteins
plain- Asserted: passes — The authors put it forward as true.
- Checkable: passes — It can be checked against evidence.
- Load-bearing: passes — The paper’s conclusions depend on it.
- Based: passes — The paper gives a reason why it holds.
It may state two separate claims as one.
- Rests on an assumption: The 3989 E. coli proteins used as negatives are truly non-interacting.
- Rests on an assumption: The 1481 test set proteins used as positives are truly interacting.
A result the paper reports from its own data — it cites no other source for it, so there is none to check. The quote shows it is in the paper.
In the paper
“Between the five different initialisations, the average difference in the DockQ score is 0.03, and there is no deviation in SR, i.e., ranking did not improve the SR.”
§ Improved prediction of protein-protein interactions using AlphaFold2 > Results and discussion > CASP14 and novel proteins without templates
plain- Asserted: passes — The authors put it forward as true.
- Checkable: passes — It can be checked against evidence.
- Load-bearing: unclear — It is unclear whether the paper’s conclusions depend on it.
- Based: passes — The paper gives a reason why it holds.
It may state two separate claims as one.
A result the paper reports from its own data — it cites no other source for it, so there is none to check. The quote shows it is in the paper.
In the paper
“The best performance is 33.3% for the AF2 MSAs and 39.4% for the AF2+ paired MSAs (Table 1).”
§ Improved prediction of protein-protein interactions using AlphaFold2 > Results and discussion > Identifying the best AlphaFold2 model
plain- Asserted: passes — The authors put it forward as true.
- Checkable: passes — It can be checked against evidence.
- Load-bearing: passes — The paper’s conclusions depend on it.
- Based: passes — The paper gives a reason why it holds.
It may state two separate claims as one.
A result the paper reports from its own data — it cites no other source for it, so there is none to check. The quote shows it is in the paper.
In the paper
“The average SR (57.2% ± 0.0%) is similar for all five runs.”
§ Improved prediction of protein-protein interactions using AlphaFold2 > Results and discussion > Model variation and ranking for the test set
plain- Asserted: passes — The authors put it forward as true.
- Checkable: passes — It can be checked against evidence.
- Load-bearing: unclear — It is unclear whether the paper’s conclusions depend on it.
- Based: passes — The paper gives a reason why it holds.
It may state two separate claims as one.
In the paper
“The computational cost to run all of this is ~5 days on an Nvidia A100 system and has since the development of the pipeline presented here, deemed FoldDock, been applied37.”
§ Improved prediction of protein-protein interactions using AlphaFold2 > Results and discussion > Findings and future prospects
What the sources say
- Not checked — no full text of the sourcecites [37] source
plain- Asserted: passes — The authors put it forward as true.
- Checkable: passes — It can be checked against evidence.
- Load-bearing: fails — The paper’s conclusions may not depend on it.
- Based: passes — The paper gives a reason why it holds.
Probably not a substantial claim. The paper’s conclusions may not depend on it. It may state two separate claims as one.
A result the paper reports from its own data — it cites no other source for it, so there is none to check. The quote shows it is in the paper.
In the paper
“The AUC using the same metric for the ranked test set is 0.93, which means that 31% of all models are acceptable at an error rate of 1% and 54% at an error rate of 10% (Supplementary Table 2).”
§ Improved prediction of protein-protein interactions using AlphaFold2 > Results and discussion > Model variation and ranking for the test set
plaincorrelational- Asserted: passes — The authors put it forward as true.
- Checkable: passes — It can be checked against evidence.
- Load-bearing: passes — The paper’s conclusions depend on it.
- Based: passes — The paper gives a reason why it holds.
It may state two separate claims as one.
A result the paper reports from its own data — it cites no other source for it, so there is none to check. The quote shows it is in the paper.
In the paper
“Further, running five initialisations with random seeds and ranking the models using the predicted DockQ score (pDockQ, Fig. 2c), increases the SR to 61.7% and 62.7% for the AF2 + paired and block diagonalization+paired MSAs, respectively (model variation and ranking, Fig. 2).”
§ Improved prediction of protein-protein interactions using AlphaFold2 > Results and discussion > Test set performance
plaindirect- Asserted: passes — The authors put it forward as true.
- Checkable: passes — It can be checked against evidence.
- Load-bearing: passes — The paper’s conclusions depend on it.
- Based: passes — The paper gives a reason why it holds.
It may state two separate claims as one.
A result the paper reports from its own data — it cites no other source for it, so there is none to check. The quote shows it is in the paper.
In the paper
“The best outcome using this modelling strategy results in an SR of 57.8% (856 out of 1481 correctly modelled complexes) for the AF2 + paired MSAs compared with 45.0% using the AF2 MSAs alone (Fig. 1, Table 2).”
§ Improved prediction of protein-protein interactions using AlphaFold2 > Results and discussion > Test set performance
plain- Asserted: passes — The authors put it forward as true.
- Checkable: passes — It can be checked against evidence.
- Load-bearing: passes — The paper’s conclusions depend on it.
- Based: passes — The paper gives a reason why it holds.
It may state two separate claims as one.
A result the paper reports from its own data — it cites no other source for it, so there is none to check. The quote shows it is in the paper.
In the paper
“This enables the prediction of the DockQ scores (pDockQ) in a continuous manner with an overall average error of 0.11 on the test set.”
§ Improved prediction of protein-protein interactions using AlphaFold2 > Results and discussion > Distinguishing acceptable from incorrect models
plain- Asserted: passes — The authors put it forward as true.
- Checkable: passes — It can be checked against evidence.
- Load-bearing: passes — The paper’s conclusions depend on it.
- Based: passes — The paper gives a reason why it holds.
It may state two separate claims as one.
A result the paper reports from its own data — it cites no other source for it, so there is none to check. The quote shows it is in the paper.
In the paper
“We divide the dataset by interface size, and find that pairs with larger interfaces are easier to predict, as the SR increases from 47 to 74% between the smallest and biggest tertiles (Fig. 3b).”
§ Improved prediction of protein-protein interactions using AlphaFold2 > Results and discussion > Bacterial complexes are predicted more accurately
plaindirect- Asserted: passes — The authors put it forward as true.
- Checkable: passes — It can be checked against evidence.
- Load-bearing: unclear — It is unclear whether the paper’s conclusions depend on it.
- Based: passes — The paper gives a reason why it holds.
It may state two separate claims as one.
- The authors state this as an assumption: All residues in an interface contribute to the interaction energy.
A result the paper reports from its own data — it cites no other source for it, so there is none to check. The quote shows it is in the paper.
In the paper
“On this combined set of 1481 interacting and 5694 non-interacting proteins, we obtain an AUC of 0.82 for the average interface plDDT and slightly higher (0.84 and 0.85) for the number of interface contacts and residues, respectively (Fig. 5a). pDockQ results in an ROC curve with an AUC of 0.87.”
§ Improved prediction of protein-protein interactions using AlphaFold2 > Results and discussion > Identifying interacting proteins
plaincorrelational- Asserted: passes — The authors put it forward as true.
- Checkable: passes — It can be checked against evidence.
- Load-bearing: passes — The paper’s conclusions depend on it.
- Based: passes — The paper gives a reason why it holds.
It may state two separate claims as one.
A result the paper reports from its own data — it cites no other source for it, so there is none to check. The quote shows it is in the paper.
In the paper
“It took 7884 s for generating the AF2 MSAs, the single-chain searches took 338 s on average and the pairing 2 s.”
§ Improved prediction of protein-protein interactions using AlphaFold2 > Methods > Computational cost
plain- Asserted: passes — The authors put it forward as true.
- Checkable: passes — It can be checked against evidence.
- Load-bearing: fails — The paper’s conclusions may not depend on it.
- Based: passes — The paper gives a reason why it holds.
Probably not a substantial claim. The paper’s conclusions may not depend on it.
The paper states this without a source or data behind it here, so there is nothing to check it against. The quote shows it is in the paper.
In the paper
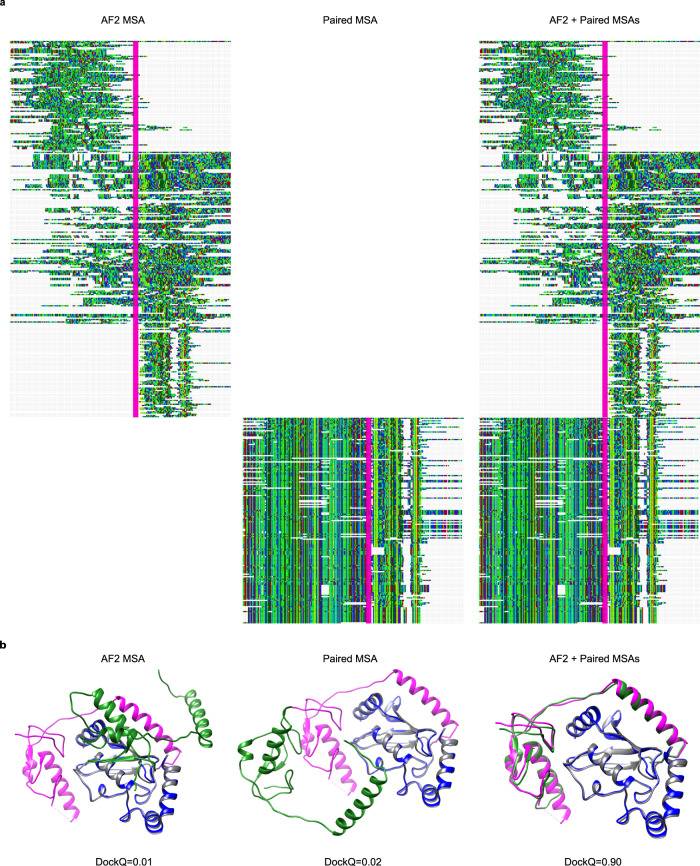
“The resulting MSAs will thus mainly contain gaps for one of the two query proteins in each row, as only single chains can obtain hits in the searched databases (Fig. 6).”
§ Improved prediction of protein-protein interactions using AlphaFold2 > Methods > AlphaFold2 default MSA generation methodology
plaindirect- Asserted: passes — The authors put it forward as true.
- Checkable: passes — It can be checked against evidence.
- Load-bearing: passes — The paper’s conclusions depend on it.
- Based: passes — The paper gives a reason why it holds.
It may state two separate claims as one.
The paper states this without a source or data behind it here, so there is nothing to check it against. The quote shows it is in the paper.
In the paper
“Together there are 5694 non-interacting protein complexes.”
§ Improved prediction of protein-protein interactions using AlphaFold2 > Methods > Non-interacting proteins
plain- Asserted: passes — The authors put it forward as true.
- Checkable: passes — It can be checked against evidence.
- Load-bearing: fails — The paper’s conclusions may not depend on it.
- Based: passes — The paper gives a reason why it holds.
Probably not a substantial claim. The paper’s conclusions may not depend on it.
A result the paper reports from its own data — it cites no other source for it, so there is none to check. The quote shows it is in the paper.
In the paper
“Fusing the MSAs took 3 s on average per tested complex.”
§ Improved prediction of protein-protein interactions using AlphaFold2 > Methods > Computational cost
plain- Asserted: passes — The authors put it forward as true.
- Checkable: passes — It can be checked against evidence.
- Load-bearing: fails — The paper’s conclusions may not depend on it.
- Based: passes — The paper gives a reason why it holds.
Probably not a substantial claim. The paper’s conclusions may not depend on it.
A result the paper reports from its own data — it cites no other source for it, so there is none to check. The quote shows it is in the paper.
In the paper
“It took 7884 s for generating the AF2 MSAs, the single-chain searches took 338 s on average and the pairing 2 s.”
§ Improved prediction of protein-protein interactions using AlphaFold2 > Methods > Computational cost
plain- Asserted: passes — The authors put it forward as true.
- Checkable: passes — It can be checked against evidence.
- Load-bearing: fails — The paper’s conclusions may not depend on it.
- Based: passes — The paper gives a reason why it holds.
Probably not a substantial claim. The paper’s conclusions may not depend on it.
A result the paper reports from its own data — it cites no other source for it, so there is none to check. The quote shows it is in the paper.
In the paper
“The pairing and fusing are thereby negligible compared to searching, resulting in a speedup of 24 times for the hhblits searches.”
§ Improved prediction of protein-protein interactions using AlphaFold2 > Methods > Computational cost
plaindirect- Asserted: passes — The authors put it forward as true.
- Checkable: passes — It can be checked against evidence.
- Load-bearing: unclear — It is unclear whether the paper’s conclusions depend on it.
- Based: passes — The paper gives a reason why it holds.
It may state two separate claims as one.
A result the paper reports from its own data — it cites no other source for it, so there is none to check. The quote shows it is in the paper.
In the paper
“In comparison, folding using the m1-10-1 strategy took 191 s on average for these pairs.”
§ Improved prediction of protein-protein interactions using AlphaFold2 > Methods > Computational cost
plain- Asserted: passes — The authors put it forward as true.
- Checkable: passes — It can be checked against evidence.
- Load-bearing: fails — The paper’s conclusions may not depend on it.
- Based: passes — The paper gives a reason why it holds.
Probably not a substantial claim. The paper’s conclusions may not depend on it.
A result the paper reports from its own data — it cites no other source for it, so there is none to check. The quote shows it is in the paper.
In the paper
“It took 7884 s for generating the AF2 MSAs, the single-chain searches took 338 s on average and the pairing 2 s.”
§ Improved prediction of protein-protein interactions using AlphaFold2 > Methods > Computational cost
plain- Asserted: passes — The authors put it forward as true.
- Checkable: passes — It can be checked against evidence.
- Load-bearing: fails — The paper’s conclusions may not depend on it.
- Based: passes — The paper gives a reason why it holds.
Probably not a substantial claim. The paper’s conclusions may not depend on it.
In the paper
“This score is created by fitting a sigmoidal curve (Fig. 2c) using “curve_fit” from SciPy v.1.4.156, to the DockQ scores using the average interface plDDT multiplied with the logarithm of the number of interface contacts, with the following sigmoidal equation:”
§ Improved prediction of protein-protein interactions using AlphaFold2 > Methods > pDockQ
What the sources say
- Not checked — no full text of the sourcecites [56] source
plaindirect- Asserted: passes — The authors put it forward as true.
- Checkable: passes — It can be checked against evidence.
- Load-bearing: passes — The paper’s conclusions depend on it.
- Based: passes — The paper gives a reason why it holds.
Probably not a substantial claim.
What the paper did — it cites no source for this, so there is none to check. The quote shows it is in the paper.
In the paper
“Some structures failed to be modelled for various reasons (see limitations of data generation), resulting in a total of 1481 structures.”
§ Improved prediction of protein-protein interactions using AlphaFold2 > Methods > Test set
plaindirect- Asserted: passes — The authors put it forward as true.
- Checkable: passes — It can be checked against evidence.
- Load-bearing: fails — The paper’s conclusions may not depend on it.
- Based: passes — The paper gives a reason why it holds.
Probably not a substantial claim. The paper’s conclusions may not depend on it. It may state two separate claims as one.
What the paper did — it cites no source for this, so there is none to check. The quote shows it is in the paper.
In the paper
“AF2 MSAs could not be generated for three of the complexes due to memory limitations (1gg2, 2nqd and 2xwb) using a computational node with 128 Gb RAM for the MSA generation and were thus disregarded, resulting in a total of 216 complexes.”
§ Improved prediction of protein-protein interactions using AlphaFold2 > Methods > Development set
plaindirect- Asserted: passes — The authors put it forward as true.
- Checkable: passes — It can be checked against evidence.
- Load-bearing: fails — The paper’s conclusions may not depend on it.
- Based: passes — The paper gives a reason why it holds.
Probably not a substantial claim. The paper’s conclusions may not depend on it. It may state two separate claims as one.
What the paper did — it cites no source for this, so there is none to check. The quote shows it is in the paper.
In the paper
“Unbound chains share at least 97% sequence identity with the bound counterpart and, to facilitate comparisons, non-matching residues are deleted and renumbered to become identical to the unbound counterpart.”
§ Improved prediction of protein-protein interactions using AlphaFold2 > Methods > Development set
plain- Asserted: passes — The authors put it forward as true.
- Checkable: passes — It can be checked against evidence.
- Load-bearing: passes — The paper’s conclusions depend on it.
- Based: passes — The paper gives a reason why it holds.
Probably not a substantial claim.
A conclusion the paper draws from its own results — it cites no other source for it, so there is none to check. The quote shows it is in the paper.
In the paper
“This leads us to believe that there may be some unknown selection bias in how the sets were chosen.”
§ Improved prediction of protein-protein interactions using AlphaFold2 > Results and discussion > Limitations
hedged- Asserted: passes — The authors put it forward as true.
- Checkable: passes — It can be checked against evidence.
- Load-bearing: fails — The paper’s conclusions may not depend on it.
- Based: passes — The paper gives a reason why it holds.
Probably not a substantial claim. The paper’s conclusions may not depend on it.
What the paper did — it cites no source for this, so there is none to check. The quote shows it is in the paper.
In the paper
“107 of the complexes in the test set lack beta carbons (Cβs), and 50 have overlapping PDB codes with the development set and were therefore excluded.”
§ Improved prediction of protein-protein interactions using AlphaFold2 > Methods > Test set
plaindirect- Asserted: passes — The authors put it forward as true.
- Checkable: passes — It can be checked against evidence.
- Load-bearing: passes — The paper’s conclusions depend on it.
- Based: passes — The paper gives a reason why it holds.
Probably not a substantial claim.
What the paper did — it cites no source for this, so there is none to check. The quote shows it is in the paper.
In the paper
“This set contains protein pairs, with each chain having at least 50 residues, sharing <30% sequence identity and no crystal packing artefacts.”
§ Improved prediction of protein-protein interactions using AlphaFold2 > Methods > Development set
plain- Asserted: passes — The authors put it forward as true.
- Checkable: passes — It can be checked against evidence.
- Load-bearing: fails — The paper’s conclusions may not depend on it.
- Based: passes — The paper gives a reason why it holds.
Probably not a substantial claim. The paper’s conclusions may not depend on it.
What the paper did — it cites no source for this, so there is none to check. The quote shows it is in the paper.
In the paper
“This set contains protein pairs, with each chain having at least 50 residues, sharing <30% sequence identity and no crystal packing artefacts.”
§ Improved prediction of protein-protein interactions using AlphaFold2 > Methods > Development set
plain- Asserted: passes — The authors put it forward as true.
- Checkable: passes — It can be checked against evidence.
- Load-bearing: fails — The paper’s conclusions may not depend on it.
- Based: passes — The paper gives a reason why it holds.
Probably not a substantial claim. The paper’s conclusions may not depend on it.
A conclusion the paper draws from its own results — it cites no other source for it, so there is none to check. The quote shows it is in the paper.
In the paper
“Interestingly, the average plDDT of the entire complex only results in an AUC of 0.66, suggesting that both single chains in a complex are often predicted very well, while their relative orientation may still be incorrect.”
§ Improved prediction of protein-protein interactions using AlphaFold2 > Results and discussion > Distinguishing acceptable from incorrect models
hedgedconditional- Asserted: passes — The authors put it forward as true.
- Checkable: passes — It can be checked against evidence.
- Load-bearing: passes — The paper’s conclusions depend on it.
- Based: passes — The paper gives a reason why it holds.
It may state two separate claims as one.
What the paper did — it cites no source for this, so there is none to check. The quote shows it is in the paper.
In the paper
“107 of the complexes in the test set lack beta carbons (Cβs), and 50 have overlapping PDB codes with the development set and were therefore excluded.”
§ Improved prediction of protein-protein interactions using AlphaFold2 > Methods > Test set
plain- Asserted: passes — The authors put it forward as true.
- Checkable: passes — It can be checked against evidence.
- Load-bearing: fails — The paper’s conclusions may not depend on it.
- Based: passes — The paper gives a reason why it holds.
Probably not a substantial claim. The paper’s conclusions may not depend on it.
A conclusion the paper draws from its own results — it cites no other source for it, so there is none to check. The quote shows it is in the paper.
In the paper
“The higher performance in S. cerevisiae compared to H. sapiens suggests a similar relationship between higher and lower order organisms within the same kingdom.”
§ Improved prediction of protein-protein interactions using AlphaFold2 > Results and discussion > Bacterial complexes are predicted more accurately
hedgedcorrelational- Asserted: passes — The authors put it forward as true.
- Checkable: passes — It can be checked against evidence.
- Load-bearing: fails — The paper’s conclusions may not depend on it.
- Based: passes — The paper gives a reason why it holds.
Probably not a substantial claim. The paper’s conclusions may not depend on it.
What the paper did — it cites no source for this, so there is none to check. The quote shows it is in the paper.
In the paper
“When folding, three of these (5AWF_D-5AWF_B, 2ZXE_B-2ZXE_A and 2ZXE_A-2ZXE_G) report “ValueError: Cannot create a tensor proto whose content is larger than 2GB”, leading to a final set of 1481 complexes.”
§ Improved prediction of protein-protein interactions using AlphaFold2 > Methods > Test set
plaindirect- Asserted: passes — The authors put it forward as true.
- Checkable: passes — It can be checked against evidence.
- Load-bearing: fails — The paper’s conclusions may not depend on it.
- Based: passes — The paper gives a reason why it holds.
Probably not a substantial claim. The paper’s conclusions may not depend on it. It may state two separate claims as one.
A conclusion the paper draws from its own results — it cites no other source for it, so there is none to check. The quote shows it is in the paper.
In the paper
“The pDockQ score discriminates between both model quality and binary interactions.”
§ Improved prediction of protein-protein interactions using AlphaFold2 > Results and discussion > Findings and future prospects
plaincorrelational- Asserted: passes — The authors put it forward as true.
- Checkable: passes — It can be checked against evidence.
- Load-bearing: passes — The paper’s conclusions depend on it.
- Based: passes — The paper gives a reason why it holds.
It may state two separate claims as one.
What the paper did — it cites no source for this, so there is none to check. The quote shows it is in the paper.
In the paper
“This set contains protein pairs, with each chain having at least 50 residues, sharing <30% sequence identity and no crystal packing artefacts.”
§ Improved prediction of protein-protein interactions using AlphaFold2 > Methods > Development set
plain- Asserted: passes — The authors put it forward as true.
- Checkable: passes — It can be checked against evidence.
- Load-bearing: fails — The paper’s conclusions may not depend on it.
- Based: passes — The paper gives a reason why it holds.
Probably not a substantial claim. The paper’s conclusions may not depend on it.
A conclusion the paper draws from its own results — it cites no other source for it, so there is none to check. The quote shows it is in the paper.
In the paper
“Here, we only consider the structures of protein complexes in their heterodimeric state, although each protein chain in these complexes may have homodimer configurations or other higher-order states.”
§ Improved prediction of protein-protein interactions using AlphaFold2 > Results and discussion > Limitations
plain- Asserted: passes — The authors put it forward as true.
- Checkable: passes — It can be checked against evidence.
- Load-bearing: fails — The paper’s conclusions may not depend on it.
- Based: passes — The paper gives a reason why it holds.
Probably not a substantial claim. The paper’s conclusions may not depend on it. It may state two separate claims as one.
What the paper did — it cites no source for this, so there is none to check. The quote shows it is in the paper.
In the paper
“In the MSA generation from AF2, 20 MSAs report MergeMasterSlave errors regarding discrepancies in the number of match states, resulting in a total of 1484 AF2 MSAs.”
§ Improved prediction of protein-protein interactions using AlphaFold2 > Methods > Test set
plain- Asserted: passes — The authors put it forward as true.
- Checkable: passes — It can be checked against evidence.
- Load-bearing: fails — The paper’s conclusions may not depend on it.
- Based: passes — The paper gives a reason why it holds.
Probably not a substantial claim. The paper’s conclusions may not depend on it. It may state two separate claims as one.
A conclusion the paper draws from its own results — it cites no other source for it, so there is none to check. The quote shows it is in the paper.
In the paper
“This suggests that MSA co-evolutionary signal and, thereby, correct identification of orthologous protein sequences, has a strong impact on the outcome.”
§ Improved prediction of protein-protein interactions using AlphaFold2 > Results and discussion > Bacterial complexes are predicted more accurately
hedgeddirect- Asserted: passes — The authors put it forward as true.
- Checkable: passes — It can be checked against evidence.
- Load-bearing: passes — The paper’s conclusions depend on it.
- Based: passes — The paper gives a reason why it holds.
It may state two separate claims as one.
What the paper did — it cites no source for this, so there is none to check. The quote shows it is in the paper.
In the paper
“These complexes share <30% sequence identity, have a resolution between 1–5 Å and constitute unique pairs of PFAM domains (no single protein pair have PFAM domains matching that of any other pair).”
§ Improved prediction of protein-protein interactions using AlphaFold2 > Methods > Test set
plain- Asserted: passes — The authors put it forward as true.
- Checkable: passes — It can be checked against evidence.
- Load-bearing: fails — The paper’s conclusions may not depend on it.
- Based: passes — The paper gives a reason why it holds.
Probably not a substantial claim. The paper’s conclusions may not depend on it.
A conclusion the paper draws from its own results — it cites no other source for it, so there is none to check. The quote shows it is in the paper.
In the paper
“Therefore, the same pipeline can identify if two proteins interact and the accuracy of their structure.”
§ Improved prediction of protein-protein interactions using AlphaFold2 > Results and discussion > Findings and future prospects
plaindirect- Asserted: passes — The authors put it forward as true.
- Checkable: passes — It can be checked against evidence.
- Load-bearing: passes — The paper’s conclusions depend on it.
- Based: passes — The paper gives a reason why it holds.
It may state two separate claims as one.
What the paper did — it cites no source for this, so there is none to check. The quote shows it is in the paper.
In the paper
“For RF, 26 complexes produced out of memory exceptions during prediction using a GPU with 40 Gb RAM and were excluded from the RF analyses, leaving 1455 complexes.”
§ Improved prediction of protein-protein interactions using AlphaFold2 > Methods > Test set
plaindirect- Asserted: passes — The authors put it forward as true.
- Checkable: passes — It can be checked against evidence.
- Load-bearing: fails — The paper’s conclusions may not depend on it.
- Based: passes — The paper gives a reason why it holds.
Probably not a substantial claim. The paper’s conclusions may not depend on it. It may state two separate claims as one.
What the paper did — it cites no source for this, so there is none to check. The quote shows it is in the paper.
In the paper
“DSSP could only be run successfully for 1391 out of the 1481 protein complexes, and we ignored the rest in the analysis.”
§ Improved prediction of protein-protein interactions using AlphaFold2 > Methods > Test set
plain- Asserted: passes — The authors put it forward as true.
- Checkable: passes — It can be checked against evidence.
- Load-bearing: fails — The paper’s conclusions may not depend on it.
- Based: passes — The paper gives a reason why it holds.
Probably not a substantial claim. The paper’s conclusions may not depend on it. It may state two separate claims as one.
What the paper did — it cites no source for this, so there is none to check. The quote shows it is in the paper.
In the paper
“For the mammalian proteins from Negatome, seven out of 1733 single chains were redundant according to Uniprot (C4ZQ83, I0LJR4, I0LL25, K4CRX6, P62988, Q8NI70, Q8T3B2), 34 had no matching species in the MSA pairing, 106 produced out of memory exceptions during prediction using a GPU with 40 Gb RAM, 35 gave a tensor reshape error, and 65 complexes were homodimers, leaving 1715 complexes for this set”
§ Improved prediction of protein-protein interactions using AlphaFold2 > Methods > Test set
plain- Asserted: passes — The authors put it forward as true.
- Checkable: passes — It can be checked against evidence.
- Load-bearing: fails — The paper’s conclusions may not depend on it.
- Based: passes — The paper gives a reason why it holds.
Probably not a substantial claim. The paper’s conclusions may not depend on it.
What the paper did — it cites no source for this, so there is none to check. The quote shows it is in the paper.
In the paper
“No templates were used to build structures, as this would not assess the prediction accuracy of unknown structures or structures without sufficient matching templates.”
§ Improved prediction of protein-protein interactions using AlphaFold2 > Methods > AlphaFold2
plaindirect- Asserted: passes — The authors put it forward as true.
- Checkable: passes — It can be checked against evidence.
- Load-bearing: passes — The paper’s conclusions depend on it.
- Based: passes — The paper gives a reason why it holds.
It may state two separate claims as one.
What the paper did — it cites no source for this, so there is none to check. The quote shows it is in the paper.
In the paper
“Some complexes failed due to computational limitations, resulting in 1458 out of 1481 complexes successfully folded.”
§ Improved prediction of protein-protein interactions using AlphaFold2 > Methods > AlphaFold-multimer
plaindirect- Asserted: passes — The authors put it forward as true.
- Checkable: passes — It can be checked against evidence.
- Load-bearing: fails — The paper’s conclusions may not depend on it.
- Based: passes — The paper gives a reason why it holds.
Probably not a substantial claim. The paper’s conclusions may not depend on it. It may state two separate claims as one.
What the paper did — it cites no source for this, so there is none to check. The quote shows it is in the paper.
In the paper
“Some structures in this dataset are homodimers (65) and are therefore excluded, resulting in 1705 structures.”
§ Improved prediction of protein-protein interactions using AlphaFold2 > Methods > Non-interacting proteins
plaindirect- Asserted: passes — The authors put it forward as true.
- Checkable: passes — It can be checked against evidence.
- Load-bearing: fails — The paper’s conclusions may not depend on it.
- Based: passes — The paper gives a reason why it holds.
Probably not a substantial claim. The paper’s conclusions may not depend on it. It may state two separate claims as one.
What the paper did — it cites no source for this, so there is none to check. The quote shows it is in the paper.
In the paper
“We compare RF with AF2 using the same inputs (the paired MSAs) for both the development and test datasets to provide a more fair comparison, as AF2 searches many different databases to obtain as much evolutionary information as possible when generating its MSAs.”
§ Improved prediction of protein-protein interactions using AlphaFold2 > Methods > RoseTTAFold
plain- Asserted: passes — The authors put it forward as true.
- Checkable: passes — It can be checked against evidence.
- Load-bearing: passes — The paper’s conclusions depend on it.
- Based: passes — The paper gives a reason why it holds.
Probably not a substantial claim.
What the paper did — it cites no source for this, so there is none to check. The quote shows it is in the paper.
In the paper
“Since structure prediction with AF2 is a non-deterministic process, we generate five models initiated with different seeds.”
§ Improved prediction of protein-protein interactions using AlphaFold2 > Methods > AlphaFold2
plain- Asserted: passes — The authors put it forward as true.
- Checkable: passes — It can be checked against evidence.
- Load-bearing: passes — The paper’s conclusions depend on it.
- Based: passes — The paper gives a reason why it holds.
Probably not a substantial claim.
- Rests on an assumption: AF2 structure prediction is a non-deterministic process.
In the paper
“To estimate the information in each MSA, we clustered sequences at 62% identity, as described in a previous study50. The number of clusters obtained in this way has been used to indicate a Neff value for each MSA.”
§ Improved prediction of protein-protein interactions using AlphaFold2 > Methods > Number of effective sequences (Neff)
What the sources say
- Not checked — no full text of the sourcecites [50] Zhang, Y. & Skolnick, J. Scoring function for automated assessment of protein structure template quality. Proteins 57, (2004). source
plaincorrelational- Asserted: passes — The authors put it forward as true.
- Checkable: passes — It can be checked against evidence.
- Load-bearing: fails — The paper’s conclusions may not depend on it.
- Based: passes — The paper gives a reason why it holds.
Probably not a substantial claim. The paper’s conclusions may not depend on it.
The authors state this as an assumption.
All residues in an interface contribute to the interaction energy.
“Assuming that all residues in an interface contribute to the interaction energy could explain why larger interfaces are more likely to be correctly predicted.”
The paper relies on this without support.
The 31% success rate at 1% FPR observed on the test set applies to the human reference interactome.
“If 31% of these can be predicted at an error rate of 1%, this results in the structure of 19,842 human heterodimeric protein structures.”
The paper relies on this without support.
The 3989 E. coli proteins used as negatives are truly non-interacting.
“Using the best separator from the model ranking, the pDockQ, it is possible to distinguish the 3989 non-interacting proteins from Escherichia coli and the 1481 truly interacting proteins from the test set with an AUC of 0.87.”
The paper relies on this without support.
The 1481 test set proteins used as positives are truly interacting.
“Using the best separator from the model ranking, the pDockQ, it is possible to distinguish the 3989 non-interacting proteins from Escherichia coli and the 1481 truly interacting proteins from the test set with an AUC of 0.87.”
The paper relies on this without support.
AF2 structure prediction is a non-deterministic process.
“Since structure prediction with AF2 is a non-deterministic process, we generate five models initiated with different seeds.”
The paper relies on this without support.
Ranking the five AF2 models for each complex by the number of residues in the interface gives the best result.
“We rank the five models for each complex by the number of residues in the interface, giving the best result.”
Claims other papers make about this one
Each is checked against this paper’s own text: does it say what the citing paper says it does?
The source backs part of the claim, not all of it — or backs it for a different population, condition or comparison.
In the citing paper
“A large fraction of all interacting pairs have high ipTM/ranking confidence scores, whereas this is extremely rare for two randomly chosen proteins (3).”
From Reliable Identification of Homodimers Using AlphaFold (2025) · cites this paper as [3]
Experimental — accuracy not yet measuredThe source backs part of the claim, not all of it — or backs it for a different population, condition or comparison.
In the citing paper
“Model quality and interface confidence were assessed using the interfacial iPTM scores, pDockQ2 score calculated based on ipSAE [160-162].”
From Global identification of neuronal and astrocytic integral membrane proteins that require Retromer for their endosomal recycling (2026) · cites this paper as [161]
Experimental — accuracy not yet measuredThe cited source says what the claim attributes to it.
In the citing paper
“Bryant et al showed that AlphaFold2.0 could be used to successfully separate interacting and non-interacting heterodimers (3).”
From Reliable Identification of Homodimers Using AlphaFold (2025) · cites this paper as [3]
In the citing paper
“A much better solution is to modify the “residue_index” feature used by AF2, which eliminates the need for a covalent linker that likely creates artifacts20,21.”
From AF2Complex predicts direct physical interactions in multimeric proteins with deep learning (2022) · cites this paper as [21]
Self-check
Percentages, sums and reported differences re-computed from the paper’s own numbers.
Each contradiction between two passages listed here was confirmed by an independent check.
Rated major: it would touch a result — a value a result rests on, reported and recomputed p-values on opposite sides of the significance level, two passages that conflict with no sign which is right, or a cited work retracted before this paper was published.
In the paper
§ Improved prediction of protein-protein interactions using AlphaFold2 > Results and discussion > Test set performance
“The average error overall is 0.14 DockQ score.”
§ Improved prediction of protein-protein interactions using AlphaFold2 > Results and discussion > Distinguishing acceptable from incorrect models
“This enables the prediction of the DockQ scores (pDockQ) in a continuous manner with an overall average error of 0.11 on the test set.”
Rated minor: it would not touch a result — a value no result rests on, a p-value that stays on the same side of the significance level, or a conflict that is clerical, resolved elsewhere in the paper, or outside its own findings.
In the paper
§ Improved prediction of protein-protein interactions using AlphaFold2 > Methods > AlphaFold2
“We rank the five models for each complex by the number of residues in the interface, giving the best result.”
§ Improved prediction of protein-protein interactions using AlphaFold2 > Results and discussion > Model variation and ranking for the test set
“Although this is unachievable, ranking the models using the pDockQ score results in an SR of 61.7%.”
Rated minor: it would not touch a result — a value no result rests on, a p-value that stays on the same side of the significance level, or a conflict that is clerical, resolved elsewhere in the paper, or outside its own findings.
In the paper
“Some structures in this dataset are homodimers (65) and are therefore excluded, resulting in 1705 structures.”
§ Improved prediction of protein-protein interactions using AlphaFold2 > Methods > Non-interacting proteins
Reported 1705 · recomputed 1899
Citations
Cites
Highly accurate protein structure prediction with AlphaFold
Jumper, J., Evans, R., Pritzel, A., Green, T., Figurnov, M., Ronneberger, O., Tunyasuvunakool, K., Bates, R., Žídek, A., Potapenko, A., et al. (2021) · Nature · doi:10.1038/s41586-021-03819-2 · Cited by 43,764
SciPy 1.0: fundamental algorithms for scientific computing in Python
Virtanen, P., Gommers, R., Oliphant, T. E., Haberland, M., Reddy, T., Cournapeau, D., Burovski, E., Peterson, P., Weckesser, W., Bright, J., et al. (2020) · Nature Methods · doi:10.1038/s41592-019-0686-2 · Cited by 38,430
Kabsch, W., & Sander, C. (1983) · Biopolymers · doi:10.1002/bip.360221211 · Cited by 15,320
SciPy 1.0: fundamental algorithms for scientific computing in Python
Virtanen, P., Gommers, R., Oliphant, T. E., Haberland, M., Reddy, T., Cournapeau, D., Burovski, E., Peterson, P., Weckesser, W., Bright, J., et al. (2019) · Apollo - University of Cambridge Repository · doi:10.17863/cam.64134 · Cited by 10,460
Jalview Version 2—a multiple sequence alignment editor and analysis workbench
Waterhouse, A. M., Procter, J. B., Martin, D. M. A., Clamp, M. E., & Barton, G. J. (2009) · Bioinformatics · doi:10.1093/bioinformatics/btp033 · Cited by 10,349
Szklarczyk, D., Gable, A. L., Nastou, K. C., Lyon, D., Kirsch, R., Pyysalo, S., Doncheva, N. T., Legeay, M., Fang, T., Bork, P., et al. (2021) · Nucleic Acids Research · doi:10.1093/nar/gkaa1074 · Cited by 8,056
Accelerated Profile HMM Searches
Eddy, S. R. (2011) · PLoS Computational Biology · doi:10.1371/journal.pcbi.1002195 · Cited by 6,975
UniProt: the universal protein knowledgebase in 2021
The UniProt Consortium, Bateman, A., Martin, M.-J., Orchard, S., Magrane, M., Agivetova, R., Ahmad, S., Alpi, E., Bowler-Barnett, E. H., Britto, R., et al. (2021) · Nucleic Acids Research · doi:10.1093/nar/gkaa1100 · Cited by 6,372
Accurate prediction of protein structures and interactions using a 3-track network
Baek, M., DiMaio, F., Anishchenko, I., Dauparas, J., Ovchinnikov, S., Lee, G. R., Wang, J., Cong, Q., Kinch, L. N., Schaeffer, R. D., et al. (2021) · doi:10.1101/2021.06.14.448402 · Cited by 5,549
MMseqs2 enables sensitive protein sequence searching for the analysis of massive data sets
Steinegger, M., & Söding, J. (2017) · Nature Biotechnology · doi:10.1038/nbt.3988 · Cited by 4,840
Research works printed but not linked: 1
- 1997, Evaluation of GRAMM low-resolution docking methodology on the hemagglutinin-antibody complex, Proteins, Suppl 1, 226
Cited by
Sorted by citations
Items 1,001–1,076 of 1,076
Laksmi, F. A., Nugraha, Y., Lischer, K., Khaerunnisa, Herawan, D., Juanssilfero, A. B., Wibowo, D. S., Nuryana, I., Wibowo, S., Vidilaseris, K., et al. (2026) · Scientific Reports · doi:10.1038/s41598-026-54479-z
Sadykov, Z., Khamidullina, A., Sultankulov, B., & Seitkali, D. (2026) · bioRxiv (Cold Spring Harbor Laboratory) · doi:10.64898/2026.06.08.730711
Tomes, A., Johnson, E., Staton, G. J., Njume, F. N., Crosby-Durrani, H. E., Nally, J. E., Carter, S. D., Rigden, D. J., & Evans, N. J. (2026) · mBio · doi:10.1128/mbio.00878-26
Gao, S., Li, Z., Zhang, R., Zhu, X., Cheng, Y., Zhao, M., & Xu, Y. (2026) · Critical Reviews in Oncology/Hematology · doi:10.1016/j.critrevonc.2026.105440
Zhu, C., Hu, C., Dai, X., & Xu, M. (2026) · International Journal of Intelligent Systems · doi:10.1155/int/1355567
DeepSSInter : Protein–protein contact prediction with a structure‐aware protein language model
Huang, D., Lv, J., Yao, X., Lin, P., & Huang, S. (2026) · Protein Science · doi:10.1002/pro.70667
Ni, Y.-C., Chen, Y., Hsiao, W.-P., Huang, T., Cheng, C.-H., Wang, W., & Lee, K. (2026) · Research Square · doi:10.21203/rs.3.rs-8957808/v1
AlphaFold-Multimer reveals diverse cyclin-CDK substrate docking interactionsPreprint
Willich, S., Kapadia, N., & Nurse, P. (2026) · bioRxiv (Cold Spring Harbor Laboratory) · doi:10.64898/2026.06.29.735189
Coenzyme Acceptance in Ene‐Reductases From Herbaspirillum seropedicae
Shah, K., Wallner, S., Bijelic, A., Pick, A., Macheroux, P., Kourist, R., & Kracher, D. (2026) · ChemistryEurope · doi:10.1002/ceur.70331
Folding scFv–Antigen Complexes at ScalePreprint
Shah, R., Ouyang-Zhang, J., Cohen, Z., Briglia, M. R., Zhang, C. H. I., Klivans, A. R., & Diaz, D. J. (2026) · bioRxiv (Cold Spring Harbor Laboratory) · doi:10.64898/2026.07.01.730981
Network-based machine learning to identify biomarkers for systemic lupus erythematosus
Park, M., Kim, D., Lee, J., Noh, J., Kim, C. J., Oh, Y., Suh, C. S., Kim, J.-W., Im, S., Kim, S., et al. (2026) · BMC Biology · doi:10.1186/s12915-026-02681-w
Ma, R., Xv, L., Meng, X., Zhang, Z., Chen, Y., Zhang, C., Wang, L., Lu, K., Xv, L., Song, K., et al. (2026) · Bioresource Technology · doi:10.1016/j.biortech.2026.135475
Structural quality-tier assessment for TCR-pMHC functional enrichment
Ascunce-París, A., Romero‐Durana, M., Valencia, A., Farriol-Duran, R., & Guallar, V. (2026) · Frontiers in Immunology · doi:10.3389/fimmu.2026.1869810
Rescalli, S., & Carbone, A. (2026) · bioRxiv (Cold Spring Harbor Laboratory) · doi:10.64898/2026.07.20.739596 · Cited by 1
Qian, J., Liao, X., Shi, Y., & Chen, X. (2026) · Environmental Research · doi:10.1016/j.envres.2026.125348
Fagbohun, O. F., Olawoye, B. T., Oriyomi, O. V., McDougle, X., Iragena, O., Kellenbarger, R., Joseph, J. S., Fadare, O., & Kincaid, R. (2026) · International Journal of Biological Macromolecules · doi:10.1016/j.ijbiomac.2026.153947
Scalable Extraction of Information on Protein-Protein Interactions using Topological Data AnalysisPreprint
Mukherjee, A., Park, B., Malmstrom, A., Cisewski-Kehe, J., Lehn, R. C. V., & Zavala, V. M. (2026) · bioRxiv (Cold Spring Harbor Laboratory) · doi:10.64898/2026.08.06.743405
Wilson, G., Bennett, C., Wright, E., & Turner, J. (2025) · Pharmacophore · doi:10.51847/yya2shcyj9
Interpretable prediction of nucleic acid-binding proteins using a protein language model
Kim, H., Lee, S., Oh, J., Kim, K. K., Kim, E., & Park, C. (2026) · Bioinformatics Advances · doi:10.1093/bioadv/vbag235
Plasmodium Actin‐Like Proteins 3 and 5a Are Required for Subsequent Steps of Mosquito Infection
Busse, C., Kobayashi, Y., Diers, A., Binder, A. M., Frischknecht, F., & Douglas, R. G. (2026) · Molecular Microbiology · doi:10.1111/mmi.70108 · Cited by 1
DHST: A Deep Hybrid Structure–Topology Framework for Accurate Protein Function Prediction
Lu, B., Xiang, F., Wang, H., Wang, D., & Wang, Q. (2026) · Applied Sciences · doi:10.3390/app16178437
Wu, H., Deng, Y., Li, Z., Qi, M., Wei, Y., Zhuo, L., Zou, Q., & Zhang, W. (2026) · Interdisciplinary Sciences Computational Life Sciences · doi:10.1007/s12539-026-00863-2
How phosphorylation of α/β-tubulin perturbs microtubule structure: A computational study
Ianos, A., Osman, A., Qiao, B., & Rotenberg, S. A. (2026) · Journal of Biological Chemistry · doi:10.1016/j.jbc.2026.113493
Harnessing epistatic architecture to improve genomic selection accuracy for soybean pod number
Dong, L., Zhang, R., Jiang, H., Zhu, X., Wang, M., Guo, C., & Shu, Y. (2026) · Molecular Breeding · doi:10.1007/s11032-026-01711-3
Gene editing beyond food crops
Jash, S., Upadhyay, D. K., Chetri, A., Syed, R., & Mandal, S. (2026) · Elsevier eBooks · doi:10.1016/b978-0-443-44079-3.00012-7
Saini, T. J., & Killiny, N. (2026) · Pest Management Science · doi:10.1002/ps.71248
Wang, M., Shao, H., Wei, J., Wu, Y., Niu, M., Tan, P., Liu, H., Wu, J., Zhang, R., Hu, X., et al. (2026) · Plant Physiology and Biochemistry · doi:10.1016/j.plaphy.2026.111704
Flagellar pocket receptors as entry point for protein-based drugs against kinetoplastid parasites
Attala, L., Vernetti, C., & Araya, E. R. (2026) · Exploration of Drug Science · doi:10.37349/eds.2026.1008179
Structural basis of active state coupling of metabotropic glutamate receptor 8 to beta-arrestins
Marx, D. C., Huynh, K., Gonzalez-Hernandez, A. J., Strauss, A., Rico, C. A., Gallo, P. N., Moshtaghin, S. S., Arefin, A., Broichhagen, J., Eliezer, D., et al. (2026) · Nature Communications · doi:10.1038/s41467-026-77556-3
Learning to Explain Nature: Synergizing Explainable Artificial Intelligence and Earth System Science
Kumar, S., Singh, T. N., Verma, A. K., & Misra, R. (2026) · Lecture notes in networks and systems · doi:10.1007/978-3-032-31998-2_8
Investigating DIX-mediated interactions in Wnt signaling with AlphaFold2 and AlphaFold3
Lee, H. (2026) · Cell Signaling · doi:10.46439/signaling.4.107
He, Y., Dong, X., Lu, X., Zhu, Q., Miao, Q., Yan, Z., Zhao, Q., Chen, H., Qin, M., Yi, Y., et al. (2026) · Molecular Biomedicine · doi:10.1186/s43556-026-00572-8
Amodeo, V., Weekes, D. B., Balan, N., Uceda-Castro, R., D’Uonno, N., Konde, A., Noel, E. E., Robbez‐Masson, L., Trendell, J., Shlomi, M., et al. (2026) · Nature Communications · doi:10.1038/s41467-026-77417-z
Lee, H. R., 한상하, Jung, S.-J., Oh, C., Lee, D., & Ha, S.-D. (2026) · Food Research International · doi:10.1016/j.foodres.2026.120780
McPherson, J. K., Sharma, S., Mishra, B., Shehadeh, F., & Mylonakis, E. E. (2026) · Frontiers in Bacteriology · doi:10.3389/fbrio.2026.1926678
Predicting Enzyme Turnover Numbers and Enabling Rational Enzyme Evolution
Ge, F., Ma, X., Li, J., Wang, M., 路福平, Liu, Y., & Wang, L. (2026) · Advanced Science · doi:10.1002/advs.77789
Perthold, J. W., Petrov, D., & Oostenbrink, C. (2026) · Journal of Chemical Information and Modeling · doi:10.1021/acs.jcim.6c01771
ZmNAC20 positively regulates drought tolerance in maize seedlings via a chromatin-associated network
Wang, Z., He, Y., Yang, Y., Li, N., & Li, C. (2026) · Plant Physiology and Biochemistry · doi:10.1016/j.plaphy.2026.111800
AI-based prediction and engineering of protein complexes
Xiong, L., Deng, R., & Zhang, Y. (2026) · Methods in enzymology on CD-ROM/Methods in enzymology · doi:10.1016/bs.mie.2026.09.056
Author Response: Mobile barrier mechanisms for Na+-coupled symport in an MFS sugar transporter
Hariharan, P., Shi, Y., Katsube, S., Willibal, K., Burrows, N. D., Mitchell, P., Bakhtiiari, A., Stanfield, S., Pardon, E., Kaback, R. H., et al. (2024) · eLife · doi:10.7554/elife.92462.3.sa3
Author response: AIVE: accurate predictions of SARS-CoV-2 infectivity from comprehensive analysis
Park, J., Choi, W. J., Seong, D. Y., Jeong, S. P., Lee, J. Y., Park, H. J., Chung, D. S., Yi, K. J., Kim, U., Yoon, G., et al. (2024) · eLife · doi:10.7554/elife.99833.2.sa0
Author response: Accurate predictions of SARS-CoV-2 infectivity from comprehensive analysis
Park, J., Choi, W., Seong, D. Y., Jeong, S., Lee, J. Y., Park, H. J., Chung, D. S., Yi, K., Kim, U., Yoon, G., et al. (2024) · eLife · doi:10.7554/elife.99833.3.sa3
AlphaFold: A Comprehensive Guide to the Revolutionary AI Tool and Its Methodology
Saranyan, S. (2025) · American journal of student research. · doi:10.70251/hyjr2348.316273
(2024) · Kharkov University Bulletin Chemical Series · doi:10.26565/2220-637x-2024-43
CAPRINI-M: An AI-curated Cardiac-Specific Atlas of Protein Interactions in MicePreprint
Gjerga, E., Wiesenbach, P., Görner, C.-A., Zhang, Y., Pelz, K., List, M., & Dieterich, C. (2026) · bioRxiv (Cold Spring Harbor Laboratory) · doi:10.64898/2026.03.06.710104
Role of Deep Learning in Protein Structure Prediction: Current Progress and Open Challenges
Wakode, S. P. D. B. (2025) · Communications on Applied Nonlinear Analysis · doi:10.52783/cana.v32.4850
Azadeh, F. (n.d.) · Institutional Repositories DataBase (IRDB) · doi:10.15083/0002011564
Interactomics: Dissecting Protein Networks in Living Systems
Farinha, C. M., Pinto, F. R., & Miranda, J. A. I. (2026) · Advances in experimental medicine and biology · doi:10.1007/978-3-032-18966-0_7
Structural Syntax of the Vaccinia Virus Entry‐Fusion Complex
Sargeant, J. N., & Gershon, P. D. (2026) · PROTEOMICS · doi:10.1002/pmic.70150
Gonzalez, M. V., Mousel, M. R., Herndon, D. R., Massa, A. T., Durfee, C. J., Knowles, D. P., Taylor, B. J., Neibergs, H. L., Seabury, C. M., & White, S. N. (2026) · BMC Genomics · doi:10.1186/s12864-026-13029-7
DirectContacts2: a wiring diagram of human physical protein interactions
Claussen, E. R., Woodcock-Girard, M. D., Fischer, S. M., & Drew, K. (2026) · Nature Communications · doi:10.1038/s41467-026-75863-3
Structural basis of lipid-mediated self-regulation of Tissue FactorPreprint
Iakhiaev, A. V. (2026) · bioRxiv (Cold Spring Harbor Laboratory) · doi:10.64898/2026.09.07.749947
Computational Peptide Design Methods for Drug Discovery Targeting Protein-Protein Interactions
Kosugi, T. (2024) · Institutional Repositories DataBase (IRDB)
Integrating structural and biological evidence to rerank ESMFold2 protein-protein interactionsPreprint
Xie, J., Li, M., Chai, Y., Ou, G., Li, W., & Guo, Z. (2026) · bioRxiv (Cold Spring Harbor Laboratory) · doi:10.64898/2026.09.16.751194
DESCIFRANDO LA FORMA DE LA VIDA: DEL MODELADO POR HOMOLOGÍA A LA REVOLUCIÓN DE ALPHAFOLD
Hernández, M. A. S., Abrech, N. N., & Lozano-Aponte, J. (2026) · RD-ICUAP · doi:10.32399/icuap.rdic.2448-5829.2026.35.1729
AutoHMD: scalable and accurate validation of antibody–antigen complexes by heated molecular dynamics
Souza, J. S., Albuquerque, A. O., Almeida, D. S., Costa, A. H. S., Sampaio, J. V., & Silva, J. H. M. (2026) · Bioinformatics · doi:10.1093/bioinformatics/btag757
CLN6 is a glycerophosphoglycerol epimerase in bis(monoacylglycero)phosphate biosynthesisPreprint
Sheokand, P. K., James, A. M., Posern, C., Singh, A., Breithofer, J., Ganellin, J., Proulx, M. K., Leese, S. K., Turner, K., Lacabanne, D., et al. (2026) · bioRxiv (Cold Spring Harbor Laboratory) · doi:10.64898/2026.10.07.757350
Protein interactions with small molecules, peptides and proteins share residue cluster classes
Castillo, J. M. H., Macias, E. H. V., & del Rio, G. (2026) · Journal of Molecular Graphics and Modelling · doi:10.1016/j.jmgm.2026.109614
Pathway-scale variant effect mapping reveals the importance of cell contextPreprint
Simon, J. J., Pendyala, S., Adebanjo, A. F., Holmes, D. L., Walsh, M., Vandi, A. J., Wang, Z. R., Wheelock, M. K., Opsahl, J. L., Shihora, A., et al. (2026) · bioRxiv (Cold Spring Harbor Laboratory) · doi:10.64898/2026.10.04.756099
Üstüner, E., & Öz, M. (2026) · Biotechnology and Bioengineering · doi:10.1002/bit.70398
Yao, X., Ya, Y., Li, H., & Huang, S. (2026) · Nature Computational Science · doi:10.1038/s43588-026-01062-1
Cheng, H., Sun, C., Ye, C., Wu, C., & Zhao, D. (2026) · bioRxiv (Cold Spring Harbor Laboratory) · doi:10.64898/2026.10.07.757219
Bhandare, V. V., Khatal, S., Scheele, J., Agarwal, A., Sarode, K., Chatterjee, S., Kondhalkar, U., Joshi, P., Ahluwalia, A., & Yadav, R. (2026) · Research Square · doi:10.21203/rs.3.rs-11295356/v1
Thioredoxin‐2 Alleviates Osteoporosis by Restraining FOXO3a Nuclear Translocation
Zhan, C., Zhou, Z., Ding, Y., Lian, R., Li, X., Zhang, X., Cao, J., Tang, Z., Lin, Z., Song, Z., et al. (2026) · Advanced Science · doi:10.1002/advs.78304
Profiling Model Predictability of AlphaFold2: A Comparative Study on Diverse Protein Sequences
Nijhum, G. M. A., Brishty, F. R., & Zhong, J. (2026) · International Conference on Advanced Machine Learning and Data Science (AMLDS) · doi:10.1109/amlds69611.2026.11724024
From Prediction to Design: A Paradigm Shift in AI-Driven Protein–Protein Interaction Research
Wu, Y., Hu, W., & Zhao, L. (2026) · Health and Metabolism · doi:10.53941/hm.2026.100025
Ho, N. H. E., Yang, C., Ng, I., & Chang, J. (2026) · Journal of Chemical Information and Modeling · doi:10.1021/acs.jcim.6c01844
Hanmei, J. I. N., & Jianhui, L. I. (2026) · Open Journal of Social Sciences · doi:10.4236/jss.2026.1410025
Benchmarking Machine Learning Models for Viral Nanobody Epitope Prediction
Penhallurick, R. W., & Dean, S. (2026) · Journal of Chemical Information and Modeling · doi:10.1021/acs.jcim.6c02430
Jones, E., Adams, H., Chen, K.-E., Maroof, F., Ibbotson, T. M., Nakamura, Y., Banks, P. J., Healy, M. D., Lewis, P. A., Heesom, K. J., et al. (2026) · doi:10.64898/2026.05.14.724903
Metadata
- Authors
- Bryant, P., Pozzati, G., & Elofsson, A.
- Affiliations
- Stockholm University (SE)
- Corresponding author
- Bryant, P.
- Elofsson, A.
- Venue
- Nature Communications
- Publisher
- openRxiv
- Published
- 2021-09-15
- Volume
- 13
- Issue
- 1
- Pages
- 1265-1265
- ISSN
- 2041-1723 (ISSN-L)
- PMC
- PMC8913741
- OpenAlex
- W4220824576
- Cited by
- 1,022
- References
- 66
- Citations by year
- 2026: 170 · 2025: 269 · 2024: 292 · 2023: 203 · 2022: 83 · 2021: 5
- FWCI
- 62.72
- Type
- journal article
- Language
- en
- Open access
- gold
- doi.org
- Licence
- cc-by
- Locations
- Nature Communications (publishedVersion, cc-by)
- Research Square (submittedVersion, cc-by)
- bioRxiv (Cold Spring Harbor Laboratory) (submittedVersion, cc-by)
- PubMed Central (publishedVersion, cc-by)
- PubMed (publishedVersion)
- RePEc: Research Papers in Economics (submittedVersion)
- DOAJ (DOAJ: Directory of Open Access Journals) (submittedVersion, cc-by-sa)
- Funders
- Swedish e-Science Research Centre
- Knut och Alice Wallenbergs Stiftelse (COVID 19)
- Vetenskapsrådet (2016-06301, Berzelius-2021-29)
- Stockholms Universitet
- Topics
- Life Sciences › Biochemistry, Genetics and Molecular Biology › Molecular Biology › Protein Structure and Dynamics
- Life Sciences › Biochemistry, Genetics and Molecular Biology › Molecular Biology › Machine Learning in Bioinformatics
- Life Sciences › Biochemistry, Genetics and Molecular Biology › Structural Biology › Enzyme Structure and Function
- Keywords
- protein-protein interaction, protein complex structure prediction, AlphaFold2, multiple sequence alignment, protein interface prediction
- MeSH terms
- Protein Conformation, Proteins, Computational Biology
About these checks
Registry, retraction, Cites and statistics results are computed, not judged, with one exception: a printed reference that no index lists is read once by a model before it counts as a citation error. Claims are extracted by a model and kept only when their quote appears verbatim in the text; each cited source is then checked, with a model’s help, for whether it says what the claim relies on. Those verdicts can be wrong — read the claim’s quote and the cited source before relying on one.
A language model drew the claims from the paper on 2026-10-10, under version 3 of the claim definition (model deepseek-v4.1-flash, prompt extract-v3).
A second model labelled each claim on 2026-10-10 (model jev-1.13-20260917, definition revision gold-guideline-v0.2).
Cited sources are checked with a language model’s help (gpt-6-sol).
Statistics and arithmetic are recomputed, not judged.
Confidence bands are shown only for fields calibrated on our annotated test set. None is calibrated yet, so no band is shown.
What counts as a claim ›How we measure confidence ›How we check this ›
Are you an author, or do you see a problem with this page? Request a review
