PreprintCited by 26Microtubule and mitosis dynamicsNuclear Structure and FunctionGenomics and Chromatin Dynamics

The DOI matches its Crossref record; 1 of the 1 references it cites were found in a registry or an index.

CDK1 and PLK1 cooperate to regulate BICD2, dynein activation and recruitment to the nucleus as well as centrosome separation in G2/M

Open access
Gallisà-Suñé, Núria, Sànchez-Fernàndez-de-Landa, Paula, Zimmermann, Fabian, Serna, Marina, Paz, Joel, Regué, Laura, Llorca, Oscar, Lüders, Jens, Roig, Joan·2021·Nature Communications

Preprint — published as 10.1038/s41467-023-38116-1 · Paper page

Abstract

Summary: The activity of dynein is regulated by a number of adaptors that mediate its interaction with dynactin, effectively activating the motor complex while also connecting it to different cargos. The regulation of adaptors is consequently central to dynein physiology, but remains largely unexplored. We now describe that one of the best-known dynein adaptors, BICD2, is effectively activated through phosphorylation. In G2 phosphorylation of BICD2 by CDK1 promotes its interaction with PLK1. In turn, PLK1 phosphorylation of a single residue in the N-terminus of BICD2 results in a conformational change that facilitates interaction with dynein and dynactin, allowing the formation of active motor complexes. BICD2 phosphorylation is central for dynein recruitment to the nuclear envelope, centrosome tethering to the nucleus and centrosome separation in G2/M. This work reveals adaptor activation through phosphorylation as crucial for the spatiotemporal regulation of dynein activity.

Overview

The claims and statistics of this paper haven’t been checked yet.

Run the check — free, no account needed. It reads the open-access text and checks the sources it cites.

A few free checks a day · papers already verified open instantly · results are public

Integrity signals

Registry

Crossref · 10.1101/2021.11.04.467245

Cites

1 of 1 references verified0 citation errors · 0 not checkable

Statistics

Figures

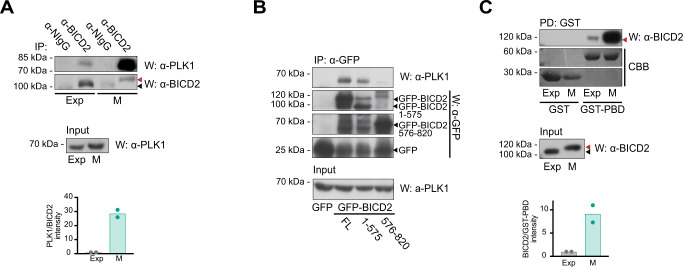
Fig. 1 BICD2 interacts with PLK1 through its Polo-Box Domain. A Coimmunoprecipitation of endogenous PLK1 and BICD2 in exponentially growing (Exp) and mitotic (M) HeLa cell extracts. anti-BICD2 or normal IgG (NIgG) immunoprecipitates (IP) were analyzed by western blot (W) using either anti-PLK1 or anti-BICD2 antibodies. Note BICD2 high apparent molecular weight in mitotic cells, red arrowheads. PLK1 in the corresponding extracts is shown in the lower panel. The mean of quantifications corresponding to two independent experiments is shown (PLK1 intensity/BICD2 intensity in the immunoprecipitates; this and subsequent experiments source data are provided in the Source Data file). B PLK1 interacts with the N-terminal region of BICD2. Immunoprecipitates of the indicated recombinant GFP-fusion proteins were analyzed by western blot using either anti-PLK1, to detect the endogenous kinase, or anti-GFP. PLK1 in the corresponding extracts is shown in the lower panel. Note that different fragments of GFP-BICD2 are produced when recombinant proteins are expressed in cells. Arrowheads indicating the expected MW of relevant proteins have been added for clarity (GFP-BICD2, ~120 kDa; GFP-BICD2 1-575, ~90 kDa; GFP-BICD2 576-820, ~55 kDa; GFP, ~25 kDa). One of two independent experiments with similar results is shown. C PLK1 interacts with BICD2 through its Polo-Box Domain (PBD). Extracts of exponentially growing (Exp) or mitotic (M) HeLa cells were incubated with either bacterial expressed GST or GST-PBD (GST-PLK1 [354–603]) bound to GSH agarose beads. Endogenous BICD2 was detected by western blot (W) and GST-fusion proteins by Coomassie Brilliant Blue staining (CBB). BICD2 in the corresponding extracts is shown in the lower panel. Note that in both pulldowns from exponential and mitotic extracts the apparent molecular weight of BICD2 interacting with PLK1-PBD corresponds to the fastest migrating form (red arrowhead, high MW; black arrowhead, low MW). The mean of quantifications corresponding to two independent experiments is shown (BICD2 intensity/GST-PBD intensity in the pulldowns).
Fig. 1 BICD2 interacts with PLK1 through its Polo-Box Domain. A Coimmunoprecipitation of endogenous PLK1 and BICD2 in exponentially growing (Exp) and mitotic (M) HeLa cell extracts. anti-BICD2 or normal IgG (NIgG) immunoprecipitates (IP) were analyzed by western blot (W) using either anti-PLK1 or anti-BICD2 antibodies. Note BICD2 high apparent molecular weight in mitotic cells, red arrowheads. PLK1 in the corresponding extracts is shown in the lower panel. The mean of quantifications corresponding to two independent experiments is shown (PLK1 intensity/BICD2 intensity in the immunoprecipitates; this and subsequent experiments source data are provided in the Source Data file). B PLK1 interacts with the N-terminal region of BICD2. Immunoprecipitates of the indicated recombinant GFP-fusion proteins were analyzed by western blot using either anti-PLK1, to detect the endogenous kinase, or anti-GFP. PLK1 in the corresponding extracts is shown in the lower panel. Note that different fragments of GFP-BICD2 are produced when recombinant proteins are expressed in cells. Arrowheads indicating the expected MW of relevant proteins have been added for clarity (GFP-BICD2, ~120 kDa; GFP-BICD2 1-575, ~90 kDa; GFP-BICD2 576-820, ~55 kDa; GFP, ~25 kDa). One of two independent experiments with similar results is shown. C PLK1 interacts with BICD2 through its Polo-Box Domain (PBD). Extracts of exponentially growing (Exp) or mitotic (M) HeLa cells were incubated with either bacterial expressed GST or GST-PBD (GST-PLK1 [354–603]) bound to GSH agarose beads. Endogenous BICD2 was detected by western blot (W) and GST-fusion proteins by Coomassie Brilliant Blue staining (CBB). BICD2 in the corresponding extracts is shown in the lower panel. Note that in both pulldowns from exponential and mitotic extracts the apparent molecular weight of BICD2 interacting with PLK1-PBD corresponds to the fastest migrating form (red arrowhead, high MW; black arrowhead, low MW). The mean of quantifications corresponding to two independent experiments is shown (BICD2 intensity/GST-PBD intensity in the pulldowns).CC BY · PubMed Central
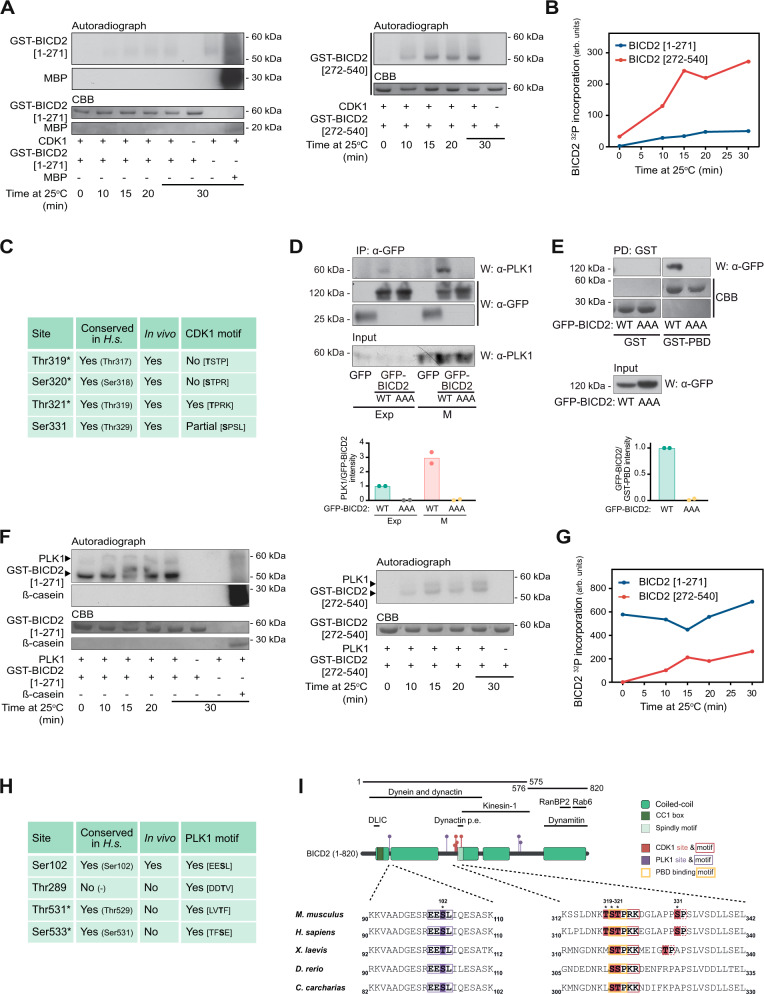
Fig. 2 BICD2 is a PLK1 and CDK1 substrate. A and B In vitro phosphorylation of GST-BICD2 fragments by CDK1/cyclin B. Purified bacterial GST-BICD2 [1–271] (left) or GST-BICD2 [272–540] (right) were incubated with recombinant CDK1/cyclin B plus [γ-32P]ATP/Mg2+ at 25 °C for the indicated times. Myelin basic protein (MBP) was used as a positive control. Reactions were stopped with electrophoresis sample buffer and after SDS–PAGE proteins were visualized by Coomassie Brilliant Blue staining (CBB) and 32P incorporation by autoradiography. Relative 32P incorporation into BICD2 was quantified using a Phosphorimager and is shown in B. A non-radioactive replicate of the GST-BICD2 [272–540] reaction at 15 min was used to identify phosphorylated sites by LC–MS/MS. The original analysis using trypsin covered >80% of the sequence and included all the putative CDK1 sites except Thr321, predicted to be contained in a very short peptide (Thr319-Lys324). The analysis identified Ser331 as phosphorylated site. An additional analysis targeted to Thr321 and its surroundings and using chymotrypsin was carried out, detecting an additional phosphopeptide with a single phosphosite ambiguous between Thr319, Ser320 and Thr321. C Sites phosphorylated in vitro in BICD2 [272–540] by CDK1, as identified by LC-MS/MS. Conserved in H.s., conservation in humans (the orthologous residue is indicated between parenthesis). In vivo, sites previously determined to be phosphorylated in vivo in human cells (see https://www.phosphosite.org/). CDK1 motif, presence of a CDK1 consensus motif around the phosphorylation site ([S/T]PX[K/R] where X is any residue and S or T are the modified residues). Asterisks denote that a single phosphorylation site was detected that could not be assigned unequivocally among the three residues. D, E The interaction of BICD2 and PLK1 depends on the residues phosphorylated by CDK1. D anti-GFP immunoprecipitates (IP) from extracts of exponentially growing (Exp) or mitotic (M) HeLa cells expressing either GFP, GFP-BICD2 wild type (WT) or GFP-BICD2 [T319A, S320A, T321A] (GFP-BICD2 AAA). Endogenous PLK1 and GFP are detected by western blot (W). PLK1 in the corresponding extracts is shown in the lower panel. E Extracts of HeLa cells expressing GFP-BICD2 wild type (WT) or GFP-BICD2 AAA were incubated with GST or GST-PBD bound to GSH agarose beads. GFP was detected by western blot and GST-fusion proteins by Coomassie Brilliant Blue (CBB) staining. The mean of quantifications corresponding to two independent experiments is shown (D, PLK1 intensity/GFP-BICD2 intensity in the immunoprecipitates; E, GFP-BICD2 intensity/GST-PBD intensity in the pulldowns). F, G In vitro phosphorylation of GST-BICD2 fragments by PLK1. Purified bacterial GST-BICD2 [1–271] (left) or GST-BICD2 [272–540] (right), were incubated with recombinant PLK1 plus [γ-32P]ATP/Mg2+ at 25 °C for the indicated times. ß-casein was used as a positive control. Phosphorylation was visualized and quantified as above. Relative 32P incorporation into BICD2 is shown in (G). Note that phosphorylation of GST-BICD2 [1-271] by PLK1 was extremely fast, occurring during the mixing of the reaction components and before it was stopped with electrophoresis sample buffer (t = 0). Non-radioactive replicates of the reactions at 15 min were used to identify phosphorylated sites by LC–MS/MS. Analysis using trypsin covered ~90% of the sequence in both cases. H Sites phosphorylated in vitro in BICD2 [1–271] and BICD2 [272–540] by PLK1, as identified by LC–MS/MS (see also Supplementary Fig. S2). Conserved in H.s., conservation in humans (the orthologous residue is indicated between parenthesis). In vivo, sites previously determined to be phosphorylated in vivo in human cells (see https://www.phosphosite.org/). PLK1 motif, presence of a PLK1 consensus motif around the phosphorylation site ([D/E]X[S/T]Φ, where X is any aminoacid and Φ is an hydrophobic residue). Asterisks denote that a single phosphorylation site was detected that could not be assigned unequivocally among the two residues. I Top, schematic representation of BICD2, noting regions interacting with different proteins or protein complexes, plus the different fragments and residues mentioned in this figure (Dynactin p.e., dynactin pointed end). Residue number corresponds to mouse BICD2. Coiled-coil regions have been predicted using paircoil276. Bottom, sequence alignments of residues surrounding Ser102, Thr319, Ser320, Thr321 and Ser331 in different BICD2 vertebrate orthologues are shown: mouse (Q921C5), human (Q8TD16), Xenopus laevis (Q5FWL8), Dario rerio (X1WDT9) and Carcharodon carcharias, a cartilaginous fish (XP_041047193). See also Supplementary Fig. S2 for similar alignments with BICD family members.
Fig. 2 BICD2 is a PLK1 and CDK1 substrate. A and B In vitro phosphorylation of GST-BICD2 fragments by CDK1/cyclin B. Purified bacterial GST-BICD2 [1–271] (left) or GST-BICD2 [272–540] (right) were incubated with recombinant CDK1/cyclin B plus [γ-32P]ATP/Mg2+ at 25 °C for the indicated times. Myelin basic protein (MBP) was used as a positive control. Reactions were stopped with electrophoresis sample buffer and after SDS–PAGE proteins were visualized by Coomassie Brilliant Blue staining (CBB) and 32P incorporation by autoradiography. Relative 32P incorporation into BICD2 was quantified using a Phosphorimager and is shown in B. A non-radioactive replicate of the GST-BICD2 [272–540] reaction at 15 min was used to identify phosphorylated sites by LC–MS/MS. The original analysis using trypsin covered >80% of the sequence and included all the putative CDK1 sites except Thr321, predicted to be contained in a very short peptide (Thr319-Lys324). The analysis identified Ser331 as phosphorylated site. An additional analysis targeted to Thr321 and its surroundings and using chymotrypsin was carried out, detecting an additional phosphopeptide with a single phosphosite ambiguous between Thr319, Ser320 and Thr321. C Sites phosphorylated in vitro in BICD2 [272–540] by CDK1, as identified by LC-MS/MS. Conserved in H.s., conservation in humans (the orthologous residue is indicated between parenthesis). In vivo, sites previously determined to be phosphorylated in vivo in human cells (see https://www.phosphosite.org/). CDK1 motif, presence of a CDK1 consensus motif around the phosphorylation site ([S/T]PX[K/R] where X is any residue and S or T are the modified residues). Asterisks denote that a single phosphorylation site was detected that could not be assigned unequivocally among the three residues. D, E The interaction of BICD2 and PLK1 depends on the residues phosphorylated by CDK1. D anti-GFP immunoprecipitates (IP) from extracts of exponentially growing (Exp) or mitotic (M) HeLa cells expressing either GFP, GFP-BICD2 wild type (WT) or GFP-BICD2 [T319A, S320A, T321A] (GFP-BICD2 AAA). Endogenous PLK1 and GFP are detected by western blot (W). PLK1 in the corresponding extracts is shown in the lower panel. E Extracts of HeLa cells expressing GFP-BICD2 wild type (WT) or GFP-BICD2 AAA were incubated with GST or GST-PBD bound to GSH agarose beads. GFP was detected by western blot and GST-fusion proteins by Coomassie Brilliant Blue (CBB) staining. The mean of quantifications corresponding to two independent experiments is shown (D, PLK1 intensity/GFP-BICD2 intensity in the immunoprecipitates; E, GFP-BICD2 intensity/GST-PBD intensity in the pulldowns). F, G In vitro phosphorylation of GST-BICD2 fragments by PLK1. Purified bacterial GST-BICD2 [1–271] (left) or GST-BICD2 [272–540] (right), were incubated with recombinant PLK1 plus [γ-32P]ATP/Mg2+ at 25 °C for the indicated times. ß-casein was used as a positive control. Phosphorylation was visualized and quantified as above. Relative 32P incorporation into BICD2 is shown in (G). Note that phosphorylation of GST-BICD2 [1-271] by PLK1 was extremely fast, occurring during the mixing of the reaction components and before it was stopped with electrophoresis sample buffer (t = 0). Non-radioactive replicates of the reactions at 15 min were used to identify phosphorylated sites by LC–MS/MS. Analysis using trypsin covered ~90% of the sequence in both cases. H Sites phosphorylated in vitro in BICD2 [1–271] and BICD2 [272–540] by PLK1, as identified by LC–MS/MS (see also Supplementary Fig. S2). Conserved in H.s., conservation in humans (the orthologous residue is indicated between parenthesis). In vivo, sites previously determined to be phosphorylated in vivo in human cells (see https://www.phosphosite.org/). PLK1 motif, presence of a PLK1 consensus motif around the phosphorylation site ([D/E]X[S/T]Φ, where X is any aminoacid and Φ is an hydrophobic residue). Asterisks denote that a single phosphorylation site was detected that could not be assigned unequivocally among the two residues. I Top, schematic representation of BICD2, noting regions interacting with different proteins or protein complexes, plus the different fragments and residues mentioned in this figure (Dynactin p.e., dynactin pointed end). Residue number corresponds to mouse BICD2. Coiled-coil regions have been predicted using paircoil276. Bottom, sequence alignments of residues surrounding Ser102, Thr319, Ser320, Thr321 and Ser331 in different BICD2 vertebrate orthologues are shown: mouse (Q921C5), human (Q8TD16), Xenopus laevis (Q5FWL8), Dario rerio (X1WDT9) and Carcharodon carcharias, a cartilaginous fish (XP_041047193). See also Supplementary Fig. S2 for similar alignments with BICD family members.CC BY · PubMed Central
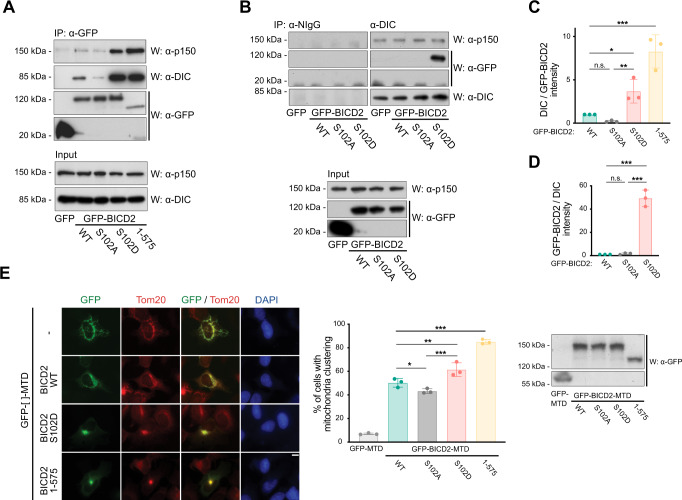
Fig. 3 Modification of BICD2 at Ser102 is able to control dynein binding and mobility. A–D A phosphomimetic mutation in BICD2 Ser102 (BICD2 S102D) results in increased dynein and dynactin binding to BICD2. A The indicated GFP-fusion proteins were immunoprecipitated (IP) from HeLa cells and analyzed by western blot (W) to detect dynein and dynactin (using respectively anti-dynein intermediate chain, DIC, and anti-p150 antibodies), plus GFP. DIC and p150 levels in the corresponding extracts are shown in the lower panel. B Normal IgG (NIgG) and anti-DIC immunoprecipitates from extracts expressing the indicated GFP-fusion proteins proved by western blot (W) with the indicated antibodies. Levels of GFP-fusion proteins plus p150 in the corresponding extracts are shown in the lower panel. C, D Quantification of the previous results. Top, DIC intensity/GFP-BICD2 intensity in the immunoprecipitates; mean ± SD of three independent experiments (corresponding to A). Bottom, GFP-BICD2 intensity/DIC intensity in the immunoprecipitates; mean ± SD of two independent experiments (corresponding to B). Statistical significance analyzed using one-way ANOVA with post hoc analysis (no correction for multiple comparations, Fisher’s LSD test). In (C), WT vs. S102A, P = 0.4380 (n.s.); WT vs. S102D, P = 0.0.232 (*); WT vs. 1-575, P < 0.0001 (***); S102A vs. S102D, P = 0.0068 (**). In (D), WT vs. S102A, P = 0.8631 (n.s); WT vs. S102D, P < 0.0001 (***); S102A vs. S102D, P < 0.0001 (***). E A phosphomimetic mutation in BICD2 Ser102 (BICD2 S102D) results in increased dynein mobility towards the centrosomes as detected by mitochondria relocalization and clustering. Different GFP-fusion proteins were targeted to mitochondria through a C-terminal mitochondria-targeting sequence domain (MTD) in U2OS cells. Representative immunofluorescence images are shown for each polypeptide, stained for GFP, Tom20, as a mitochondrial marker, and DAPI. Note that the S102D mutation favors clustering in a similar manner to the constitutively active BICD2 N-terminus (BICD2 1–575). Scale bar, 10 µm. See also Supplementary Fig. S3A, showing that clustering happens around the centrosomes. Quantification of the percentage of cells with clustered mitochondria (as defined as cells in which most mitochondria are spatially grouped in one or few clusters in the cytoplasm) for each different GFP-fusion form is shown (n = 3 biological replicates, 50 cells each; individual replicate means plus mean of replicates ± SD are shown; statistical significance analyzed using a Chi square test, with a two-sided P value; WT vs. S102A, P = 0.0464 (*); WT vs. S102D, P = 0.0010 (**); WT vs. 1–575, P < 0.0001 (***); S012A vs. S102D P < 0.0001 (***)). Expression levels of the different polypeptides as detected by western blot are shown.
Fig. 3 Modification of BICD2 at Ser102 is able to control dynein binding and mobility. A–D A phosphomimetic mutation in BICD2 Ser102 (BICD2 S102D) results in increased dynein and dynactin binding to BICD2. A The indicated GFP-fusion proteins were immunoprecipitated (IP) from HeLa cells and analyzed by western blot (W) to detect dynein and dynactin (using respectively anti-dynein intermediate chain, DIC, and anti-p150 antibodies), plus GFP. DIC and p150 levels in the corresponding extracts are shown in the lower panel. B Normal IgG (NIgG) and anti-DIC immunoprecipitates from extracts expressing the indicated GFP-fusion proteins proved by western blot (W) with the indicated antibodies. Levels of GFP-fusion proteins plus p150 in the corresponding extracts are shown in the lower panel. C, D Quantification of the previous results. Top, DIC intensity/GFP-BICD2 intensity in the immunoprecipitates; mean ± SD of three independent experiments (corresponding to A). Bottom, GFP-BICD2 intensity/DIC intensity in the immunoprecipitates; mean ± SD of two independent experiments (corresponding to B). Statistical significance analyzed using one-way ANOVA with post hoc analysis (no correction for multiple comparations, Fisher’s LSD test). In (C), WT vs. S102A, P = 0.4380 (n.s.); WT vs. S102D, P = 0.0.232 (*); WT vs. 1-575, P < 0.0001 (***); S102A vs. S102D, P = 0.0068 (**). In (D), WT vs. S102A, P = 0.8631 (n.s); WT vs. S102D, P < 0.0001 (***); S102A vs. S102D, P < 0.0001 (***). E A phosphomimetic mutation in BICD2 Ser102 (BICD2 S102D) results in increased dynein mobility towards the centrosomes as detected by mitochondria relocalization and clustering. Different GFP-fusion proteins were targeted to mitochondria through a C-terminal mitochondria-targeting sequence domain (MTD) in U2OS cells. Representative immunofluorescence images are shown for each polypeptide, stained for GFP, Tom20, as a mitochondrial marker, and DAPI. Note that the S102D mutation favors clustering in a similar manner to the constitutively active BICD2 N-terminus (BICD2 1–575). Scale bar, 10 µm. See also Supplementary Fig. S3A, showing that clustering happens around the centrosomes. Quantification of the percentage of cells with clustered mitochondria (as defined as cells in which most mitochondria are spatially grouped in one or few clusters in the cytoplasm) for each different GFP-fusion form is shown (n = 3 biological replicates, 50 cells each; individual replicate means plus mean of replicates ± SD are shown; statistical significance analyzed using a Chi square test, with a two-sided P value; WT vs. S102A, P = 0.0464 (*); WT vs. S102D, P = 0.0010 (**); WT vs. 1–575, P < 0.0001 (***); S012A vs. S102D P < 0.0001 (***)). Expression levels of the different polypeptides as detected by western blot are shown.CC BY · PubMed Central
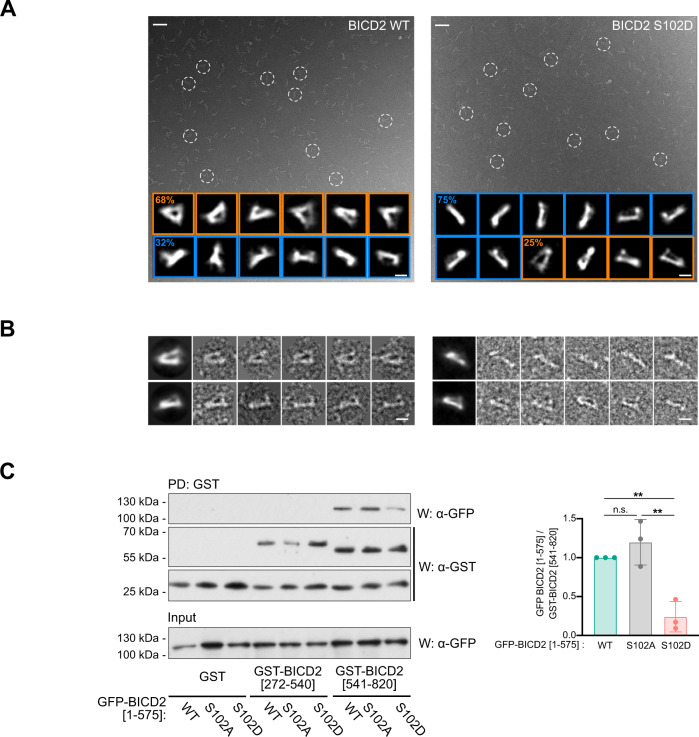
Fig. 4 Modification of Ser102 alters the conformation of BICD2. A Representative electron micrographs obtained for wild type (left) and S102D (right) TwinStrep-BICD2, using negatively stained samples. Several BICD2 individual molecules are highlighted within white dashed circles. Representative 2D average images are displayed at the bottom of each micrograph. The percentage of particles with a triangular or a rod-like morphology is noted in each case (30,476 BICD2 wild-type particles and 22,021 BICD2 S102D particles). Scale bars for micrographs and individual/average images represent 50 and 10 nm respectively. B Gallery of representative individual images of the wild type (left) and S102D (right) TwinStrep-BICD2 plus the corresponding average images. Scale bars, 10 nm. A and B Show results from one out of three experiments with identical results, in which 195 micrographies were acquired for BICD2 WT and 165 for BICD2 S102D. A representative image field is shown for each BICD2 form in (A). C Modification of Ser102 interferes with the interaction between BICD2 N- and C-terminal regions. HeLa cells were transfected with different forms of BICD2 N-terminus (BICD2 [1–575]) plus a fusion of GST and the C-terminal part of BICD2 (BICD2 [540–820]). GST alone or fused to an internal BICD2 region (GST-BICD2 [272–540]) were used as controls. GST pulldowns (PD) were analyzed by western blot (W) using either anti-GFP or anti-GST antibodies. Note that expression of GST-tagged forms of BICD2 fragments resulting also in the apparition of free GST in the samples, possibly as a result of degradation. GFP polypeptides in the corresponding extracts are shown in the lower panel. Mean ± SD of quantifications corresponding to three independent experiments is shown. Statistical significance analyzed using one-way ANOVA with post hoc analysis (no correction for multiple comparations, Fisher’s LSD test; WT vs S102A, P = 0.2777 (n.s); WT vs. S102D, P = 0.0038 (**); S102A vs. S102D, P = 0.0012 (**)).
Fig. 4 Modification of Ser102 alters the conformation of BICD2. A Representative electron micrographs obtained for wild type (left) and S102D (right) TwinStrep-BICD2, using negatively stained samples. Several BICD2 individual molecules are highlighted within white dashed circles. Representative 2D average images are displayed at the bottom of each micrograph. The percentage of particles with a triangular or a rod-like morphology is noted in each case (30,476 BICD2 wild-type particles and 22,021 BICD2 S102D particles). Scale bars for micrographs and individual/average images represent 50 and 10 nm respectively. B Gallery of representative individual images of the wild type (left) and S102D (right) TwinStrep-BICD2 plus the corresponding average images. Scale bars, 10 nm. A and B Show results from one out of three experiments with identical results, in which 195 micrographies were acquired for BICD2 WT and 165 for BICD2 S102D. A representative image field is shown for each BICD2 form in (A). C Modification of Ser102 interferes with the interaction between BICD2 N- and C-terminal regions. HeLa cells were transfected with different forms of BICD2 N-terminus (BICD2 [1–575]) plus a fusion of GST and the C-terminal part of BICD2 (BICD2 [540–820]). GST alone or fused to an internal BICD2 region (GST-BICD2 [272–540]) were used as controls. GST pulldowns (PD) were analyzed by western blot (W) using either anti-GFP or anti-GST antibodies. Note that expression of GST-tagged forms of BICD2 fragments resulting also in the apparition of free GST in the samples, possibly as a result of degradation. GFP polypeptides in the corresponding extracts are shown in the lower panel. Mean ± SD of quantifications corresponding to three independent experiments is shown. Statistical significance analyzed using one-way ANOVA with post hoc analysis (no correction for multiple comparations, Fisher’s LSD test; WT vs S102A, P = 0.2777 (n.s); WT vs. S102D, P = 0.0038 (**); S102A vs. S102D, P = 0.0012 (**)).CC BY · PubMed Central
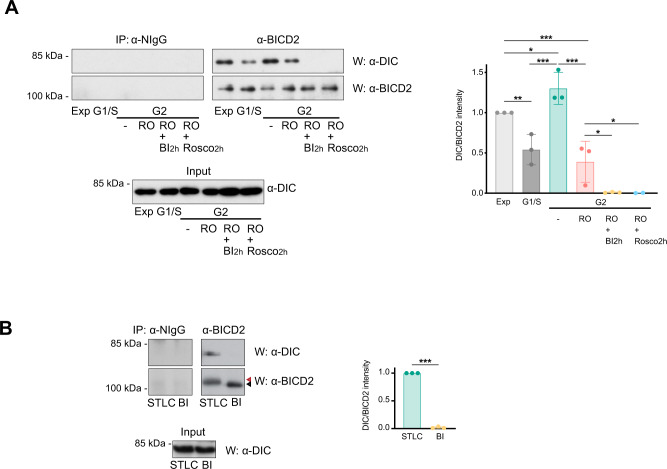
Fig. 5 BICD2 forms a complex with dynein in G2 and M that is dependent on PLK1 activity. A PLK1 inhibition disrupts the interaction between BICD2 and dynein in G2. Normal IgG (NIgG) or anti-BICD2 immunoprecipitates (IP) from HeLa cells at different phases of the cell cycle were analyzed by western blot (W) using anti-DIC or anti-BICD2 antibodies. DIC levels in the corresponding extracts are shown in the lower panel. Exp exponentially growing cells, G1/S cells arrested at the G1/S border after a double thymidine block, G2 cells in G2 (-, untreated G2 cells, 8 h after being released form a double thymidine block, RO RO-3306-arrested G2 cells (9 M, 16 h); RO + BI2h RO-3306-arrested G2 cells treated for 2h with 100 nM BI 2536, RO + Rosco2h RO-3306-arrested G2 cells treated for 2h with 55 μM roscovitine). Cell cycle assignation was confirmed by FACS (see Supplementary Fig. S7). The mean ± SD of quantifications corresponding to three independent experiments (except for RO + Rosco2h, that correspond to two independent experiments) is shown (statistical significance analyzed using one-way ANOVA with post hoc analysis; no correction for multiple comparations, Fisher’s LSD test; Exp vs G1/S, P = 0.0049 (**); Exp vs. G2/-, P = 0.0408 (*), Exp vs. G2/RO, P = 0.0007 (***); G1/S vs. G2/-, P = 0.0001 (***); G2/- vs. G2/RO, P < 0.0001 (***); G2/RO vs. G2/RO + BI2h, P = 0.0138 (*); G2/RO vs. G2/RO + Rosco2h, P = 0.0222 (*)). B PLK1 inhibition also disrupts the interaction between BICD2 and dynein in mitosis. As in (A). STLC, cells arrested in prometaphase with STLC (5 μM, 16 h); BI, cells arrested in prometaphase with BI 2536 (100 nM, 16 h). Note the increased apparent molecular weight of BICD2 in STLC- but not in BI 2536-arrested cells (red arrowhead, high MW; black arrowhead, low MW). The mean ± SD of quantifications corresponding to three independent experiments is shown (DIC intensity/BICD2 intensity in the immunoprecipitates; statistical significance analyzed using an unpaired t-test, with a two-sided P value; STLC vs. BI, P < 0.001 (***)).
Fig. 5 BICD2 forms a complex with dynein in G2 and M that is dependent on PLK1 activity. A PLK1 inhibition disrupts the interaction between BICD2 and dynein in G2. Normal IgG (NIgG) or anti-BICD2 immunoprecipitates (IP) from HeLa cells at different phases of the cell cycle were analyzed by western blot (W) using anti-DIC or anti-BICD2 antibodies. DIC levels in the corresponding extracts are shown in the lower panel. Exp exponentially growing cells, G1/S cells arrested at the G1/S border after a double thymidine block, G2 cells in G2 (-, untreated G2 cells, 8 h after being released form a double thymidine block, RO RO-3306-arrested G2 cells (9 M, 16 h); RO + BI2h RO-3306-arrested G2 cells treated for 2h with 100 nM BI 2536, RO + Rosco2h RO-3306-arrested G2 cells treated for 2h with 55 μM roscovitine). Cell cycle assignation was confirmed by FACS (see Supplementary Fig. S7). The mean ± SD of quantifications corresponding to three independent experiments (except for RO + Rosco2h, that correspond to two independent experiments) is shown (statistical significance analyzed using one-way ANOVA with post hoc analysis; no correction for multiple comparations, Fisher’s LSD test; Exp vs G1/S, P = 0.0049 (**); Exp vs. G2/-, P = 0.0408 (*), Exp vs. G2/RO, P = 0.0007 (***); G1/S vs. G2/-, P = 0.0001 (***); G2/- vs. G2/RO, P < 0.0001 (***); G2/RO vs. G2/RO + BI2h, P = 0.0138 (*); G2/RO vs. G2/RO + Rosco2h, P = 0.0222 (*)). B PLK1 inhibition also disrupts the interaction between BICD2 and dynein in mitosis. As in (A). STLC, cells arrested in prometaphase with STLC (5 μM, 16 h); BI, cells arrested in prometaphase with BI 2536 (100 nM, 16 h). Note the increased apparent molecular weight of BICD2 in STLC- but not in BI 2536-arrested cells (red arrowhead, high MW; black arrowhead, low MW). The mean ± SD of quantifications corresponding to three independent experiments is shown (DIC intensity/BICD2 intensity in the immunoprecipitates; statistical significance analyzed using an unpaired t-test, with a two-sided P value; STLC vs. BI, P < 0.001 (***)).CC BY · PubMed Central
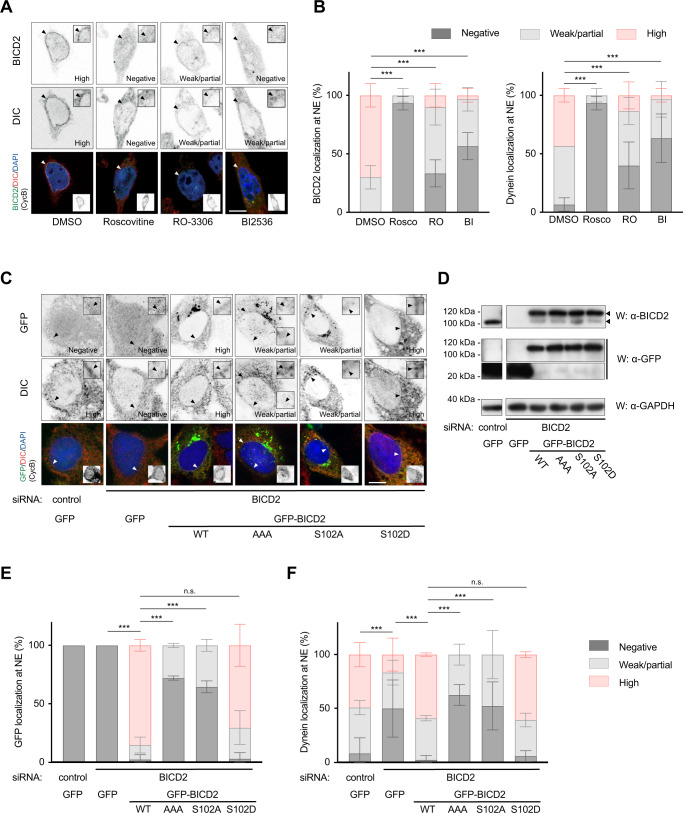
Fig. 6 PLK1 activity and BICD2 Ser102 phosphorylation are necessary for normal BICD2 and dynein localization at the nuclear envelope in G2. A, B CDK and PLK1 inhibition strongly interfere with BICD2 and dynein localization to the nuclear envelope (NE) in G2 cells. A HeLa cells treated with DMSO, 55 μM Roscovitine (Rosco), 9 μM RO-3306 (RO) or 100 nM BI 2536 (BI) for 1 h were immunostained with the indicated antibodies plus DAPI. Example cells for each condition are shown. Scale bar, 10 µm. B G2 cells were scored for BICD2 and DIC at the nuclear envelope and the results quantified as shown (n = 3 biological replicates, 10 cells per experiment; mean ± SD is shown; statistical significance was analyzed using a Chi square test, with a two-sided P value; all comparisons P < 0.0001 (***)). C–F Phosphomimetic BICD2 S102D, but not BICD2 AAA or BICD2 S102A, is able to rescue dynein nuclear envelope localization in G2 cells with low endogenous BICD2 levels. C HeLa cells were transfected with the indicated siRNAs and after 48 h transfected again with siRNAs plus the indicated GFP-tagged cDNA constructs. After 24 h cells were fixed and immunostained with the indicated antibodies plus DAPI. Example cells for each condition are shown (scale bar, 10 µm). D Expression levels of endogenous BICD2 and GFP-fusion proteins of a representative experiment. GFP-positive G2 cells were scored for GFP (E) and DIC (F) at the nuclear envelope and the results quantified as shown (n = 3 biological replicates, 8–15 cells per experiment; mean ± SD is shown; statistical significance was analyzed using a Chi square test, with a two-sided P value; all comparisons P < 0.0001 (***), except for WT vs S102D, P = 0.2724 (n.s.) in (E), and WT vs S102D, P = 0.7846 (n.s.) in (D)).
Fig. 6 PLK1 activity and BICD2 Ser102 phosphorylation are necessary for normal BICD2 and dynein localization at the nuclear envelope in G2. A, B CDK and PLK1 inhibition strongly interfere with BICD2 and dynein localization to the nuclear envelope (NE) in G2 cells. A HeLa cells treated with DMSO, 55 μM Roscovitine (Rosco), 9 μM RO-3306 (RO) or 100 nM BI 2536 (BI) for 1 h were immunostained with the indicated antibodies plus DAPI. Example cells for each condition are shown. Scale bar, 10 µm. B G2 cells were scored for BICD2 and DIC at the nuclear envelope and the results quantified as shown (n = 3 biological replicates, 10 cells per experiment; mean ± SD is shown; statistical significance was analyzed using a Chi square test, with a two-sided P value; all comparisons P < 0.0001 (***)). C–F Phosphomimetic BICD2 S102D, but not BICD2 AAA or BICD2 S102A, is able to rescue dynein nuclear envelope localization in G2 cells with low endogenous BICD2 levels. C HeLa cells were transfected with the indicated siRNAs and after 48 h transfected again with siRNAs plus the indicated GFP-tagged cDNA constructs. After 24 h cells were fixed and immunostained with the indicated antibodies plus DAPI. Example cells for each condition are shown (scale bar, 10 µm). D Expression levels of endogenous BICD2 and GFP-fusion proteins of a representative experiment. GFP-positive G2 cells were scored for GFP (E) and DIC (F) at the nuclear envelope and the results quantified as shown (n = 3 biological replicates, 8–15 cells per experiment; mean ± SD is shown; statistical significance was analyzed using a Chi square test, with a two-sided P value; all comparisons P < 0.0001 (***), except for WT vs S102D, P = 0.2724 (n.s.) in (E), and WT vs S102D, P = 0.7846 (n.s.) in (D)).CC BY · PubMed Central
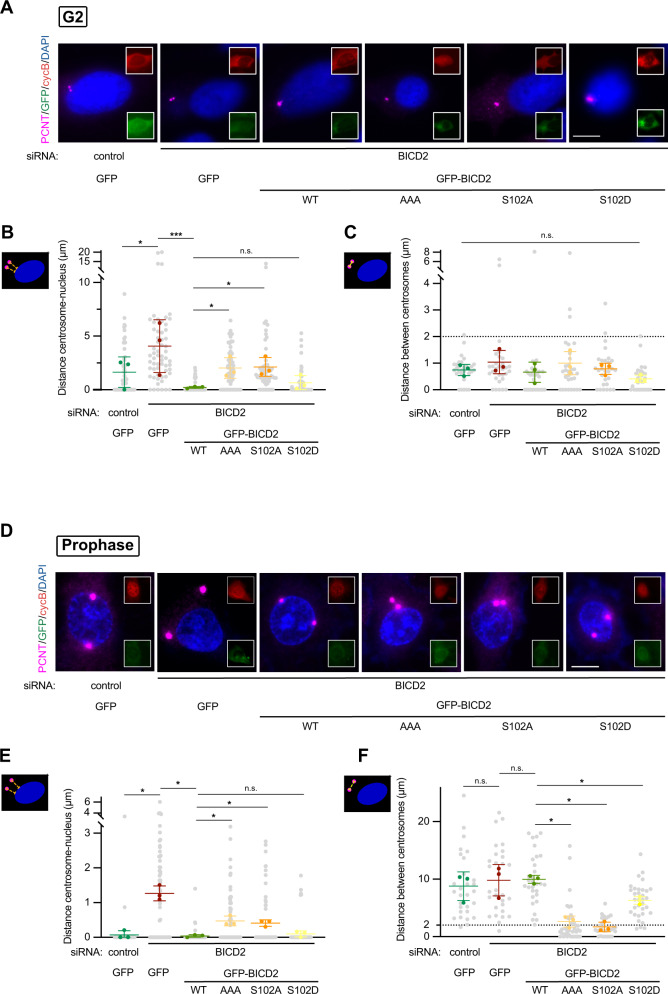
Fig. 7 BICD2 Ser102 phosphorylation regulates centrosome tethering to the nucleus and separation during G2 and early mitosis. The figure shows the ability of different BICD2 mutant forms to rescue centrosome tethering to the nucleus and centrosome separation upon endogenous BICD2 downregulation in G2 (A–C) and prophase (D–F). For this, HeLa cells were transfected with the indicated siRNAs and cDNAs as in Fig. 6C–F, fixed and immunostained with the indicated antibodies plus DAPI. Pericentrin was used as a centrosomal marker, cyclin B and DNA staining to identify cell cycle stage. Example cells for each condition are shown in (A) and (D). Insets show that cells are positive for cyclin B (red channel) and express GFP-tagged recombinant proteins (green channel). Note uncondensed DNA and mostly cytoplasmatic cyclin B in G2 cells (in A) and condensed DNA and nuclear cyclin B in prophase cells (in D). Centrosomes are considered to be separated if the intercentrosomal distance is more than 2 µm (indicated with a dashed line in the graphs in C and F). Scale bar, 10 µm. See also Supplementary Fig. S9 for the individual image channels. A–C Phosphomimetic BICD2 S102D, but not BICD2 AAA or BICD2 S102A, is able to rescue centrosome tethering to the nucleus in G2 cells with low endogenous BICD2 levels. Centrosome to nucleus (B) and centrosome to centrosome distances (C) were quantified in GFP-positive G2 cells (n = 3 biological replicates, 10 cells per experiment; individual replicate means plus mean of replicates ± SD are shown; statistical significance analyzed using one-way ANOVA with post hoc analysis; no correction for multiple comparations, Fisher’s LSD test). In (B): control RNAi/GFP vs BICD2 RNAi/GFP, P = 0.0130 (*); BICD2 RNAi/GFP vs. BICD2 RNAi/GFP-BICD2 WT, P = 0.0007 (***); BICD2 RNAi/GFP-BICD2 WT vs. BICD2 RNAi/GFP-BICD2 AAA, P = 0.0483 (*); BICD2 RNAi/GFP-BICD2 WT vs. BICD2 RNAi/GFP-BICD2 S102A, P = 0.0395 (*); BICD2 RNAi/GFP-BICD2 WT vs BICD2 RNAi/GFP-BICD2 S102D, P = 0.6049 (n.s.). In (C), P = 0.2841 (n.s.). D–F Phosphomimetic BICD2 S102D, but not BICD2 AAA or BICD2 S102A, is able to rescue centrosome separation in prophase cells with low endogenous BICD2 levels. Centrosome to nucleus (D) and centrosome to centrosome (E) distances were quantified in GFP-positive prophase cells (n = 3 biological replicates, 10 cells per experiment; individual replicate means plus mean of replicates ± SD are shown; statistical significance analyzed using one-way ANOVA with post hoc analysis; no correction for multiple comparations, Fisher’s LSD test). In (E): control RNAi/GFP vs BICD2 RNAi/GFP, P = 0.0169 (*); BICD2 RNAi/GFP vs. BICD2 RNAi/GFP-BICD2 WT, P = 0.0137 (*); BICD2 RNAi/GFP-BICD2 WT vs. BICD2 RNAi/GFP-BICD2 AAA, P = 0.0322 (*); BICD2 RNAi/GFP-BICD2 WT vs. BICD2 RNAi/GFP-BICD2 S102A, P = 0.0342 (*); BICD2 RNAi/GFP-BICD2 WT vs BICD2 RNAi/GFP-BICD2 S102D, P = 0.4665 (n.s.). In (F): control RNAi/GFP vs BICD2 RNAi/GFP, P = 0.7449 (n.s.); BICD2 RNAi/GFP vs. BICD2 RNAi/GFP-BICD2 WT, P = 0.9406 (n.s.); BICD2 RNAi/GFP-BICD2 WT vs. BICD2 RNAi/GFP-BICD2 AAA, P = 0.0124 (*); BICD2 RNAi/GFP-BICD2 WT vs. BICD2 RNAi/GFP-BICD2 S102A, P = 0.0110 (*); BICD2 RNAi/GFP-BICD2 WT vs BICD2 RNAi/GFP-BICD2 S102D, P = 0.0431 (*).
Fig. 7 BICD2 Ser102 phosphorylation regulates centrosome tethering to the nucleus and separation during G2 and early mitosis. The figure shows the ability of different BICD2 mutant forms to rescue centrosome tethering to the nucleus and centrosome separation upon endogenous BICD2 downregulation in G2 (A–C) and prophase (D–F). For this, HeLa cells were transfected with the indicated siRNAs and cDNAs as in Fig. 6C–F, fixed and immunostained with the indicated antibodies plus DAPI. Pericentrin was used as a centrosomal marker, cyclin B and DNA staining to identify cell cycle stage. Example cells for each condition are shown in (A) and (D). Insets show that cells are positive for cyclin B (red channel) and express GFP-tagged recombinant proteins (green channel). Note uncondensed DNA and mostly cytoplasmatic cyclin B in G2 cells (in A) and condensed DNA and nuclear cyclin B in prophase cells (in D). Centrosomes are considered to be separated if the intercentrosomal distance is more than 2 µm (indicated with a dashed line in the graphs in C and F). Scale bar, 10 µm. See also Supplementary Fig. S9 for the individual image channels. A–C Phosphomimetic BICD2 S102D, but not BICD2 AAA or BICD2 S102A, is able to rescue centrosome tethering to the nucleus in G2 cells with low endogenous BICD2 levels. Centrosome to nucleus (B) and centrosome to centrosome distances (C) were quantified in GFP-positive G2 cells (n = 3 biological replicates, 10 cells per experiment; individual replicate means plus mean of replicates ± SD are shown; statistical significance analyzed using one-way ANOVA with post hoc analysis; no correction for multiple comparations, Fisher’s LSD test). In (B): control RNAi/GFP vs BICD2 RNAi/GFP, P = 0.0130 (*); BICD2 RNAi/GFP vs. BICD2 RNAi/GFP-BICD2 WT, P = 0.0007 (***); BICD2 RNAi/GFP-BICD2 WT vs. BICD2 RNAi/GFP-BICD2 AAA, P = 0.0483 (*); BICD2 RNAi/GFP-BICD2 WT vs. BICD2 RNAi/GFP-BICD2 S102A, P = 0.0395 (*); BICD2 RNAi/GFP-BICD2 WT vs BICD2 RNAi/GFP-BICD2 S102D, P = 0.6049 (n.s.). In (C), P = 0.2841 (n.s.). D–F Phosphomimetic BICD2 S102D, but not BICD2 AAA or BICD2 S102A, is able to rescue centrosome separation in prophase cells with low endogenous BICD2 levels. Centrosome to nucleus (D) and centrosome to centrosome (E) distances were quantified in GFP-positive prophase cells (n = 3 biological replicates, 10 cells per experiment; individual replicate means plus mean of replicates ± SD are shown; statistical significance analyzed using one-way ANOVA with post hoc analysis; no correction for multiple comparations, Fisher’s LSD test). In (E): control RNAi/GFP vs BICD2 RNAi/GFP, P = 0.0169 (*); BICD2 RNAi/GFP vs. BICD2 RNAi/GFP-BICD2 WT, P = 0.0137 (*); BICD2 RNAi/GFP-BICD2 WT vs. BICD2 RNAi/GFP-BICD2 AAA, P = 0.0322 (*); BICD2 RNAi/GFP-BICD2 WT vs. BICD2 RNAi/GFP-BICD2 S102A, P = 0.0342 (*); BICD2 RNAi/GFP-BICD2 WT vs BICD2 RNAi/GFP-BICD2 S102D, P = 0.4665 (n.s.). In (F): control RNAi/GFP vs BICD2 RNAi/GFP, P = 0.7449 (n.s.); BICD2 RNAi/GFP vs. BICD2 RNAi/GFP-BICD2 WT, P = 0.9406 (n.s.); BICD2 RNAi/GFP-BICD2 WT vs. BICD2 RNAi/GFP-BICD2 AAA, P = 0.0124 (*); BICD2 RNAi/GFP-BICD2 WT vs. BICD2 RNAi/GFP-BICD2 S102A, P = 0.0110 (*); BICD2 RNAi/GFP-BICD2 WT vs BICD2 RNAi/GFP-BICD2 S102D, P = 0.0431 (*).CC BY · PubMed Central
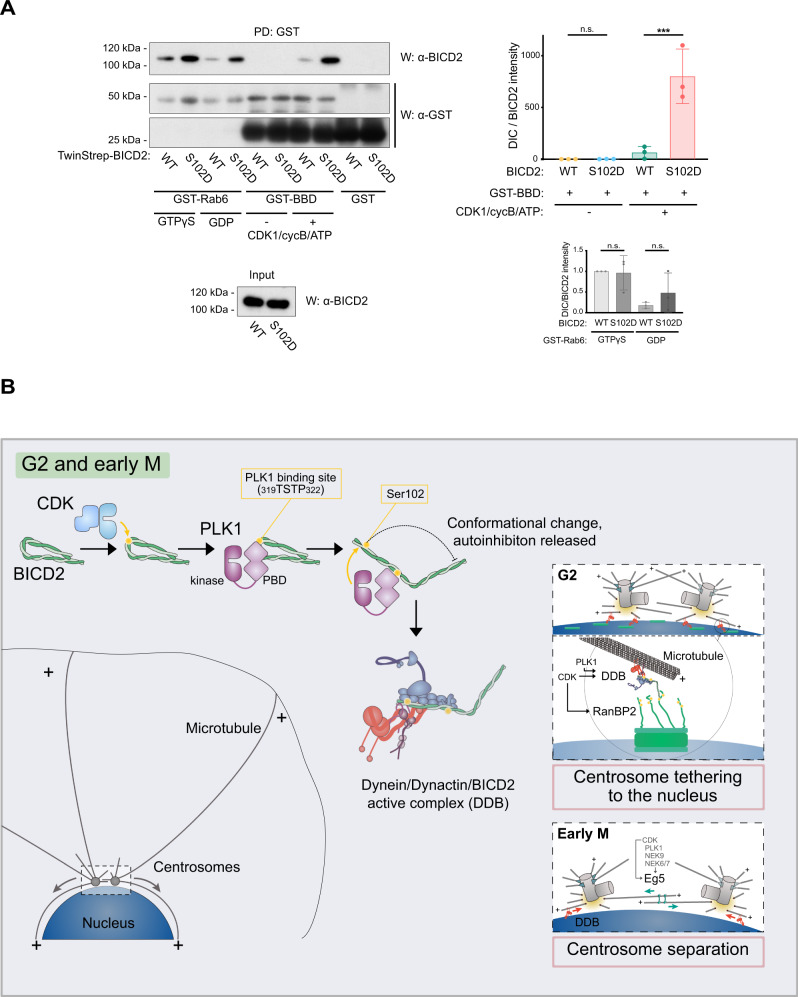
Fig. 8 Ser102 controls BICD2 binding to phosphorylated RanBP2 BBD. Graphical model illustrating the role of phosphorylation in controlling BICD2 activity and function in G2 and M. A Wild type and S102D TwinStrep-BID2 were incubated with GSH agarose beads bound to GST-Rab6 (preloaded with either GDP or GTPγS) or GST-RanBP2 BBD (BICD2 Binding Domain, residues 2147-2287). When indicated, GST-RanBP2 BBD had been previously phosphorylated by incubation with CDK1/Cyclin B and ATP/Mg2+. After washes, TwinStrep-BICD2 bound to the beads was detected by western blot (W) using anti-BICD2 antibodies. GST-fusion proteins were subsequently detected with anti-GST antibodies (note that GST-RanBP2 BBD expresses poorly and gets easily degraded, resulting in free GST in the samples). One of three experiments is shown, together with a quantification of the amount of BICD2 bound to RanPB2 BBD and Rab6 in the different conditions (mean ± SD of three independent experiments; BICD2 intensity/GST intensity in the pulldowns; statistical significance analyzed using one-way ANOVA with post hoc analysis; no correction for multiple comparations, Fisher’s LSD test). For GST-BBD (top): WT vs. 102D, P = 0.9912 (n.s.); WT + CDK1 vs. 102D + CDK1, P < 0.0001 (***); for GST-Rab6 (bottom): WT + GTPγS vs. 102D + GTPγS, P = 0.8952 (n.s.); WT + GDP vs. 102D + GDP, P = 0.8230 (n.s.). B In G2 and early M, CDKs (CDK1 and possibly CDK2) phosphorylate BICD2 (yellow circles denote phosphorylation). This allows BICD2 to interact with the PBD domain of PLK1. In turn PLK1 phosphorylates BICD2 at Ser102, inducing a conformational change that results in the interaction of the adaptor with dynein and dynactin and the formation of an active DDB complex. In G2 (right, top box), phosphorylated BICD2 can interact with RanBP2 (also known as NUP358), once this nucleoporin has been phosphorylated by CDK121 (and possibly CDK2). RanBP2/BICD220, together with the Nup133/CENPF/NDE(L)126 dynein recruiting pathway, concentrates active dynein complexes to the nuclear pores (green boxes), effectively tethering the centrosomes to the nuclear envelope. Nesprin-2 additionally collaborates in recruiting BICD2/dynein to the nuclear membrane22. In early mitosis (lower box) this facilitates centrosome separation, mostly driven by the bipolar kinesin Eg5, that is also regulated by CDK166 and PLK1 through the action of the NIMA kinases NEK9, NEK6, and NEK750.
Fig. 8 Ser102 controls BICD2 binding to phosphorylated RanBP2 BBD. Graphical model illustrating the role of phosphorylation in controlling BICD2 activity and function in G2 and M. A Wild type and S102D TwinStrep-BID2 were incubated with GSH agarose beads bound to GST-Rab6 (preloaded with either GDP or GTPγS) or GST-RanBP2 BBD (BICD2 Binding Domain, residues 2147-2287). When indicated, GST-RanBP2 BBD had been previously phosphorylated by incubation with CDK1/Cyclin B and ATP/Mg2+. After washes, TwinStrep-BICD2 bound to the beads was detected by western blot (W) using anti-BICD2 antibodies. GST-fusion proteins were subsequently detected with anti-GST antibodies (note that GST-RanBP2 BBD expresses poorly and gets easily degraded, resulting in free GST in the samples). One of three experiments is shown, together with a quantification of the amount of BICD2 bound to RanPB2 BBD and Rab6 in the different conditions (mean ± SD of three independent experiments; BICD2 intensity/GST intensity in the pulldowns; statistical significance analyzed using one-way ANOVA with post hoc analysis; no correction for multiple comparations, Fisher’s LSD test). For GST-BBD (top): WT vs. 102D, P = 0.9912 (n.s.); WT + CDK1 vs. 102D + CDK1, P < 0.0001 (***); for GST-Rab6 (bottom): WT + GTPγS vs. 102D + GTPγS, P = 0.8952 (n.s.); WT + GDP vs. 102D + GDP, P = 0.8230 (n.s.). B In G2 and early M, CDKs (CDK1 and possibly CDK2) phosphorylate BICD2 (yellow circles denote phosphorylation). This allows BICD2 to interact with the PBD domain of PLK1. In turn PLK1 phosphorylates BICD2 at Ser102, inducing a conformational change that results in the interaction of the adaptor with dynein and dynactin and the formation of an active DDB complex. In G2 (right, top box), phosphorylated BICD2 can interact with RanBP2 (also known as NUP358), once this nucleoporin has been phosphorylated by CDK121 (and possibly CDK2). RanBP2/BICD220, together with the Nup133/CENPF/NDE(L)126 dynein recruiting pathway, concentrates active dynein complexes to the nuclear pores (green boxes), effectively tethering the centrosomes to the nuclear envelope. Nesprin-2 additionally collaborates in recruiting BICD2/dynein to the nuclear membrane22. In early mitosis (lower box) this facilitates centrosome separation, mostly driven by the bipolar kinesin Eg5, that is also regulated by CDK166 and PLK1 through the action of the NIMA kinases NEK9, NEK6, and NEK750.CC BY · PubMed Central

Verification

Claims the paper makes

The claims and statistics of this paper haven’t been checked yet.

Run the check — free, no account needed. It reads the open-access text and checks the sources it cites.

A few free checks a day · papers already verified open instantly · results are public

Self-check

Percentages, sums and reported differences re-computed from the paper’s own numbers.

The self-check needs the paper’s full text.

Citations

Cites

Show all 1 references

Research works printed but not linked: 73

  1. Agircan, F.G. , Schiebel, E. , and Mardin, B.R . (2014). Separate to operate: control of centrosome positioning and separation. Philos Trans R Soc Lond B Biol Sci 369, pii: 20130461. · DOI
  2. 10.1126/scisignal.2001796 · DOI
  3. 10.1074/jbc.M111.226605 · DOI
  4. 10.1016/j.devcel.2015.04.022 · DOI
  5. 10.1038/emboj.2011.179 · DOI
  6. 10.1016/0092-8674(95)90142-6 · DOI · Paper page
  7. 10.1083/jcb.201007118 · DOI
  8. 10.1016/j.tibs.2012.09.005 · DOI
  9. 2021, Structure and Mechanics of Dynein Motors, Annu. Rev. Biophys, 50, 549, 10.1146/annurev-biophys-111020-101511 · DOI
  10. 10.1016/j.sbi.2015.12.003 · DOI
  11. 2017, A Splice Variant of Centrosomin Converts Mitochondria to Microtubule-Organizing Centers, Curr. Biol. CB, 27, 1928, 10.1016/j.cub.2017.05.090 · DOI
  12. 2005, BicD-dependent localization processes: from Drosophilia development to human cell biology, Ann. Anat. Anat. Anz. Off. Organ Anat. Ges, 187, 539
  13. 10.1083/jcb.127.6.1671 · DOI
  14. 10.1016/j.cub.2017.11.046 · DOI
  15. 10.1126/science.1079079 · DOI
  16. 10.1016/S0092-8674(03)00725-6 · DOI
  17. 10.1038/sj.emboj.7601459 · DOI
  18. 10.1083/jcb.201610108 · DOI
  19. 10.1083/jcb.147.1.135 · DOI
  20. 10.1016/j.devcel.2007.06.010 · DOI · Paper page
  21. 10.1016/j.tcb.2016.01.001 · DOI
  22. 10.1093/emboj/20.15.4041 · DOI
  23. 10.1093/emboj/cdg592 · DOI
  24. 10.1016/j.cell.2013.08.024 · DOI
  25. 10.1126/science.1181348 · DOI
  26. 10.1083/jcb.201703201 · DOI
  27. 10.1016/S0171--9335(99)80020--X · DOI
  28. 10.1038/s41467-018-03412-8 · DOI
  29. 10.1073/pnas.1006615107 · DOI
  30. 10.1016/j.cub.2010.05.050 · DOI
  31. 10.1038/ncb891 · DOI · Paper page
  32. 2006, Paircoil2: improved prediction of coiled coils from sequence, Bioinforma. Oxf. Engl, 22, 356, 10.1093/bioinformatics/bti797 · DOI · Paper page
  33. 10.1038/nchembio825 · DOI
  34. 10.1126/science.1254198 · DOI
  35. 10.1111/j.1432-1033.1997.t01-2-00527.x · DOI · Paper page
  36. 2001, Centrosome cohesion is regulated by a balance of kinase and phosphatase activities, J Cell Sci, 114, 3749, 10.1242/jcs.114.20.3749 · DOI
  37. 10.1242/dev.02565 · DOI
  38. 10.1074/jbc.C300126200 · DOI
  39. Noell, C.R. , Loftus, K.M. , Cui, H. , Grewer, C.T. , Kizer, M. , Debler, E.W. , and Solmaz, S.R . (2018). A quantitative model for BicD2/cargo interactions. Biochemistry. · DOI
  40. Noell, C.R. , Loh, J.Y. , Debler, E.W. , Loftus, K.M. , Cui, H. , Russ, B.B. , Zhang, K. , Goyal, P. , and Solmaz, S.R . (2019). Role of Coiled-coil Registry Shifts in Activation of Human Bicaudal D2 for Dynein Recruitment Upon Cargo-Binding. J. Phys. Chem. Lett. · DOI
  41. 10.1242/jcs.227132 · DOI
  42. 10.1074/jbc.M116.738211 · DOI
  43. 10.1038/nmeth.4169 · DOI · Paper page
  44. 10.1007/s00412-014-0468-7 · DOI
  45. 10.1038/emboj.2012.272 · DOI
  46. 10.1038/s41580-018-0004-3 · DOI
  47. 10.7554/eLife.28257 · DOI
  48. 10.1083/jcb.146.3.597 · DOI
  49. 10.1101/gad.972202 · DOI
  50. 10.1016/S0092-8674(01)00628-6 · DOI
  51. 10.1038/emboj.2010.51 · DOI · Paper page
  52. 10.15252/embj.201488792 · DOI
  53. 10.1186/s12896-017-0400-3 · DOI
  54. 10.1091/mbc.E11-02-0095 · DOI
  55. 10.1074/jbc.M511735200 · DOI
  56. 10.7554/eLife.36306 · DOI
  57. 1994, Use of an oriented peptide library to determine the optimal substrates of protein kinases, Curr. Biol. CB, 4, 973, 10.1016/S0960-9822(00)00221-9 · DOI
  58. 10.1371/journal.pbio.1000350 · DOI
  59. 10.1091/mbc.E12-03-0210 · DOI
  60. 10.1016/j.cub.2006.12.037 · DOI
  61. 10.1016/j.celrep.2020.107681 · DOI
  62. 10.1016/S0171-9335(99)80061-2 · DOI
  63. 10.1016/0092-8674(91)90365-6 · DOI
  64. 10.1038/emboj.2008.242 · DOI
  65. 10.4161/cib.13780 · DOI
  66. 10.1016/j.bbrc.2015.03.054 · DOI
  67. 10.1126/science.aaa4080 · DOI · Paper page
  68. 10.1038/nature25462 · DOI
  69. 10.1073/pnas.0600447103 · DOI
  70. 2018, Expressing Multi-subunit Complexes Using biGBac, Methods Mol. Biol. Clifton NJ, 1764, 329, 10.1007/978-1-4939-7759-8_21 · DOI
  71. 10.1083/jcb.201707081 · DOI
  72. 10.1101/cshperspect.a005322 · DOI
  73. 10.1038/nrm3819 · DOI

Metadata

Authors
Gallisà-Suñé, N., Sànchez-Fernàndez-de-Landa, P., Zimmermann, F., Serna, M., Paz, J., Regué, L., Llorca, O., Lüders, J., & Roig, J.
Affiliations
  • Consejo Superior de Investigaciones Científicas (ES)
  • Institute for Research in Biomedicine (ES)
  • Spanish National Cancer Research Centre (ES)
Corresponding author
Roig, Joan
Venue
Nature Communications
Publisher
openRxiv
Published
2021-11-04
Volume
14
Issue
1
Pages
2434-2434
ISSN
2041-1723 (ISSN-L)
OpenAlex
W4367176084
Cited by
26
References
1
Citations by year
2026: 9 · 2025: 10 · 2024: 4 · 2023: 3
FWCI
3.76
Type
journal article
Language
en
Open access
Licence
cc-by
Locations
  • Nature Communications (publishedVersion, cc-by)
  • bioRxiv (Cold Spring Harbor Laboratory) (acceptedVersion, cc-by-nc-nd)
  • PubMed Central (publishedVersion, cc-by)
  • PubMed (publishedVersion)
  • DIGITAL.CSIC (Spanish National Research Council (CSIC)) (submittedVersion, cc-by)
  • RePEc: Research Papers in Economics (submittedVersion)
  • Dipòsit Digital de la Universitat de Barcelona (Universitat de Barcelona) (submittedVersion, cc-by)
  • DOAJ (DOAJ: Directory of Open Access Journals) (submittedVersion, cc-by-sa)
Funders
  • Institute for Research in Biomedicine
  • Ministerio de Ciencia, Innovación y Universidades (MCIN/ AEI /10.13039/501100011033/FEDER, 10.13039.501100011033, 10.13039/501100011033/FEDER, RED2018-102723-T, 2017 SGR 1089, 713673, / AEI10.13039/501100011033, 100010434, SAF2017-82632-P, 13039, MCIN/AEI/ 10.13039/501100011033, PGC 2018, 10.13039, .13039/501100011033, PGC2018-099562-B-I00, 501100011033, BFU2015-69275-P)
  • Centres de Recerca de Catalunya (501100011033)
  • European Commission (100010434, RED2018-102723, MCIN /AEI/ 10.13039/501100011033, 10.13039/501100011033, 13039/501100011033, 501100011033, HORIZON2020, /AEI/10.13039/501100011033, 713673, ID 100010434, RED2018-102723-T)
  • Universiteit Utrecht
  • Generalitat de Catalunya (10.13039/501100011033, 501100011033, 713673, ID100010434, 2017-SGR, 100010434, MCIN /AEI/10.13039/501100011033, SGR 1089)
  • Ministerio de Economía y Competitividad (PID2021-127045NB-I00), BFU2014-58422-P, PGC2018-096307-B-I00)
  • Ministerio de Ciencia e Innovación (713673, B-I00, 2017 SGR 1089, .13039/501100011033, PGC2018-099562-B-I00, ID100010434, 10.13039, RED2018-102723-T, 13039/501100011033/FEDER, / AEI/10, MCIN/AEI/10.13039/501100011033,, SAF2017-82632-P, 13039, 10.13039/501100011033/, PGC2018, 100010434, 501100011033, PID2020, PID2020-114429RB-I00, 10.13039/501100011033/FEDER, MCIN /AEI /10.13039, /AEI/10.13039/ 501100011033)
  • Fundación Bancaria Caixa d'Estalvis i Pensions de Barcelona (ID 100010434, 100010434)
  • Agència de Gestió d'Ajuts Universitaris i de Recerca (2017 SGR 1089, MCIN/AEI/10.13039/501100011033/, 10.13039/501100011033, 2017SGR, 13039/501100011033, RED2018-102723-T)
  • Instituto de Salud Carlos III (ID 100010434, MCIN/ AEI /10.13039/501100011033, /10.13039/501100011033, 100010434, Y2018/BIO4747, P2018/NMT4443, 713673, RED2018-102723-T)
  • European Regional Development Fund (MCIN/AEI/10.13039/ 501100011033/FEDER, RED2018-102723-T, SAF2017, PID2020-114429RB-I00, 10.13039/501100011033, 713673, 13039/501100011033, AEI/10.13039/501100011033, 100010434, 501100011033, SAF2017-82632-P, P2018/NMT4443, PGC2018, MCIN/ AEI/ 10.13039/501100011033, Y2018/BIO4747)
  • Agencia Estatal de Investigación (AEI//10.13039/501100011033/, BFU2014-58422-P, 501100011033, 10.13039/501100011033, MCIN/AEI/10.13039/501 100 011 033, 13039, .13039/501100011033, PGC2018-096307-B-I00, 10.13039, 100010434, 501100011033/FEDER, AEI/10, PGC2018, PID2021-127045NB-I00, RED2018-102723-T)
  • European Social Fund (501100011033)
Topics
  • Life Sciences › Biochemistry, Genetics and Molecular Biology › Cell Biology › Microtubule and mitosis dynamics
  • Life Sciences › Biochemistry, Genetics and Molecular Biology › Molecular Biology › Nuclear Structure and Function
  • Life Sciences › Biochemistry, Genetics and Molecular Biology › Molecular Biology › Genomics and Chromatin Dynamics
Keywords
BICD2, dynein, dynactin, phosphorylation, CDK1, PLK1, RanBP2, centrosome separation, nuclear envelope, G2/M phase
MeSH terms
Dynactin Complex, Cell Cycle, Dyneins, Microtubule-Associated Proteins, Phosphorylation, Centrosome

About these checks

Registry, retraction, Cites and statistics results are computed, not judged, with one exception: a printed reference that no index lists is read once by a model before it counts as a citation error. Claims are extracted by a model and kept only when their quote appears verbatim in the text; each cited source is then checked, with a model’s help, for whether it says what the claim relies on. Those verdicts can be wrong — read the claim’s quote and the cited source before relying on one.

Statistics and arithmetic are recomputed, not judged.

Confidence bands are shown only for fields calibrated on our annotated test set. None is calibrated yet, so no band is shown.

What counts as a claim ›How we measure confidence ›How we check this ›

Are you an author, or do you see a problem with this page? Request a review

How to cite

Cite CoChat for the checks on this page, and the paper for its own findings.

This page
CoChat. (2026). Citation check: CDK1 and PLK1 cooperate to regulate BICD2, dynein activation and recruitment to the nucleus as well as centrosome separation in G2/M. https://app.cochat.ai/papers/10.1101/2021.11.04.467245
The paper
Gallisà-Suñé, N., Sànchez-Fernàndez-de-Landa, P., Zimmermann, F., Serna, M., Paz, J., Regué, L., Llorca, O., Lüders, J., & Roig, J. (2021). CDK1 and PLK1 cooperate to regulate BICD2, dynein activation and recruitment to the nucleus as well as centrosome separation in G2/M. Nature Communications. https://doi.org/10.1101/2021.11.04.467245