PreprintCited by 24Circadian rhythm and melatoninUbiquitin and proteasome pathwaysGenetics, Aging, and Longevity in Model Organisms

The DOI matches its Crossref record; 1 of the 1 references it cites were found in a registry or an index.

Circadian regulation of macromolecular complex turnover and proteome renewal

Open access

Preprint — published as 10.1038/s44318-024-00121-5

Abstract

Although costly to maintain, protein homeostasis is indispensable for normal cellular function and long-term health. In mammalian cells and tissues, daily variation in global protein synthesis has been observed, but its utility and consequences for proteome integrity are not fully understood. Using several different pulse-labelling strategies, here we gain direct insight into the relationship between protein synthesis and abundance proteome-wide. We show that protein degradation varies in-phase with protein synthesis, facilitating rhythms in turnover rather than abundance. This results in daily consolidation of proteome renewal whilst minimising changes in composition. Coupled rhythms in synthesis and turnover are especially salient to the assembly of macromolecular protein complexes, particularly the ribosome, the most abundant species of complex in the cell. Daily turnover and proteasomal degradation rhythms render cells and mice more sensitive to proteotoxic stress at specific times of day, potentially contributing to daily rhythms in the efficacy of proteasomal inhibitors against cancer. Our findings suggest that circadian rhythms function to minimise the bioenergetic cost of protein homeostasis through temporal consolidation of protein turnover.

Overview

The claims and statistics of this paper haven’t been checked yet.

Run the check — free, no account needed. It reads the open-access text and checks the sources it cites.

A few free checks a day · papers already verified open instantly · results are public

Integrity signals

Registry

Crossref · 10.1101/2022.09.30.509905

Cites

1 of 1 references verified0 citation errors · 0 not checkable

Statistics

Figures

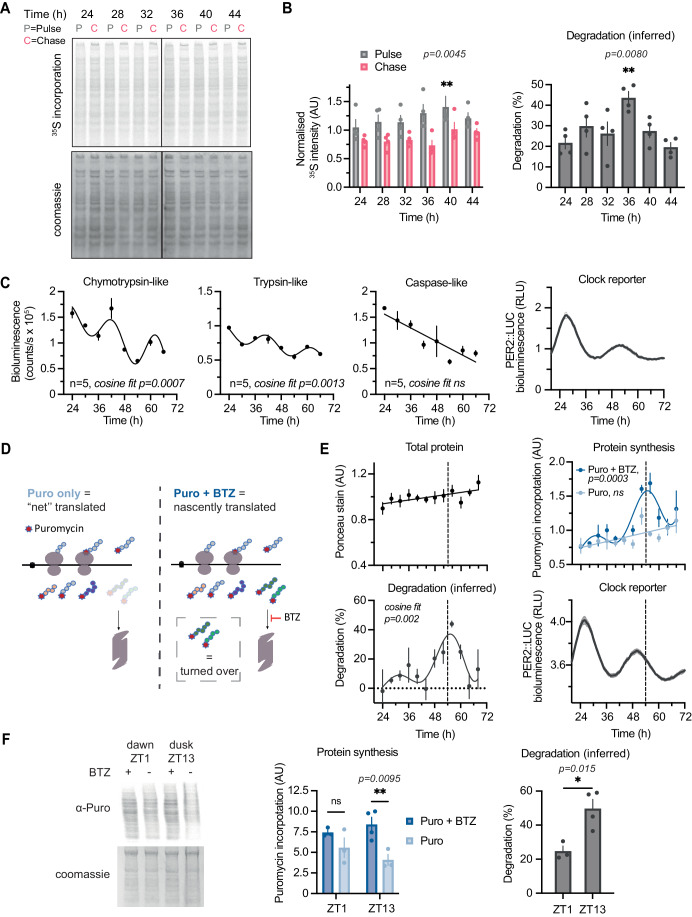
Figure 1 Bulk protein synthesis and degradation show circadian variation in culture and day/night differences in vivo. (A) A representative phosphor screen exposure of SDS-PAGE gel showing 35S-Met/Cys incorporation in 15 min pulse (P) and 1 h chase (C) samples at different circadian times in mouse lung fibroblasts lysed with digitonin buffer. (B) (Left) Quantification of radiolabel signal in pulse and chase at the different timepoints, normalised to protein content (by Coomassie stain) in four replicates shown in Appendix Fig. S1A. Statistics: two-way ANOVA with Dunnett’s multiple comparison test comparing T24 to other timepoints shown, P = 0.0080. (Right) The inferred degradation within 1 h of chase for each replicate is plotted, calculated as 100%*(1-Chase/Pulse) for each replicate. Statistics: one-way ANOVA with Dunnett’s multiple comparison test comparing T24 to other timepoints shown, P = 0.0045. n = 4 replicate cell cultures. (C) Chymotrypsin-like, trypsin-like, and caspase-like proteasome activities, measured by ProteasomeGlo cell-based assays, at different circadian times as indicated. Statistics: damped cosine wave fit compared with straight line (null hypothesis) by extra sum-of-squares F test, the statistically preferred fit is plotted and P value displayed. Parallel PER2::LUC bioluminescence recording is shown on the right, acting as phase marker. n = 5 replicate cell cultures. (D) Schematic representation of the optimised puromycin incorporation assay. Puromycin (Puro) is incorporated into nascent peptide chains during translation elongation. A subset of these gets degraded by the proteasome within the 30 min labelling timeframe, resulting in a measure of “net” translation. In the presence of bortezomib (BTZ), the proteasome is inhibited, so the peptides that would have been degraded are still present and can be detected. Thus, all nascently translated peptide chains can be detected. Degradation can be inferred from comparing the two conditions, and allows estimation of both translation and degradation in a single assay. (E) Quantification of total protein, protein synthesis and protein turnover from a puromycin incorporation timecourse, where at each of the 12 timepoints Puro ± BTZ was added directly to cell media, and cells lysed 30 min afterwards in urea/thiourea buffer. Puromycin incorporation was assessed by Western blotting, and total protein from a parallel Ponceau Red stain. Degradation was inferred from Puro ± BTZ intensity, calculated as 100%*(1-Puro/Puro+BTZ). Statistics: damped cosine wave fit compared with a straight line (null hypothesis) by extra sum-of-squares F test, the statistically preferred fit is plotted and P value displayed. Parallel PER2::LUC bioluminescence recording is shown below right, acting as phase marker (example phase comparison across all measurements is shown as dashed line). n = 3 replicate cell cultures. (F) Puromycin incorporation in vivo: mice received an i.p. injection of puromycin with or without BTZ at ZT1 or ZT13 (note: zeitgeber = ‘time-giver’ and indicates hours since initial lights on). Livers were harvested 40 min afterwards and extracted with urea/thiourea buffer. Representative anti-puromycin Western blot is shown (left), and quantification is shown (centre), normalised for protein loading as assessed by Coomassie staining. (Right) The inferred degradation is plotted, calculated as 100%*(1-Puro/Puro+BTZ). Statistics: two-way ANOVA with Sidak’s multiple comparisons test (centre), unpaired t test (right). N = 4 mice were used per condition, but in some cases one of the four injections were not successful, i.e., no puromycin labelling was observed and so no quantification could be performed (full data in Appendix Fig. S2B). Data information: In (B, C, E, F), data are presented as mean ± SEM. *P ≤ 0.05, **P < 0.01. Source data are available online for this figure.
Figure 1 Bulk protein synthesis and degradation show circadian variation in culture and day/night differences in vivo. (A) A representative phosphor screen exposure of SDS-PAGE gel showing 35S-Met/Cys incorporation in 15 min pulse (P) and 1 h chase (C) samples at different circadian times in mouse lung fibroblasts lysed with digitonin buffer. (B) (Left) Quantification of radiolabel signal in pulse and chase at the different timepoints, normalised to protein content (by Coomassie stain) in four replicates shown in Appendix Fig. S1A. Statistics: two-way ANOVA with Dunnett’s multiple comparison test comparing T24 to other timepoints shown, P = 0.0080. (Right) The inferred degradation within 1 h of chase for each replicate is plotted, calculated as 100%*(1-Chase/Pulse) for each replicate. Statistics: one-way ANOVA with Dunnett’s multiple comparison test comparing T24 to other timepoints shown, P = 0.0045. n = 4 replicate cell cultures. (C) Chymotrypsin-like, trypsin-like, and caspase-like proteasome activities, measured by ProteasomeGlo cell-based assays, at different circadian times as indicated. Statistics: damped cosine wave fit compared with straight line (null hypothesis) by extra sum-of-squares F test, the statistically preferred fit is plotted and P value displayed. Parallel PER2::LUC bioluminescence recording is shown on the right, acting as phase marker. n = 5 replicate cell cultures. (D) Schematic representation of the optimised puromycin incorporation assay. Puromycin (Puro) is incorporated into nascent peptide chains during translation elongation. A subset of these gets degraded by the proteasome within the 30 min labelling timeframe, resulting in a measure of “net” translation. In the presence of bortezomib (BTZ), the proteasome is inhibited, so the peptides that would have been degraded are still present and can be detected. Thus, all nascently translated peptide chains can be detected. Degradation can be inferred from comparing the two conditions, and allows estimation of both translation and degradation in a single assay. (E) Quantification of total protein, protein synthesis and protein turnover from a puromycin incorporation timecourse, where at each of the 12 timepoints Puro ± BTZ was added directly to cell media, and cells lysed 30 min afterwards in urea/thiourea buffer. Puromycin incorporation was assessed by Western blotting, and total protein from a parallel Ponceau Red stain. Degradation was inferred from Puro ± BTZ intensity, calculated as 100%*(1-Puro/Puro+BTZ). Statistics: damped cosine wave fit compared with a straight line (null hypothesis) by extra sum-of-squares F test, the statistically preferred fit is plotted and P value displayed. Parallel PER2::LUC bioluminescence recording is shown below right, acting as phase marker (example phase comparison across all measurements is shown as dashed line). n = 3 replicate cell cultures. (F) Puromycin incorporation in vivo: mice received an i.p. injection of puromycin with or without BTZ at ZT1 or ZT13 (note: zeitgeber = ‘time-giver’ and indicates hours since initial lights on). Livers were harvested 40 min afterwards and extracted with urea/thiourea buffer. Representative anti-puromycin Western blot is shown (left), and quantification is shown (centre), normalised for protein loading as assessed by Coomassie staining. (Right) The inferred degradation is plotted, calculated as 100%*(1-Puro/Puro+BTZ). Statistics: two-way ANOVA with Sidak’s multiple comparisons test (centre), unpaired t test (right). N = 4 mice were used per condition, but in some cases one of the four injections were not successful, i.e., no puromycin labelling was observed and so no quantification could be performed (full data in Appendix Fig. S2B). Data information: In (B, C, E, F), data are presented as mean ± SEM. *P ≤ 0.05, **P < 0.01. Source data are available online for this figure.CC BY · PubMed Central
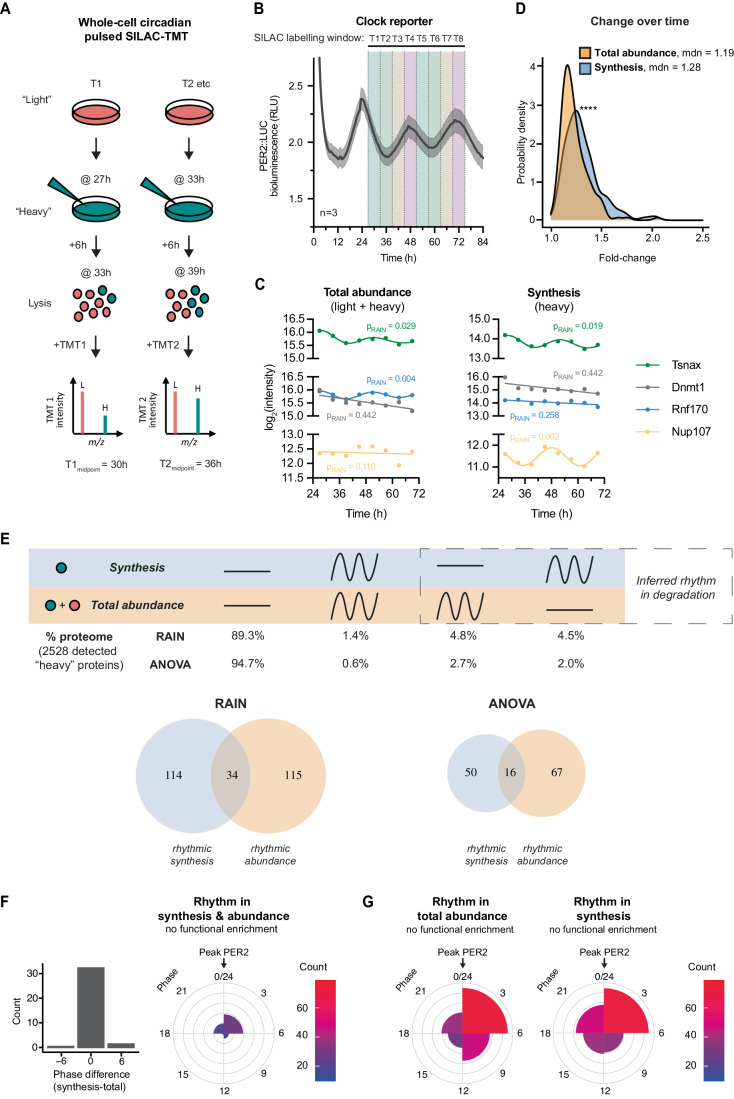
Figure 2 Proteome-wide investigation of circadian protein synthesis, abundance, and turnover using pulsed-SILAC mass spectrometry. (A) Schematic of circadian pulsed SILAC-TMT experiment design. In a set of entrained fibroblasts, at each circadian timepoint “light” media (DMEM with standard L-Arg and L-Lys) is switched for “heavy” (DMEM with 13C615N4 L-Arg and 13C615N2 L-Lys), and cells lysed after 6 h. Lysates are then digested, labelled with tandem mass tags (TMT), mixed and analysed by mass spectrometry. Data are presented aligned with the midpoint of the labelling window. (B) Parallel bioluminescence recording of PER2::LUC, acting as phase marker, overlayed with SILAC labelling windows that were used for the timecourse. (C) Representative examples of proteins (taken from Dataset EV1) changing rhythmically or staying constant in their total abundance (left) or synthesis (right), as measured in the pSILAC-TMT timecourse and rhythmicity defined by the RAIN rhythm detection method at P < 0.05. Representative of rhythmic abundance and synthesis: Akap12; representative of arrhythmic abundance and synthesis: Dnmt1; representative of rhythmic abundance but arrhythmic synthesis: Rnf170; and representative of arrhythmic abundance but rhythmic synthesis: Nup107. (D) Probability density distribution of fold change between peak and trough for proteins rhythmic in synthesis and in total abundance, representing the extent of change over time in these two sets. Statistics: Mann–Whitney test, P < 0.0001. (E) Comparison of rhythmicity between individual proteins’ synthesis and total abundance. Statistically significant change over time was assessed by two algorithms, RAIN and ANOVA, with P < 0.05 taken as rhythmicity threshold. (Top) Percentages of detected proteins falling under the four rhythmicity categories by the two algorithms are displayed. (Bottom) Venn diagrams of proteins significant for rhythms in synthesis and/or abundance. Degradation rhythms can account for cases of proteins with rhythms in synthesis but not abundance, or vice versa. Overall, 6264 proteins were detected; out of those at least one heavy peptide was detected for 2528 proteins (the set used for the analysis). (F) Phase distribution of proteins rhythmic (with RAIN threshold of P < 0.05) in both synthesis and total abundance, as well as their circadian phase difference. Gene ontology functional enrichment was tested for by GOrilla tool, in each phase separately or together, against the background of all detected proteins, and no terms were significant below the corrected P value (FDR q-value) 0.05 cutoff. Phase 0 is set as the peak of PER2::LUC. (G) Phase distribution of proteins rhythmic (with RAIN threshold of P < 0.05) in their total abundance and in their synthesis. Phase 0 is set as the peak of PER2::LUC. Data information: In (B), data are presented as mean ± SEM. ****P < 0.0001. Source data are available online for this figure.
Figure 2 Proteome-wide investigation of circadian protein synthesis, abundance, and turnover using pulsed-SILAC mass spectrometry. (A) Schematic of circadian pulsed SILAC-TMT experiment design. In a set of entrained fibroblasts, at each circadian timepoint “light” media (DMEM with standard L-Arg and L-Lys) is switched for “heavy” (DMEM with 13C615N4 L-Arg and 13C615N2 L-Lys), and cells lysed after 6 h. Lysates are then digested, labelled with tandem mass tags (TMT), mixed and analysed by mass spectrometry. Data are presented aligned with the midpoint of the labelling window. (B) Parallel bioluminescence recording of PER2::LUC, acting as phase marker, overlayed with SILAC labelling windows that were used for the timecourse. (C) Representative examples of proteins (taken from Dataset EV1) changing rhythmically or staying constant in their total abundance (left) or synthesis (right), as measured in the pSILAC-TMT timecourse and rhythmicity defined by the RAIN rhythm detection method at P < 0.05. Representative of rhythmic abundance and synthesis: Akap12; representative of arrhythmic abundance and synthesis: Dnmt1; representative of rhythmic abundance but arrhythmic synthesis: Rnf170; and representative of arrhythmic abundance but rhythmic synthesis: Nup107. (D) Probability density distribution of fold change between peak and trough for proteins rhythmic in synthesis and in total abundance, representing the extent of change over time in these two sets. Statistics: Mann–Whitney test, P < 0.0001. (E) Comparison of rhythmicity between individual proteins’ synthesis and total abundance. Statistically significant change over time was assessed by two algorithms, RAIN and ANOVA, with P < 0.05 taken as rhythmicity threshold. (Top) Percentages of detected proteins falling under the four rhythmicity categories by the two algorithms are displayed. (Bottom) Venn diagrams of proteins significant for rhythms in synthesis and/or abundance. Degradation rhythms can account for cases of proteins with rhythms in synthesis but not abundance, or vice versa. Overall, 6264 proteins were detected; out of those at least one heavy peptide was detected for 2528 proteins (the set used for the analysis). (F) Phase distribution of proteins rhythmic (with RAIN threshold of P < 0.05) in both synthesis and total abundance, as well as their circadian phase difference. Gene ontology functional enrichment was tested for by GOrilla tool, in each phase separately or together, against the background of all detected proteins, and no terms were significant below the corrected P value (FDR q-value) 0.05 cutoff. Phase 0 is set as the peak of PER2::LUC. (G) Phase distribution of proteins rhythmic (with RAIN threshold of P < 0.05) in their total abundance and in their synthesis. Phase 0 is set as the peak of PER2::LUC. Data information: In (B), data are presented as mean ± SEM. ****P < 0.0001. Source data are available online for this figure.CC BY · PubMed Central
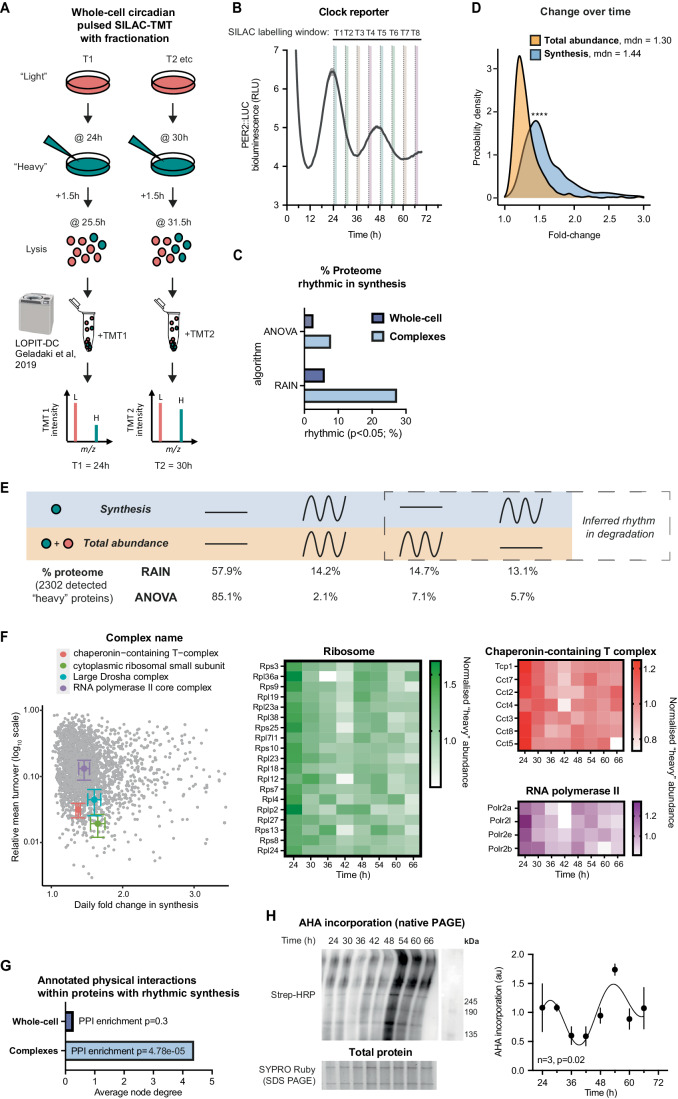
Figure 3 Targeted analysis of circadian complex biogenesis, abundance, and turnover by fractionated pulsed-SILAC mass spectrometry. (A) Schematic of circadian pulsed SILAC-TMT with extra fractionation step. In a set of entrained fibroblasts, at each circadian timepoint “light” media (DMEM with standard L-Arg and L-Lys) is switched for “heavy” (DMEM with 13C615N4 L-Arg and 13C615N2 L-Lys), and cells collected after 1.5 h. Samples were then subjected to sequential ultracentrifugation, a method adjusted from Geladaki et al, 2019 LOPIT-DC protocol. The fraction enriched for macromolecular protein complexes (MMC fraction) was labelled with tandem mass tags (TMT), mixed and analysed by mass spectrometry. N = 2 replicate cell cultures per timepoint. (B) Parallel bioluminescence recording of PER2::LUC, acting as phase marker, overlayed with SILAC labelling windows that were used for the timecourse. Normalised mean ± SEM are shown as line and shading, respectively. n = 4 replicate cell cultures. (C) Comparison of percentage of detected proteins that are considered rhythmic (P < 0.05) in their synthesis by the two algorithms used, between the whole-cell pSILAC experiment, presented in Fig. 2, and the experiment focused on complexes, presented in this figure. (D) Probability density distribution of fold change between peak and trough for proteins rhythmic in synthesis and in total abundance, representing the extent of change over time in these two sets. Statistics: Mann–Whitney test. (E) Comparison of rhythmicity between individual proteins’ synthesis and total abundance. Statistically, significant change over time was assessed by two algorithms, RAIN and ANOVA, with P < 0.05 taken as rhythmicity threshold. Percentages of detected proteins falling under the four rhythmicity categories by the two algorithms are displayed. Overall, 6577 proteins were detected; out of those at least one heavy peptide was detected for 2302 proteins (the set used for the analysis). (F) Coordinated turnover of proteins belonging to complexes: for four selected complexes, their detected annotated subunits (according to a compilation of CORUM, COMPLEAT and manual annotations) were averaged in terms of their fold change over time (x axis), and relative turnover (proportion of heavy to total peptide intensity averaged across 8 timepoints, y axis). Chaperonin-containing T-complex, n = 7; cytoplasmic ribosomal small subunit, n = 17; large Drosha complex, n = 14; RNA polymerase II complex, n = 5. All proteins are displayed in the background in grey. The normalised heavy abundance of these proteins over time, representing new synthesis, is shown on heatmaps on the right. (G) Proteins rhythmic (RAIN P < 0.05) in their synthesis were analysed using STRING interaction database, filtering for high-confidence, physical interactions. Proteins with rhythmic synthesis in the complex fraction had an interconnected protein–protein interaction network, with high average node degree and significant enrichment in interactions over all detected proteins in that experiment, whereas for proteins with rhythmic synthesis in the whole-cell experiment (Fig. 2) this was not the case. (H) Fibroblasts were pulsed with AHA for 1.5 h at the indicated timepoints, and AHA incorporation into protein complexes and other higher molecular weight species was measured, using biotin as click substrate and streptavidin-HRP for detection after non-denaturing gel electrophoresis (left, top). Signal was quantified (right) after normalisation to total protein content as measured by SYPRO Ruby on a parallel SDS-PAGE gel (left, bottom). Statistics: damped cosine wave fit (plotted) preferred over straight line, extra sum-of-squares F test P value displayed. n = 3 replicate cell cultures. Data information: In (B, H), data are presented as mean ± SEM of replicate cell cultures. In (F), data are presented as mean ± SEM of values for members of each indicated complex. *P ≤ 0.05, ****P < 0.0001. Source data are available online for this figure.
Figure 3 Targeted analysis of circadian complex biogenesis, abundance, and turnover by fractionated pulsed-SILAC mass spectrometry. (A) Schematic of circadian pulsed SILAC-TMT with extra fractionation step. In a set of entrained fibroblasts, at each circadian timepoint “light” media (DMEM with standard L-Arg and L-Lys) is switched for “heavy” (DMEM with 13C615N4 L-Arg and 13C615N2 L-Lys), and cells collected after 1.5 h. Samples were then subjected to sequential ultracentrifugation, a method adjusted from Geladaki et al, 2019 LOPIT-DC protocol. The fraction enriched for macromolecular protein complexes (MMC fraction) was labelled with tandem mass tags (TMT), mixed and analysed by mass spectrometry. N = 2 replicate cell cultures per timepoint. (B) Parallel bioluminescence recording of PER2::LUC, acting as phase marker, overlayed with SILAC labelling windows that were used for the timecourse. Normalised mean ± SEM are shown as line and shading, respectively. n = 4 replicate cell cultures. (C) Comparison of percentage of detected proteins that are considered rhythmic (P < 0.05) in their synthesis by the two algorithms used, between the whole-cell pSILAC experiment, presented in Fig. 2, and the experiment focused on complexes, presented in this figure. (D) Probability density distribution of fold change between peak and trough for proteins rhythmic in synthesis and in total abundance, representing the extent of change over time in these two sets. Statistics: Mann–Whitney test. (E) Comparison of rhythmicity between individual proteins’ synthesis and total abundance. Statistically, significant change over time was assessed by two algorithms, RAIN and ANOVA, with P < 0.05 taken as rhythmicity threshold. Percentages of detected proteins falling under the four rhythmicity categories by the two algorithms are displayed. Overall, 6577 proteins were detected; out of those at least one heavy peptide was detected for 2302 proteins (the set used for the analysis). (F) Coordinated turnover of proteins belonging to complexes: for four selected complexes, their detected annotated subunits (according to a compilation of CORUM, COMPLEAT and manual annotations) were averaged in terms of their fold change over time (x axis), and relative turnover (proportion of heavy to total peptide intensity averaged across 8 timepoints, y axis). Chaperonin-containing T-complex, n = 7; cytoplasmic ribosomal small subunit, n = 17; large Drosha complex, n = 14; RNA polymerase II complex, n = 5. All proteins are displayed in the background in grey. The normalised heavy abundance of these proteins over time, representing new synthesis, is shown on heatmaps on the right. (G) Proteins rhythmic (RAIN P < 0.05) in their synthesis were analysed using STRING interaction database, filtering for high-confidence, physical interactions. Proteins with rhythmic synthesis in the complex fraction had an interconnected protein–protein interaction network, with high average node degree and significant enrichment in interactions over all detected proteins in that experiment, whereas for proteins with rhythmic synthesis in the whole-cell experiment (Fig. 2) this was not the case. (H) Fibroblasts were pulsed with AHA for 1.5 h at the indicated timepoints, and AHA incorporation into protein complexes and other higher molecular weight species was measured, using biotin as click substrate and streptavidin-HRP for detection after non-denaturing gel electrophoresis (left, top). Signal was quantified (right) after normalisation to total protein content as measured by SYPRO Ruby on a parallel SDS-PAGE gel (left, bottom). Statistics: damped cosine wave fit (plotted) preferred over straight line, extra sum-of-squares F test P value displayed. n = 3 replicate cell cultures. Data information: In (B, H), data are presented as mean ± SEM of replicate cell cultures. In (F), data are presented as mean ± SEM of values for members of each indicated complex. *P ≤ 0.05, ****P < 0.0001. Source data are available online for this figure.CC BY · PubMed Central
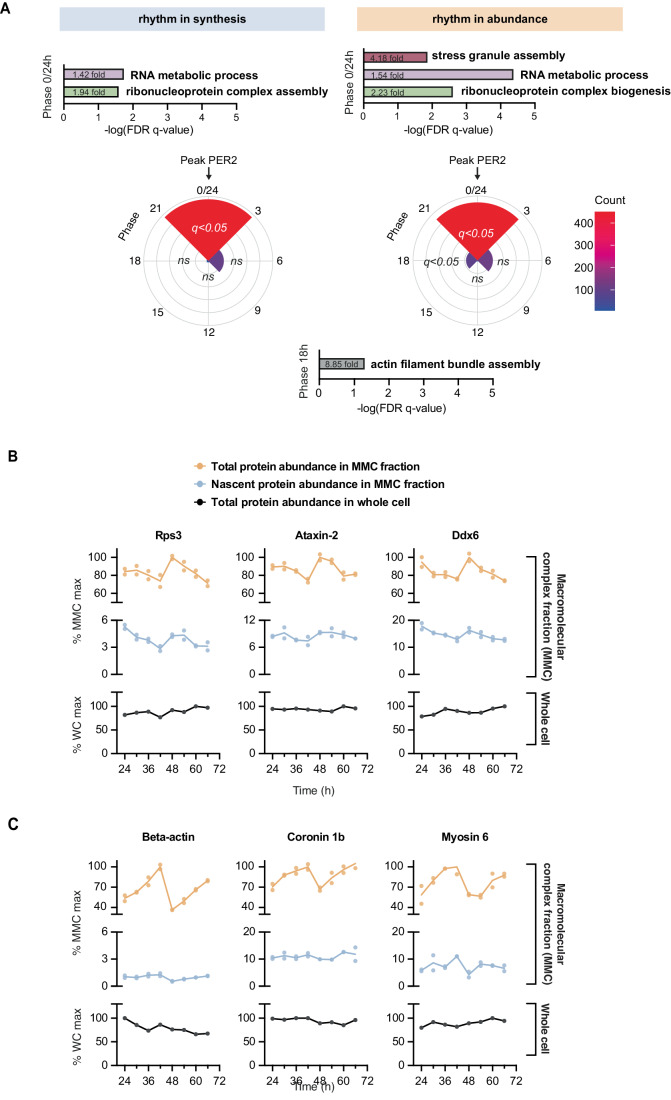
Figure 4 Functional analysis of circadian complex assembly in cultured fibroblasts. (A) Phase distribution of proteins rhythmic (RAIN P < 0.05) in their total abundance and in their synthesis in the MMC fraction. Gene ontology functional enrichment for biological processes was performed using the GOrilla tool, with proteins at each phase compared against all detected proteins in this experiment, and FDR q-value (multiple comparisons adjusted P value) threshold of 0.05. For phase “0/24”, top significant non-overlapping terms are presented, alongside their significance and fold-enrichment values. In phase “18”, terms associated with actin were enriched (q < 0.05), e.g., “actin filament bundle assembly” (8.85-fold enrichment). (B) Example proteins peaking at phase “0/24”, belonging to terms associated with ribonucleoprotein complex assembly and stress granule assembly. Total protein abundance (top) and nascent protein synthesis (middle) in the MMC fraction and total protein abundance at whole-cell level (bottom) is shown for each replicate, with line joining the mean at each timepoint. (C) As for (B), example proteins peaking at phase “18”, associated with actin assembly. Source data are available online for this figure.
Figure 4 Functional analysis of circadian complex assembly in cultured fibroblasts. (A) Phase distribution of proteins rhythmic (RAIN P < 0.05) in their total abundance and in their synthesis in the MMC fraction. Gene ontology functional enrichment for biological processes was performed using the GOrilla tool, with proteins at each phase compared against all detected proteins in this experiment, and FDR q-value (multiple comparisons adjusted P value) threshold of 0.05. For phase “0/24”, top significant non-overlapping terms are presented, alongside their significance and fold-enrichment values. In phase “18”, terms associated with actin were enriched (q < 0.05), e.g., “actin filament bundle assembly” (8.85-fold enrichment). (B) Example proteins peaking at phase “0/24”, belonging to terms associated with ribonucleoprotein complex assembly and stress granule assembly. Total protein abundance (top) and nascent protein synthesis (middle) in the MMC fraction and total protein abundance at whole-cell level (bottom) is shown for each replicate, with line joining the mean at each timepoint. (C) As for (B), example proteins peaking at phase “18”, associated with actin assembly. Source data are available online for this figure.CC BY · PubMed Central
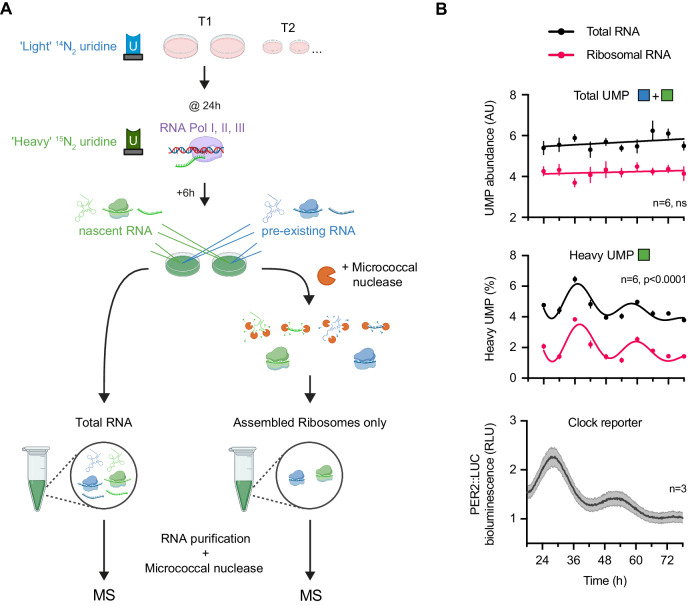
Figure 5 Validation of circadian ribosome assembly in cultured fibroblasts by Edmondson assay. (A) Schematic of Edmondson assay for nascent rRNA labelling. In a set of entrained fibroblasts, at each circadian timepoint, 200 μM of heavy (15N2)-uridine was spiked into media for 6 h to metabolically label all nascent RNA prior to collecting cells. Total RNA or rRNA derived from assembled ribosomal complexes was extracted from cell pellets before RNA purification and treatment with micrococcal nuclease to completely digest RNA to free nucleotide monophosphates. The abundance of heavy, 15N2, and light, 14N2, uridine monophosphate (UMP) was subsequently quantified by mass spectrometry. (B) Circadian regulation of ribosome turnover detected by Edmondson assay. (Top) Total UMP abundance (heavy + light) for total RNA and rRNA from assembled ribosomes across time. (Middle) Proportion of heavy UMP for total RNA and rRNA from assembled ribosomes, expressed as a percentage of total cellular UMP and UMP that was incorporated within assembled ribosomes, respectively, across time. Heavy UMP reports RNA synthesised in the preceding 6 h. Note that heavy UMP was first corrected for its natural abundance detected in unlabelled fibroblasts. (Bottom) Parallel PER2::LUC bioluminescence recording, conducted under the same experimental conditions as the MS timecourse. Statistics: damped cosine wave fit compared with straight line (null hypothesis) by extra sum-of-squares F test, the statistically preferred fit is plotted and P value displayed. n = 6 (for UMP, top and middle) or 3 (for bioluminescence, bottom) replicate cell cultures. Data information: Data are presented as mean ± SEM of replicate cell cultures. Source data are available online for this figure.
Figure 5 Validation of circadian ribosome assembly in cultured fibroblasts by Edmondson assay. (A) Schematic of Edmondson assay for nascent rRNA labelling. In a set of entrained fibroblasts, at each circadian timepoint, 200 μM of heavy (15N2)-uridine was spiked into media for 6 h to metabolically label all nascent RNA prior to collecting cells. Total RNA or rRNA derived from assembled ribosomal complexes was extracted from cell pellets before RNA purification and treatment with micrococcal nuclease to completely digest RNA to free nucleotide monophosphates. The abundance of heavy, 15N2, and light, 14N2, uridine monophosphate (UMP) was subsequently quantified by mass spectrometry. (B) Circadian regulation of ribosome turnover detected by Edmondson assay. (Top) Total UMP abundance (heavy + light) for total RNA and rRNA from assembled ribosomes across time. (Middle) Proportion of heavy UMP for total RNA and rRNA from assembled ribosomes, expressed as a percentage of total cellular UMP and UMP that was incorporated within assembled ribosomes, respectively, across time. Heavy UMP reports RNA synthesised in the preceding 6 h. Note that heavy UMP was first corrected for its natural abundance detected in unlabelled fibroblasts. (Bottom) Parallel PER2::LUC bioluminescence recording, conducted under the same experimental conditions as the MS timecourse. Statistics: damped cosine wave fit compared with straight line (null hypothesis) by extra sum-of-squares F test, the statistically preferred fit is plotted and P value displayed. n = 6 (for UMP, top and middle) or 3 (for bioluminescence, bottom) replicate cell cultures. Data information: Data are presented as mean ± SEM of replicate cell cultures. Source data are available online for this figure.CC BY · PubMed Central
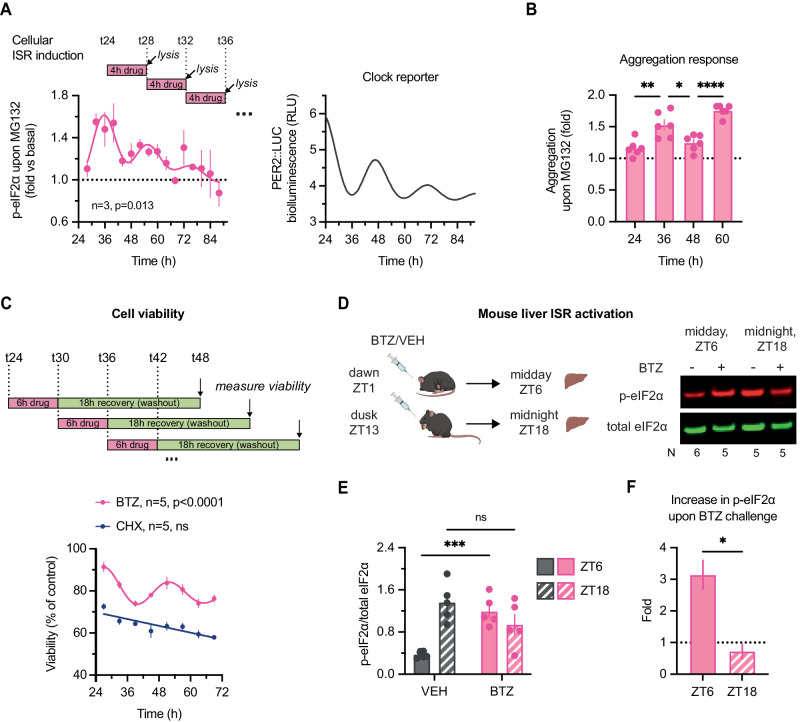
Figure 6 Consequences of circadian regulation of protein homeostasis in culture and in vivo. (A) (Left) Two sets of fibroblast lysates were collected every 4 h for 3 days, one untreated control and one treated with 20 µM MG132 proteasomal inhibitor for 4 h before each collection. Fold-change increase in relative phosphorylation of eIF2α (i.e., (p-eIF2α/total)MG132/(p-eIF2α/total)control) at each timepoint is plotted. MG132 is expected to induce increase in phosphorylation of eIF2α but the extent of the induction differs. Statistics: damped cosine wave fit (plotted) preferred over straight line, extra sum-of-squares F test P value displayed. (Right) Parallel PER2::LUC bioluminescence recording, conducted under the same experimental and timecourse conditions as experiments in (A–C). (B) Cells were treated with 20 µM MG132 for 24 h starting at indicated timepoints, and aggregation relative to untreated samples measured by Proteastat aggresome kit. MG132 is expected to induce aggregation but the extent of the induction differs. Statistics: One-way ANOVA P < 0.0001; Dunnett’s multiple comparison of neighbouring timepoints displayed on graph. The difference between T24 & T48 as well as between T36 & T60 was not statistically significant. n = 6 replicate cell cultures. (C) At eight timepoints throughout 2 days, fibroblasts were treated with 2.5 µM proteasomal inhibitor bortezomib (BTZ), 25 µM translation inhibitor cycloheximide (CHX), or vehicle control; after 6 h, the drugs were washed out, allowing cells to recover for further 18 h. Cellular viability after the treatments, as measured by PrestoBlue High Sensitivity assay, is expressed as a proportion of control (vehicle-treated) cells at each timepoint. Statistics: damped cosine wave fit compared with straight line (null hypothesis) by extra sum-of-squares F test, the statistically preferred fit is plotted & P value displayed. (D) Time-of-day bortezomib (BTZ) effect in vivo: mice received an i.p. injection of BTZ or vehicle control (VEH) at ZT1 or ZT13, and livers were harvested 5 h after the treatment. Representative Western blot is shown, blots, probed for total (green) and S51-phopshorylated (red) eIF2α. (E) Quantification of relative phosphorylation levels of eIF2α from experiment in (D). Statistics: two-way ANOVA, treatment × time interaction P = 0.0003; Sidak’s multiple comparisons test between timepoints for each treatment is displayed. N = 24 mice, 5–6 mice/group. (F) Fold-change increase in phosphorylation of eIF2α upon bortezomib injection at each timepoint, quantified from (E) as the ratio of average p-eIF2α levels. Statistics: unpaired t test. N = 24 mice, 5–6 mice/group. Data information: In (A–C), data are presented as mean ± SEM of replicate cell cultures. In (E, F), data are presented as mean ± SEM of individual mice. *P ≤ 0.05, **P < 0.01, ****P < 0.0001. Source data are available online for this figure.
Figure 6 Consequences of circadian regulation of protein homeostasis in culture and in vivo. (A) (Left) Two sets of fibroblast lysates were collected every 4 h for 3 days, one untreated control and one treated with 20 µM MG132 proteasomal inhibitor for 4 h before each collection. Fold-change increase in relative phosphorylation of eIF2α (i.e., (p-eIF2α/total)MG132/(p-eIF2α/total)control) at each timepoint is plotted. MG132 is expected to induce increase in phosphorylation of eIF2α but the extent of the induction differs. Statistics: damped cosine wave fit (plotted) preferred over straight line, extra sum-of-squares F test P value displayed. (Right) Parallel PER2::LUC bioluminescence recording, conducted under the same experimental and timecourse conditions as experiments in (A–C). (B) Cells were treated with 20 µM MG132 for 24 h starting at indicated timepoints, and aggregation relative to untreated samples measured by Proteastat aggresome kit. MG132 is expected to induce aggregation but the extent of the induction differs. Statistics: One-way ANOVA P < 0.0001; Dunnett’s multiple comparison of neighbouring timepoints displayed on graph. The difference between T24 & T48 as well as between T36 & T60 was not statistically significant. n = 6 replicate cell cultures. (C) At eight timepoints throughout 2 days, fibroblasts were treated with 2.5 µM proteasomal inhibitor bortezomib (BTZ), 25 µM translation inhibitor cycloheximide (CHX), or vehicle control; after 6 h, the drugs were washed out, allowing cells to recover for further 18 h. Cellular viability after the treatments, as measured by PrestoBlue High Sensitivity assay, is expressed as a proportion of control (vehicle-treated) cells at each timepoint. Statistics: damped cosine wave fit compared with straight line (null hypothesis) by extra sum-of-squares F test, the statistically preferred fit is plotted & P value displayed. (D) Time-of-day bortezomib (BTZ) effect in vivo: mice received an i.p. injection of BTZ or vehicle control (VEH) at ZT1 or ZT13, and livers were harvested 5 h after the treatment. Representative Western blot is shown, blots, probed for total (green) and S51-phopshorylated (red) eIF2α. (E) Quantification of relative phosphorylation levels of eIF2α from experiment in (D). Statistics: two-way ANOVA, treatment × time interaction P = 0.0003; Sidak’s multiple comparisons test between timepoints for each treatment is displayed. N = 24 mice, 5–6 mice/group. (F) Fold-change increase in phosphorylation of eIF2α upon bortezomib injection at each timepoint, quantified from (E) as the ratio of average p-eIF2α levels. Statistics: unpaired t test. N = 24 mice, 5–6 mice/group. Data information: In (A–C), data are presented as mean ± SEM of replicate cell cultures. In (E, F), data are presented as mean ± SEM of individual mice. *P ≤ 0.05, **P < 0.01, ****P < 0.0001. Source data are available online for this figure.CC BY · PubMed Central

Verification

Claims the paper makes

The claims and statistics of this paper haven’t been checked yet.

Run the check — free, no account needed. It reads the open-access text and checks the sources it cites.

A few free checks a day · papers already verified open instantly · results are public

Self-check

Percentages, sums and reported differences re-computed from the paper’s own numbers.

The self-check needs the paper’s full text.

Citations

Cites

Research works printed but not linked: 118

  1. Abramoff M (2007) ImageJ as an Image Processing Tool and Library. Microscopy and Microanalysis 13 · DOI
  2. 2019, Interactions of the super complexes: When mTORC1 meets the proteasome, The International Journal of Biochemistry & Cell Biology, 117, 105638, 10.1016/j.biocel.2019.105638 · DOI
  3. 2019, Cellular Responses to Proteasome Inhibition: Molecular Mechanisms and Beyond, International Journal of Molecular Sciences, 20, 3379, 10.3390/ijms20143379 · DOI
  4. 10.1016/j.jmb.2019.06.001 · DOI
  5. 2015, Genetics of Circadian Rhythms, Sleep Medicine Clinics, 10, 413, 10.1016/j.jsmc.2015.08.007 · DOI
  6. 10.1073/pnas.1515308112 · DOI
  7. Atger F , Mauvoisin D , Weger B , Gobet C & Gachon F (2017) Regulation of Mammalian Physiology by Interconnected Circadian and Feeding Rhythms. Frontiers in Endocrinology 8 · DOI
  8. 10.1016/S0092-8674(00)81199-X · DOI · Paper page
  9. Beale AD , Hayter EA , Crosby P , Valekunja UK , Edgar RS , Chesham JE , Maywood ES , Labeed FH , Reddy AB , Wright KP , et al (2023a) Mechanisms and physiological function of daily haemoglobin oxidation rhythms in red blood cells. EMBO J: e114164 · DOI
  10. Beale AD , Rzechorzek NM , Mihut A , Zeng A , Smyllie NJ , Pilorz V , Richardson R , Bertlesen MF , James NR , Fazal SV , et al (2023b) Thermosensitivity of translation underlies the mammalian nocturnal-diurnal switch. bioRxiv: 2023.06.22.546020 · DOI
  11. 10.1016/j.ceb.2017.02.012 · DOI
  12. 10.1016/0022-2836(67)90297-5 · DOI
  13. 10.1016/j.sleep.2013.10.016 · DOI · Paper page
  14. 2014, Comparison of PrestoBlue and MTT assays of cellular viability in the assessment of anti-proliferative effects of plant extracts on human endothelial cells, Journal of Pharmacological and Toxicological Methods, 69, 9, 10.1016/j.vascn.2013.09.003 · DOI
  15. Brooks TG , Manjrekar A , Mrčela A & Grant GR (2023) Meta-analysis of Diurnal Transcriptomics in Mouse Liver Reveals Low Repeatability of Rhythm Analyses. J Biol Rhythm: 7487304231179600 · DOI
  16. 10.1016/j.molcel.2009.11.020 · DOI
  17. 10.1126/science.1195262 · DOI · Paper page
  18. 10.1042/bj3120163 · DOI
  19. 2021, Hepatic mTORC1 signaling activates ATF4 as part of its metabolic response to feeding and insulin, Mol Metab, 53, 101309, 10.1016/j.molmet.2021.101309 · DOI · Paper page
  20. Cao R (2018) mTOR Signaling, Translational Control, and the Circadian Clock. Frontiers in Genetics 9 · DOI
  21. 2019, Medicine in the Fourth Dimension, Cell Metabolism, 30, 238, 10.1016/j.cmet.2019.06.019 · DOI
  22. 10.1038/Nbt.1511 · DOI · Paper page
  23. 10.1530/JME-19-0153 · DOI
  24. 10.1016/j.cell.2019.02.017 · DOI · Paper page
  25. Crosby P , Hoyle NP & O’Neill JS (2017) Flexible Measurement of Bioluminescent Reporters Using an Automated Longitudinal Luciferase Imaging Gas- and Temperature-optimized Recorder (ALLIGATOR). J Vis Exp · DOI
  26. 10.1093/cvr/cvp255 · DOI
  27. 10.1016/J.CELL.2018.05.042 · DOI
  28. Deshaies RJ (2014) Proteotoxic crisis, the ubiquitin-proteasome system, and cancer therapy. BMC Biology 12 · DOI
  29. 2016, Circadian modulation of proteasome activity and accumulation of oxidized protein in human embryonic kidney HEK 293 cells and primary dermal fibroblasts, Free Radical Biology and Medicine, 94, 195, 10.1016/j.freeradbiomed.2016.02.037 · DOI
  30. 10.1146/annurev-physiol-021909-135821 · DOI · Paper page
  31. 10.1073/pnas.0601637103 · DOI · Paper page
  32. 10.1074/jbc.M808840200 · DOI
  33. 10.1021/pr800641v · DOI · Paper page
  34. Eden E , Navon R , Steinfeld I , Lipson D & Yakhini Z (2009) GOrilla: a tool for discovery and visualization of enriched GO terms in ranked gene lists. BMC Bioinformatics 10 · DOI · Paper page
  35. 10.1038/nature17407 · DOI
  36. 10.1177/0748730416668898 · DOI
  37. 2014, Co-translational mechanisms of quality control of newly synthesized polypeptides, Translation, 2, e28109, 10.4161/trla.28109 · DOI
  38. Geladaki A , Britovšek NK , Breckels LM , Smith TS , Vennard OL , Mulvey CM , Crook OM , Gatto L & Lilley KS (2019) Combining LOPIT with differential ultracentrifugation for high-resolution spatial proteomics. Nature Communications 10 · DOI
  39. 10.1016/j.cell.2012.12.027 · DOI · Paper page
  40. 10.1093/nar/gky973 · DOI · Paper page
  41. 2021, Data-independent acquisition method for ubiquitinome analysis reveals regulation of circadian biology, Nat Commun, 12, 254, 10.1038/s41467-020-20509-1 · DOI
  42. 10.1038/nature19947 · DOI
  43. 10.1038/s41580-019-0101-y · DOI · Paper page
  44. 10.1126/scitranslmed.aal2774 · DOI
  45. 10.1177/0748730417728663 · DOI
  46. 10.1101/gr.191296.115 · DOI
  47. 10.1101/gr.195404.115 · DOI
  48. 10.1074/jbc.M413660200 · DOI
  49. 10.1371/journal.pbio.1001455 · DOI
  50. 10.1016/j.molcel.2018.07.001 · DOI · Paper page
  51. 10.1073/pnas.1918459117 · DOI
  52. 2021, Deep-coverage spatiotemporal proteome of the picoeukaryote Ostreococcus tauri reveals differential effects of environmental and endogenous 24-hour rhythms, Commun Biology, 4, 1147, 10.1038/s42003-021-02680-3 · DOI
  53. 10.1073/pnas.2012450117 · DOI
  54. 10.1016/j.molcel.2019.11.010 · DOI
  55. 10.1146/annurev-biochem-060614-033955 · DOI · Paper page
  56. 10.1371/journal.pone.0051968 · DOI
  57. 10.1038/nature09486 · DOI · Paper page
  58. 2019, Association between circadian rhythms and neurodegenerative diseases, The Lancet Neurology, 18, 307, 10.1016/S1474-4422(18)30461-7 · DOI
  59. 2017, Aberrant Proteostasis of BMAL1 Underlies Circadian Abnormalities in a Paradigmatic mTOR-opathy, Cell Reports, 20, 868, 10.1016/j.celrep.2017.07.008 · DOI
  60. 10.1016/j.cell.2015.04.002 · DOI
  61. 2017, Time-Resolved Proteomics Extends Ribosome Profiling-Based Measurements of Protein Synthesis Dynamics, Cell Systems, 4, 636, 10.1016/j.cels.2017.05.001 · DOI
  62. 10.1038/emboj.2011.322 · DOI · Paper page
  63. 2018, Proteomics and pulse azidohomoalanine labeling of newly synthesized proteins: what are the potential applications?, Expert Rev Proteom, 15, 545, 10.1080/14789450.2018.1500902 · DOI
  64. Malcolm M , Saad L , Penazzi LG & Garbarino-Pico E (2019) Processing Bodies Oscillate in Neuro 2A Cells. Frontiers in Cellular Neuroscience 13 · DOI
  65. 2017, Proteasome inhibitors in cancer therapy, Nature Reviews Clinical Oncology, 14, 417, 10.1038/nrclinonc.2016.206 · DOI · Paper page
  66. 2019, Dynamic Regulation of the 26S Proteasome: From Synthesis to Degradation, Front Mol Biosci, 6, 40, 10.3389/fmolb.2019.00040 · DOI
  67. 10.1038/s41467-018-02974-x · DOI · Paper page
  68. 2020, Proteomics in Circadian Biology, J Mol Biol, 432, 3565, 10.1016/j.jmb.2019.12.004 · DOI
  69. 10.1073/pnas.1314066111 · DOI · Paper page
  70. 2021, Genome-wide circadian rhythm detection methods: systematic evaluations and practical guidelines, Brief Bioinform, 22, bbaa135, 10.1093/bib/bbaa135 · DOI
  71. 2018, Circadian Rest-Activity Pattern Changes in Aging and Preclinical Alzheimer Disease, JAMA Neurology, 75, 582, 10.1001/jamaneurol.2017.4719 · DOI · Paper page
  72. 2020, Eukaryotic cell biology is temporally coordinated to support the energetic demands of protein homeostasis, Nat Commun, 11, 4706, 10.1038/s41467-020-18330-x · DOI
  73. 2002, Stable Isotope Labeling by Amino Acids in Cell Culture, SILAC, as a Simple and Accurate Approach to Expression Proteomics, Molecular & Cellular Proteomics, 1, 376, 10.1074/mcp.M200025-MCP200 · DOI · Paper page
  74. Ori A , Iskar M , Buczak K , Kastritis P , Parca L , Andrés-Pons A , Singer S , Bork P & Beck M (2016) Spatiotemporal variation of mammalian protein complex stoichiometries. Genome Biology 17 · DOI
  75. 10.3389/fgene.2015.00002 · DOI
  76. 10.1016/j.neuron.2019.08.007 · DOI
  77. 10.1073/pnas.1006551107 · DOI · Paper page
  78. 2018, Mammalian Circadian Period, But Not Phase and Amplitude, Is Robust Against Redox and Metabolic Perturbations, Antioxid Redox Sign, 28, 507, 10.1089/ars.2016.6911 · DOI
  79. 10.1371/journal.pgen.1007369 · DOI
  80. 10.1038/nbt.4096 · DOI · Paper page
  81. Ravi V , Jain A , Ahamed F , Fathma N , Desingu PA & Sundaresan NR (2018) Systematic evaluation of the adaptability of the non-radioactive SUnSET assay to measure cardiac protein synthesis. Scientific Reports 8 · DOI
  82. Ravi V , Jain A , Mishra S & Sundaresan NR (2020) Measuring Protein Synthesis in Cultured Cells and Mouse Tissues Using the Non-radioactive SUnSET Assay. Current Protocols in Molecular Biology 133 · DOI
  83. 10.1016/j.cub.2006.04.026 · DOI · Paper page
  84. 10.1016/j.yexcr.2017.06.012 · DOI
  85. Riggs CL , Kedersha N , Ivanov P & Anderson P (2020) Mammalian stress granules and P bodies at a glance. Journal of Cell Science 133 · DOI
  86. 2014, In-Vivo Quantitative Proteomics Reveals a Key Contribution of Post-Transcriptional Mechanisms to the Circadian Regulation of Liver Metabolism, PLoS Genetics, 10, e1004047, 10.1371/journal.pgen.1004047 · DOI · Paper page
  87. 2021, Proteome Turnover in the Spotlight: Approaches, Applications, and Perspectives, Molecular & Cellular Proteomics, 20, 100016, 10.1074/mcp.R120.002190 · DOI
  88. 2019, Diurnal Rhythms Spatially and Temporally Organize Autophagy, Cell Reports, 26, 1880, 10.1016/j.celrep.2019.01.072 · DOI
  89. 2015, Hypothermic Preconditioning of Human Cortical Neurons Requires Proteostatic Priming, EBioMedicine, 2, 528, 10.1016/j.ebiom.2015.04.004 · DOI
  90. 2020, Mechanisms of sensing and response to proteotoxic stress, Experimental Cell Research, 395, 112240, 10.1016/j.yexcr.2020.112240 · DOI
  91. 10.1038/nmeth.2019) · DOI · Paper page
  92. 2009, SUnSET, a nonradioactive method to monitor protein synthesis, Nature Methods, 6, 275, 10.1038/nmeth.1314 · DOI · Paper page
  93. 10.1038/35008096 · DOI
  94. Seluanov A , Vaidya A & Gorbunova V (2010) Establishing Primary Adult Fibroblast Cultures From Rodents. J Vis Exp · DOI
  95. 10.1007/s12013-010-9138-4 · DOI
  96. 10.1016/j.cell.2017.04.015 · DOI
  97. 10.1016/0003-2697(85)90442-7 · DOI · Paper page
  98. 2021, Understanding circadian regulation of mammalian cell function, protein homeostasis, and metabolism, Curr Opin Syst Biology, 28, 100391, 10.1016/j.coisb.2021.100391 · DOI
  99. 10.1038/s41467-021-25942-4 · DOI
  100. 10.4161/auto.2731 · DOI
  101. 10.1093/nar/gkaa1074 · DOI · Paper page
  102. 2020, Keeping the Proportions of Protein Complex Components in Check, Cell Systems, 10, 125, 10.1016/j.cels.2020.01.004 · DOI
  103. 10.1177/0748730414553029 · DOI
  104. 2019, Molecular logic of mTORC1 signalling as a metabolic rheostat, Nat Metab, 1, 321, 10.1038/s42255-019-0038-7 · DOI
  105. Vinayagam A , Hu Y , Kulkarni M , Roesel C , Sopko R , Mohr SE & Perrimon N (2013) Protein Complex–Based Analysis Framework for High-Throughput Data Sets. Science Signaling 6 · DOI
  106. Wagner PM , Prucca CG , Velazquez FN , Alderete LGS , Caputto BL & Guido ME (2021) Temporal regulation of tumor growth in nocturnal mammals: In vivo studies and chemotherapeutical potential. The FASEB Journal 35 · DOI
  107. 10.1016/j.molcel.2013.03.009 · DOI
  108. Wang R , Jiang X , Bao P , Qin M & Xu J (2019) Circadian control of stress granules by oscillating EIF2α. Cell Death Dis 10 · DOI
  109. 10.1016/j.cub.2004.11.057 · DOI · Paper page
  110. 10.1016/0309-1651(80)90045-4 · DOI
  111. 10.1016/j.cell.2014.03.007 · DOI
  112. 2022, CRYPTOCHROMES promote daily protein homeostasis, Embo J, 41, e2021108883
  113. 2019, The Circadian Protein Period2 Suppresses mTORC1 Activity via Recruiting Tsc1 to mTORC1 Complex, Cell Metab, 29, 653, 10.1016/j.cmet.2018.11.006 · DOI
  114. 2015, Use of the viability reagent PrestoBlue in comparison with alamarBlue and MTT to assess the viability of human corneal epithelial cells, Journal of Pharmacological and Toxicological Methods, 71, 1, 10.1016/j.vascn.2014.11.003 · DOI
  115. 10.1073/pnas.0308709101 · DOI · Paper page
  116. 10.1073/pnas.1408886111 · DOI · Paper page
  117. 2020, Drug Development Targeting the Ubiquitin– Proteasome System (UPS) for the Treatment of Human Cancers, Cancers, 12, 902, 10.3390/cancers12040902 · DOI
  118. 2023, Circadian clocks are modulated by compartmentalized oscillating translation, Cell, 186, 3245, 10.1016/j.cell.2023.05.045 · DOI

Metadata

Authors
Seinkmane, E., Edmondson, A., Peak-Chew, S. Y., Zeng, A., Rzechorzek, N. M., James, N. R., West, J., Munns, J., Wong, D. C., Beale, A. D., & O’Neill, J. S.
Affiliations
  • MRC Laboratory of Molecular Biology (GB)
  • University of Cambridge (GB)
Corresponding author
Beale, Andrew D
Venue
The EMBO Journal
Publisher
openRxiv
Published
2022-09-30
Volume
43
Issue
13
Pages
2813-2833
ISSN
0261-4189 (ISSN-L)
OpenAlex
W4398209297
Cited by
24
References
1
Citations by year
2026: 9 · 2025: 7 · 2024: 5 · 2023: 3
FWCI
4.53
Type
journal article
Language
en
Open access
Licence
cc-by
Locations
  • The EMBO Journal (publishedVersion, cc-by)
  • bioRxiv (Cold Spring Harbor Laboratory) (acceptedVersion)
  • PubMed Central (publishedVersion, cc-by)
  • PubMed (publishedVersion)
  • Apollo (University of Cambridge) (submittedVersion, cc-by)
  • Edinburgh Research Explorer (University of Edinburgh) (submittedVersion, cc-by)
Funders
  • UK Research and Innovation (MR/S022023/1, MC_UP_1201/4)
  • Medical Research Council (MC_EX_MR/Y013018/1, MC_EX_MR/S022023/1, MR/S022023/1, MC_UP_1201/4)
Topics
  • Life Sciences › Neuroscience › Endocrine and Autonomic Systems › Circadian rhythm and melatonin
  • Life Sciences › Biochemistry, Genetics and Molecular Biology › Molecular Biology › Ubiquitin and proteasome pathways
  • Life Sciences › Biochemistry, Genetics and Molecular Biology › Aging › Genetics, Aging, and Longevity in Model Organisms
Keywords
circadian rhythm, proteostasis, protein synthesis, protein degradation, ribosome assembly, proteasomal degradation, proteotoxic stress, proteasome inhibitors, cancer, pulse labeling
MeSH terms
Proteostasis, Animals, Circadian Rhythm, Humans, Mice, Inbred C57BL, Ribosomes, Protein Biosynthesis, Proteome, Proteasome Endopeptidase Complex, Mice, Proteolysis

About these checks

Registry, retraction, Cites and statistics results are computed, not judged, with one exception: a printed reference that no index lists is read once by a model before it counts as a citation error. Claims are extracted by a model and kept only when their quote appears verbatim in the text; each cited source is then checked, with a model’s help, for whether it says what the claim relies on. Those verdicts can be wrong — read the claim’s quote and the cited source before relying on one.

Statistics and arithmetic are recomputed, not judged.

Confidence bands are shown only for fields calibrated on our annotated test set. None is calibrated yet, so no band is shown.

What counts as a claim ›How we measure confidence ›How we check this ›

Are you an author, or do you see a problem with this page? Request a review