

The DOI matches its Crossref record; 2 of the 2 references it cites were found in a registry or an index.
Rapid Adaptation of Cellular Metabolic Rate to the MicroRNA Complements of Mammals and its Relevance to the Evolution of Endothermy
Open accessPreprint — published as 10.1016/j.isci.2023.108740
Abstract
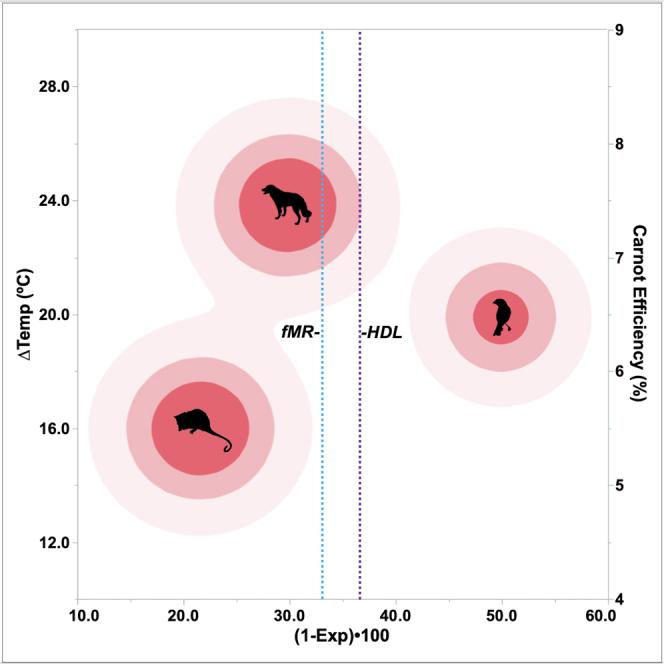
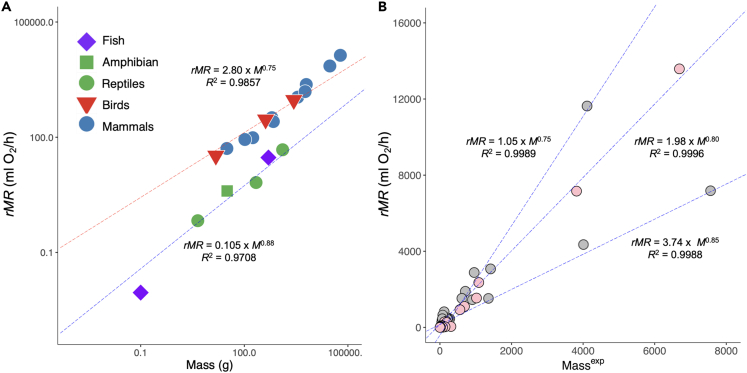
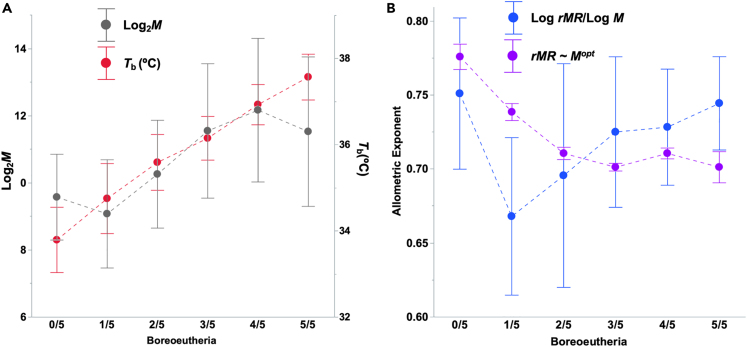
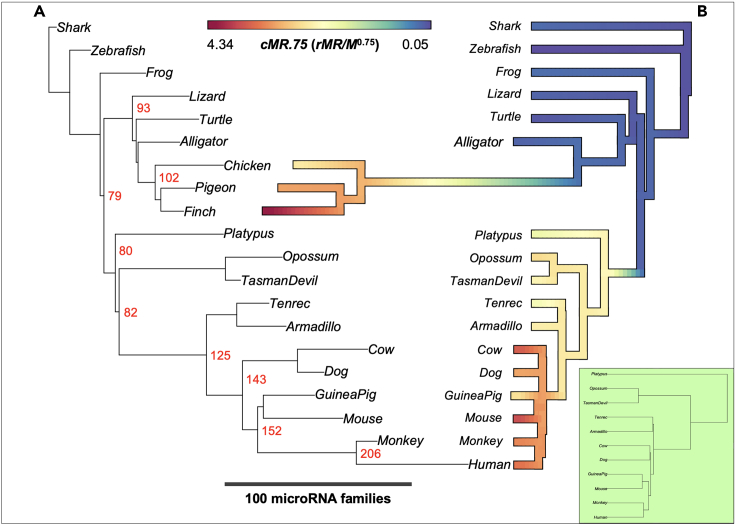
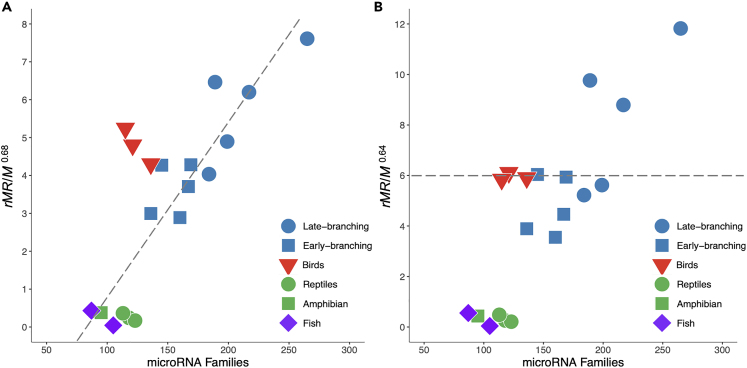
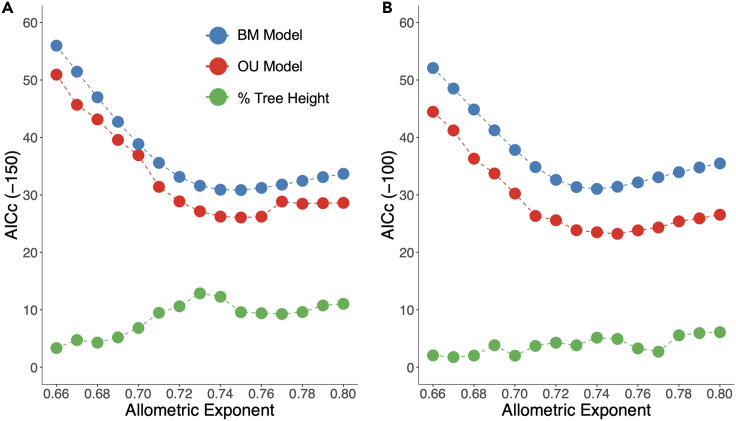
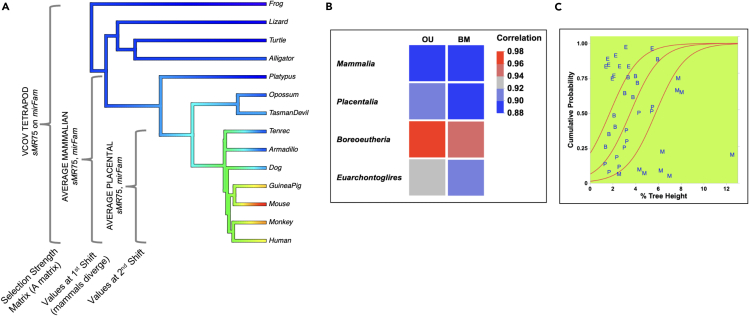
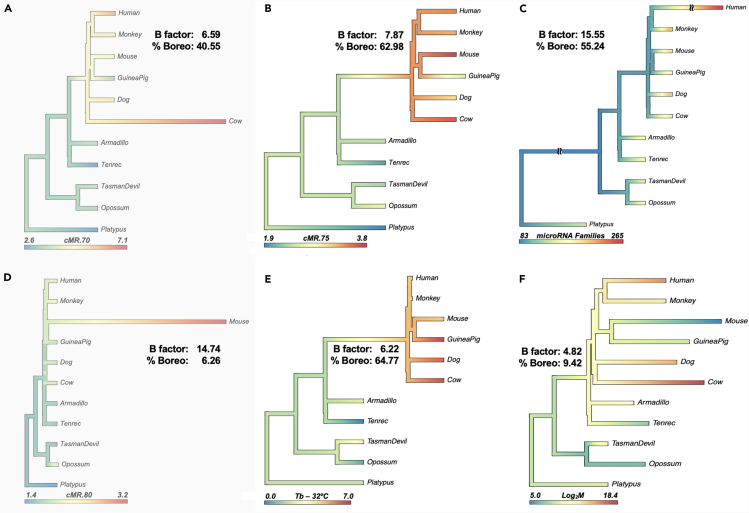
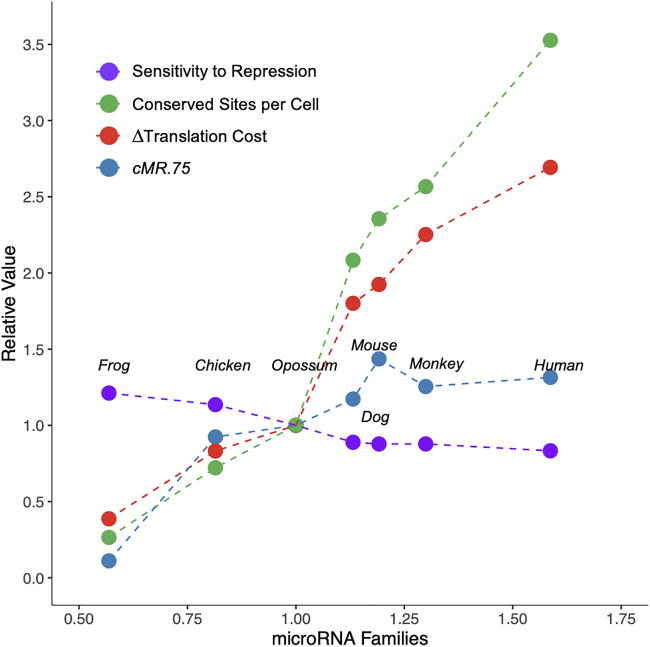
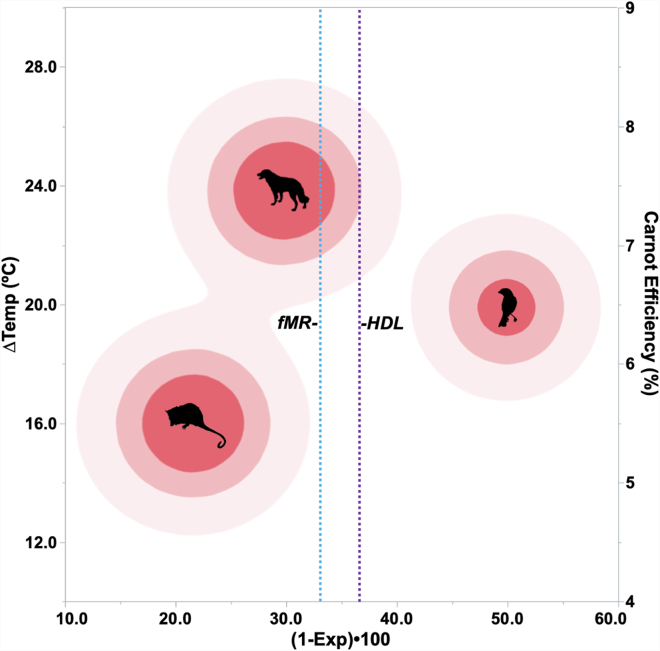
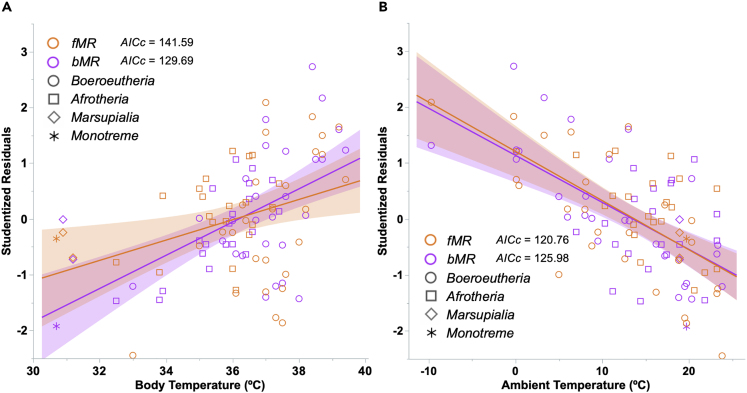
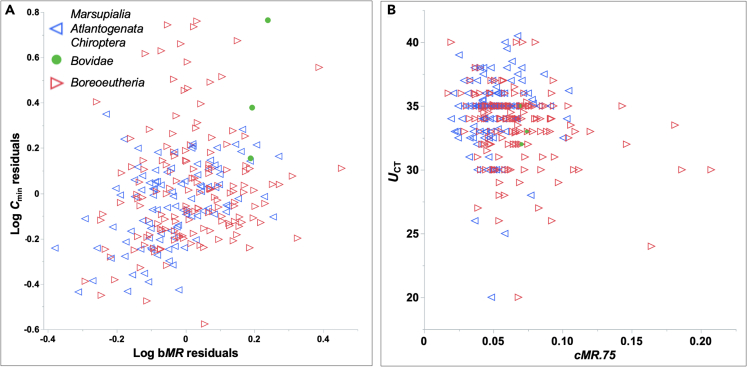
SUMMARY: The metabolic efficiency of mammalian cells depends on attenuation of intrinsic translation noise by microRNAs. We devised a metric of cellular metabolic rate ( cMR) , rMR / M exp optimally fit to the number of microRNA families ( miRNA.Fam ), that is robust to variation in mass and sensitive to body temperature, consistent with the Heat Dissipation Limit Theory of Speakman and Król (2010) 1 . Using miRNA.Fam as predictor, an Ornstein-Uhlenbeck process of stabilizing selection, with an adaptive shift at the divergence of Boreoeutheria, accounted for 95% of the variation in cMR across mammals. Branchwise rates of evolution of cMR , miRNA.Fam and body temperature concurrently increased 6- to 7-fold at the divergence of Boreoeutheria, independent of mass. Cellular MR variation across placental mammals was also predicted by the sum of model conserved microRNA-target interactions, revealing an unexpected degree of integration of the microRNA-target apparatus into the energy economy of the mammalian cell.
Overview
The claims and statistics of this paper haven’t been checked yet.
Run the check — free, no account needed. It reads the open-access text and checks the sources it cites.
Integrity signals
Registry
Cites
Statistics
Figures
Verification
Claims the paper makes
The claims and statistics of this paper haven’t been checked yet.
Run the check — free, no account needed. It reads the open-access text and checks the sources it cites.
Self-check
Percentages, sums and reported differences re-computed from the paper’s own numbers.
The self-check needs the paper’s full text.
Citations
Cites
Global quantification of mammalian gene expression control
Schwanhäusser, B., Busse, D., Li, N., Dittmar, G., Schuchhardt, J., Wolf, J., Chen, W., & Selbach, M. (2011) · Nature · doi:10.1038/nature10098 · Cited by 6,566
Peterson, K. J., Dietrich, M. R., & McPeek, M. A. (2009) · BioEssays · doi:10.1002/bies.200900033 · Cited by 252
Research works printed but not linked: 182
- Speakman J.R. and Król, E . Maximal heat dissipation capacity and hyperthermia risk: neglected key factors in the ecology of endotherms. J Anim Ecol 79, 726–746. · DOI
- Simpson GG . 1944. Tempo and Mode in Evolution. Columbia University Press. New York.
- Eldredge N and Gould SJ . 1972. Punctuated Equilibria: an alternative to phyletic gradualism. In Schopf, TJM . (ed), Models in Paleobiology. pp. 82–115. Freeman Cooper. · DOI
- Eldredge N . 1989. Time Frames: The Evolution of Punctuated Equilibria. Princeton University Press. · DOI · Paper page
- 10.2307/2411186 · DOI
- 10.1038/44766 · DOI · Paper page
- 10.1038/nature10516 · DOI
- 10.1016/j.jtbi.2012.08.005 · DOI
- 2013, Rates of speciation and morphological evolution are correlated across the largest vertebrate radiation, Nature Comms, 4, 1958, 10.1038/ncomms2958 · DOI
- 2017, Detection of adaptive shifts on phylogenies by using shifted stochastic processes on a tree, J R Stat Soc B, 79, 1067, 10.1111/rssb.12206 · DOI
- 10.1073/pnas.1710920114 · DOI · Paper page
- 2022, General statistical model shows that macroevolutionary patterns and processes are consistent with Darwinian gradualism, Nat Commun, 13, 1113, 10.1038/s41467-022-28595-z · DOI
- 10.1086/284325 · DOI · Paper page
- 10.1016/j.cbpa.2008.05.008 · DOI
- 2008, Torpor and hibernation in a basal placental mammal, the Lesser Hedgehog Tenrec Echinops telfairi, J Comp Phsiol B, 179, 691
- 2013, A global heterothermic continuum in mammals, Global Ecol Biogeogr, 22, 1029, 10.1111/geb.12077 · DOI
- 2013, Thermal Ecology, Environments, Communities, and Global Change: Energy Intake and Expenditure in Endotherms, . Ann Rev of Ecol Evol System, 44, 461, 10.1146/annurev-ecolsys-110512-135917 · DOI
- 2015, Daily torpor and hibernation in birds and mammals, Biol Reviews, 90, 891, 10.1111/brv.12137 · DOI
- 10.1111/brv.12280 · DOI
- 10.1242/jeb.205591 · DOI · Paper page
- 10.1093/icb/icad067 · DOI
- 2022, Low-cost thermoregulation of wild sloths revealed by heart rate and temperature loggers, J Therm Biol, 110, 103387, 10.1016/j.jtherbio.2022.103387 · DOI
- 10.1098/rspb.2000.1025 · DOI
- 2014, Reconciling theories for metabolic scaling, J Animal Ecol, 83, 20, 10.1111/1365-2656.12085 · DOI
- 10.1007/s00360-017-1096-3 · DOI
- 2020, Live in fluctuating environments, Phil Trans R Soc B, 375, 20190454, 10.1098/rstb.2019.0454 · DOI
- 2019, The decoupled nature of basal metabolic rate and body temperature in endotherm evolution, Nature, 572, 651, 10.1038/s41586-019-1476-9 · DOI
- 10.1098/rspb.2013.1629 · DOI
- 10.1073/pnas.1521662112 · DOI
- 10.1644/08-MAMM-A-089.1 · DOI
- 10.1042/bj3120163 · DOI
- 2018, . Cell size sensing in animal cells coordinates anabolic growth rates and cell cycle progression to maintain cell size uniformity, elife, 7, e26957, 10.7554/eLife.26957 · DOI
- 2019, Decoupling of Rates of Protein Synthesis from Cell Expansion Leads to Supergrowth, Cell Systems, 9, 434, 10.1016/j.cels.2019.10.001 · DOI · Paper page
- 10.1016/j.cell.2019.01.018 · DOI · Paper page
- 2019, Cell size homeostasis: Metabolic control of growth and cell division, BBA Mol Cell Res, 1866, 409
- 10.1016/j.tig.2020.01.011 · DOI
- 10.1093/femsyr/fow081 · DOI · Paper page
- 2018, Homeostasis of protein and mRNA concentrations in growing cells, Nature Comm, 9, 4496, 10.1038/s41467-018-06714-z · DOI
- 10.1073/pnas.71.10.4135 · DOI · Paper page
- 10.1016/S0300-9084(75)80139-8 · DOI
- 10.1016/0303-2647(79)90003-0 · DOI
- 2015, Thermodynamic uncertainty relation for biomolecular processes, Phys Rev Lett, 114, 158101, 10.1103/PhysRevLett.114.158101 · DOI
- 10.1073/pnas.1614838114 · DOI
- 2019, Trade-offs between error, speed, noise, and energy dissipation in biological processes with proofreading, J Phys Chem B, 123, 4718, 10.1021/acs.jpcb.9b03757 · DOI
- 2022, The energy cost and optimal design of networks for biological discrimination, J Royal Soc Interface, 19, 20210883, 10.1098/rsif.2021.0883 · DOI
- 10.1038/ng869 · DOI
- 10.1016/j.cell.2018.03.006 · DOI · Paper page
- 10.1038/s41576-023-00611-y · DOI · Paper page
- 10.1038/msb.2010.59 · DOI · Paper page
- 10.1126/science.aaa1738 · DOI · Paper page
- 10.1093/molbev/msi126 · DOI · Paper page
- 10.1073/pnas.1514974112 · DOI · Paper page
- 10.1038/ng1536 · DOI · Paper page
- 10.1038/nature07242 · DOI · Paper page
- 10.1038/nature07228 · DOI · Paper page
- 10.1101/gr.156919.113 · DOI
- 10.1126/science.aaa1738 · DOI · Paper page
- Lu GA , Zhang J , Zhao Y , Chen Q , Lin P , Tang Z , Wen H , Liufu Z and Wu CI . 2023. Canalization of phenotypes—when the transcriptome is constantly but weakly perturbed. Mol Biol Evol 40: msad005. · DOI
- 10.1074/jbc.M113.482570 · DOI
- 2017, The Proteasomal ATPases Use a Slow but Highly Processive Strategy to Unfold Proteins, Front Mol Biosci, 4, 18
- 2019, Empirical mean-noise fitness landscapes reveal the fitness impact of gene expression noise, Nature Comms, 10, 3180, 10.1038/s41467-019-11116-w · DOI
- 10.7554/eLife.05005 · DOI · Paper page
- 10.1146/annurev-genet-120213-092023 · DOI
- 10.1093/gbe/evv261 · DOI
- 10.1093/nar/gkz885 · DOI · Paper page
- 2021, MirGeneDB 2.1: toward a complete sampling of all major animal phyla, Nucl Acids Res, 50, D204
- Porter WP and Kearney M . 2009. Size, shape, and the thermal niche of endotherms. 2009. PNAS 106: 19666–19672. · DOI
- 2018, On the thermodynamic origin of metabolic scaling, Scientific Reports, 8, 1448, 10.1038/s41598-018-19853-6 · DOI
- 2022, Reconstructed evolutionary patterns for crocodile-line archosaurs demonstrate impact of failure to log-transform body size data, Communications Biology, 171, 1
- 10.1111/j.1420-9101.2011.02344.x · DOI
- 2019, The origin and maintenance of metabolic allometry in animals, Nature Ecol Evol, 3, 598, 10.1038/s41559-019-0839-9 · DOI
- 2016, Positive phenotypic selection inferred from phylogenies, Biol J Linnean Soc, 118, 915
- 10.1016/j.cbpa.2008.08.021 · DOI
- 10.1111/evo.12042 · DOI
- 10.1098/rsbl.2005.0378 · DOI
- 10.1098/rspb.2016.2328 · DOI
- 10.1016/j.cbpa.2010.10.004 · DOI
- 2022, A species-level timeline of mammal evolution integrating phylogenomic data, Nature, 602, 263, 10.1038/s41586-021-04341-1 · DOI
- 2017, Phylotranscriptomic consolidation of the jawed vertebrate timetree, Nature Ecol Evol, 1, 1370, 10.1038/s41559-017-0240-5 · DOI · Paper page
- 2023, A burst of genomic innovation at the origin of placental mammals mediated embryo implantation, Comm Biol, 6, 459, 10.1038/s42003-023-04809-y · DOI
- 10.1093/gbe/evy096 · DOI
- 2020, Ambient Temperature Cycles Affect Daily Torpor and Hibernation Patterns in Malagasy Tenrecs, Front Physiol, 11, 522, 10.3389/fphys.2020.00522 · DOI
- 10.1073/pnas.1419823112 · DOI
- 10.1126/science.aav1741 · DOI
- Choi IY , Kwon EC and Kim NS . 2020. The C- and G-value paradox with polyploidy, repeatomes, introns, phenomes and cell economy. Genes Genomics: 699–714. · DOI
- 10.1101/gad.1884710 · DOI · Paper page
- Langenberger D , Bartschat S , Hertel J , Hoffmann S , Tafer H and Stadler PF . 2011. MicroRNA or not microRNA? Advances in Bioinformatics and Computational Biology. pp: 1–9. Springer. · DOI
- 2011, Systematic curation of miRBase annotation using integrated small RNA high-throughput sequencing data for C. elegans and Drosophila, Front Genet, 2, 25
- 10.1007/s11103-011-9829-2 · DOI
- 10.4161/rna.19230 · DOI
- 10.1093/molbev/mst133 · DOI
- 10.1093/nar/gks1474 · DOI
- 10.1016/j.tplants.2013.11.008 · DOI
- 2017, Bias in recent miRBase annotations potentially associated with RNA quality issues, Sci Rep, 7, 5162, 10.1038/s41598-017-05070-0 · DOI · Paper page
- 10.1105/tpc.17.00851 · DOI
- 10.1073/pnas.1407207111 · DOI
- 10.1016/j.ijpara.2020.10.009 · DOI
- 2021, Large-Scale Annotation and Evolution Analysis of microRNA in Insects, Genome Biol Evol, 13, evab083, 10.1093/gbe/evab083 · DOI
- 2021, Digging into bivalve microRNAomes: between conservation and innovation, Philos Trans R Soc B, 376, 20200165, 10.1098/rstb.2020.0165 · DOI
- 2023, Direct observation of the evolution of cell-type-specific microRNA expression signatures supports the hematopoietic origin model of endothelial cells, Evol Dev, 25, 226, 10.1111/ede.12438 · DOI
- 10.1126/sciadv.add9938 · DOI
- 2022, MicroRNAs as Indicators into the Causes and Consequences of Whole-Genome Duplication Events, Mol Biol Evol, 39, msab344., 10.1093/molbev/msab344 · DOI
- 10.1038/s41586-020-2336-3 · DOI
- 2021, MapToCleave: High-throughput profiling of microRNA biogenesis in living cells, Cell Rep, 37, 110015, 10.1016/j.celrep.2021.110015 · DOI
- 2023, Accurate microRNA annotation of animal genomes using trained covariance models of curated microRNA complements in MirMachine, Cell Genomics, 3, 100348, 10.1016/j.xgen.2023.100348 · DOI
- 2010, Scaling of basal metabolic rate with body mass and temperature in mammals, J Animal Ecol, 79, 610, 10.1111/j.1365-2656.2010.01672.x · DOI
- 10.1126/science.abl8189 · DOI
- 2016, Phylogenetic effective sample size, J Theor Biol, 4017, 371
- 10.1093/bioinformatics/btm538 · DOI
- 10.3733/hilg.v06n11p315 · DOI · Paper page
- 1932, Relation between basal metabolism and mature body weight in different species of mammals and birds, Univ Missouri Agr Exp Stn Res Bull, 166, 89
- 2004, The predominance of quarter-power scaling in biology, Funct Ecol, 18, 257, 10.1111/j.0269-8463.2004.00856.x · DOI · Paper page
- 2023, ncOrtho: efficient and reliable identification of miRNA orthologs, Nucl Acids Res, 51, e71, 10.1093/nar/gkad467 · DOI
- 2018, Evolution of metazoan morphological disparity, PNAS, 29, E8909
- 10.1079/NRR19900013 · DOI
- 1989, Protein synthesis in several tissues of laying hens, Jpn Poul Sci, 26, 340, 10.2141/jpsa.26.340 · DOI
- 2004, Modeling energy utilization in broiler breeders, laying hens and broilers, Brazil J Poultry Sci, 6, 1, 10.1590/S1516-635X2004000100001 · DOI
- 10.1126/science.1251385 · DOI · Paper page
- 10.1073/pnas.1616702114 · DOI · Paper page
- 2018, Mammalian transposable elements and their impacts on genome evolution, Chromosome Res, 26, 25, 10.1007/s10577-017-9570-z · DOI
- 10.1038/ng.368 · DOI
- 10.1093/gbe/evu030 · DOI
- 10.1038/nature21683 · DOI · Paper page
- 10.1038/s41586-020-2486-3 · DOI · Paper page
- 10.1093/gbe/evs070 · DOI
- 10.1038/377391a0 · DOI
- 10.1098/rspb.2008.1012 · DOI
- 10.1098/rspb.2013.2780 · DOI
- 10.1007/s11692-016-9405-4 · DOI
- 2014, Introns and gene expression: Cellular constraints, transcriptional regulation, and evolutionary consequences, Bioessays, 37, 148
- 10.1073/pnas.1517131113 · DOI · Paper page
- 2018, Genome size and brain cell density in birds, Can J Zool, 96, 379, 10.1139/cjz-2016-0306 · DOI
- 2022, Systematic characterization of seed overlap microRNA cotargeting associated with lupus pathogenesis, BMC Biol, 20, 248, 10.1186/s12915-022-01447-4 · DOI
- 2020, Evolutionary dynamics of microRNA target sites across vertebrate evolution, PLoS Genetics, 16, e1008285, 10.1371/journal.pgen.1008285 · DOI
- 10.1007/s00360-007-0193-0 · DOI
- 10.1111/brv.12157 · DOI
- 10.1002/evan.21588 · DOI
- 2016, Primate torpor expression: ghost of the climatic past, Physiol, 31, 398, 10.1152/physiol.00050.2015 · DOI
- 2023, Rare and opportunistic use of orpor in mammals—an echo from the past?, Integr Comp Biol, 0, 1
- 2022, Functional genomics analysis reveals the evolutionary adaptation and demographic history of pygmy lorises, Proc Natl Acad Sci, 119, e2123030119, 10.1073/pnas.2123030119 · DOI
- 10.1073/pnas.1606868114 · DOI
- 2012, Organ-tissue level model of resting energy expenditure across mammals: new insights into Kleiber’s Law, ISRN Zool, 673050, 1-9
- 10.1016/j.cell.2009.01.058 · DOI · Paper page
- 10.1016/j.cell.2019.06.012 · DOI · Paper page
- 2022, Universality of Torpor Expression in Bats, Physiol Biochem Zool, 95, 326, 10.1086/720273 · DOI
- 10.1038/s41580-018-0045-7 · DOI · Paper page
- 10.1016/j.molcel.2019.06.018 · DOI
- 2020, The evolution of mechanisms involved in vertebrate endothermy, Phil Trans R Soc B, 375, 20190136, 10.1098/rstb.2019.0136 · DOI
- 10.1111/j.1461-0248.2008.01277.x · DOI
- 2010, Modelling the ecological niche from functional traits, Phil Trans R Soc B, 265, 3469
- 2021, NicheMapR – an R package for biophysical modelling: the endotherm model, Ecography, 44, 1595, 10.1111/ecog.05550 · DOI
- 10.1890/09-0817.1 · DOI
- 10.1111/ele.12155 · DOI
- 2016, Widespread correlations between climatic niche evolution and species diversification in birds, J Animal Ecol, 85, 869, 10.1111/1365-2656.12530 · DOI
- 2020, Higher temperatures lower rates of physiological and niche evolution, Proc R. Soc B, 287, 0823
- 2021, The evolution of climatic niche breadth in terrestrial vertebrates, J Zool Syst Evol Res, 59, 1155, 10.1111/jzs.12508 · DOI
- 2021, The evolution of critical thermal limits of life on Earth, Nature Comms, 12, 1198, 10.1038/s41467-021-21263-8 · DOI
- 10.1016/S0003-3472(80)80135-7 · DOI
- Crowley SR . 1985. Thermal sensitivity of sprint-running in the lizard Sceloporus undulatus: support for a conservative view of thermal physiology. Oecologia: 219–25. · DOI
- 10.1016/0169-5347(89)90211-5 · DOI
- 10.1098/rstb.2018.0549 · DOI
- 2018, Testing the heat dissipation limitation hypothesis: basal metabolic rates of endotherms decrease with increasing upper and lower critical temperatures, PeerJ, 6, e5725, 10.7717/peerj.5725 · DOI
- 10.3389/fphys.2017.01070 · DOI
- 10.1098/rspb.2014.1097 · DOI
- 10.1038/ng1803 · DOI · Paper page
- 10.1038/ng.905 · DOI
- 10.1016/j.cell.2012.04.005 · DOI · Paper page
- 2017, The evolutionary origin of plant and animal microRNAs, Nature Ecol Evol, 1, 0027, 10.1038/s41559-016-0027 · DOI
- 10.1126/science.1152326 · DOI
- 10.1126/science.1206375 · DOI · Paper page
- 2020, MicroRNAs: from mechanism to organism, Frontiers in Cell and Dev Biol, 8, 409, 10.3389/fcell.2020.00409 · DOI
- 10.1101/gr.251421.119 · DOI · Paper page
- 2020, Nuclear gene proximity and protein interactions shape transcript covariations in mammalian single cells, Nature Comms, 11, 5445, 10.1038/s41467-020-19011-5 · DOI
- 2023, The Integrator complex regulates microRNA abundance through RISC loading, Sci Adv, 9, eadf0597, 10.1126/sciadv.adf0597 · DOI
- 10.1073/pnas.151588598 · DOI · Paper page
- 10.1126/science.abn3943 · DOI · Paper page
- 10.1093/nar/gkx1042 · DOI · Paper page
- 10.1111/j.2041-210X.2011.00169.x · DOI
- 10.1093/molbev/msv150 · DOI
- 2013, CAPER: comparative analyses of phylogenetics and evolution in R, Methods Ecol and Evol, 3, 141
- 10.1242/jeb.01501 · DOI · Paper page
- 10.1080/10635150490522232 · DOI
Metadata
- Authors
- Fromm, B., & Sorger, T.
- Affiliations
- UiT The Arctic University of Norway (NO)
- Roger Williams University (US)
- Corresponding author
- Fromm, Bastian
- Venue
- iScience
- Publisher
- openRxiv
- Published
- 2022-11-25
- Volume
- 27
- Issue
- 2
- Pages
- 108740-108740
- ISSN
- 2589-0042 (ISSN-L)
- PMC
- PMC10847693
- OpenAlex
- W4390030483
- Cited by
- 1
- References
- 2
- Citations by year
- 2024: 1
- FWCI
- 0.13
- Type
- journal article
- Language
- en
- Open access
- gold
- doi.org
- Licence
- cc-by-nc-nd
- Locations
- iScience (publishedVersion, cc-by-nc-nd)
- bioRxiv (Cold Spring Harbor Laboratory) (acceptedVersion, cc-by-nc-nd)
- PubMed Central (publishedVersion, cc-by-nc-nd)
- PubMed (publishedVersion)
- Roger Williams University - Digital Commons (Roger Williams University) (submittedVersion)
- DOAJ (DOAJ: Directory of Open Access Journals) (submittedVersion, cc-by-sa)
- Funders
- Universitetet i Tromsø
- Tromsø Forskningsstiftelse (20_SG_BF)
- Topics
- Life Sciences › Biochemistry, Genetics and Molecular Biology › Cancer Research › MicroRNA in disease regulation
- Physical Sciences › Environmental Science › Ecology › Physiological and biochemical adaptations
- Health Sciences › Medicine › Physiology (medical) › Adipose Tissue and Metabolism
- Keywords
- microRNA, endothermy evolution, miRNA-target interactions, placental mammals, energy metabolism
About these checks
Registry, retraction, Cites and statistics results are computed, not judged, with one exception: a printed reference that no index lists is read once by a model before it counts as a citation error. Claims are extracted by a model and kept only when their quote appears verbatim in the text; each cited source is then checked, with a model’s help, for whether it says what the claim relies on. Those verdicts can be wrong — read the claim’s quote and the cited source before relying on one.
Statistics and arithmetic are recomputed, not judged.
Confidence bands are shown only for fields calibrated on our annotated test set. None is calibrated yet, so no band is shown.
What counts as a claim ›How we measure confidence ›How we check this ›
Are you an author, or do you see a problem with this page? Request a review
How to cite
Cite CoChat for the checks on this page, and the paper for its own findings.
- This page
- CoChat. (2026). Citation check: Rapid Adaptation of Cellular Metabolic Rate to the MicroRNA Complements of Mammals and its Relevance to the Evolution of Endothermy. https://app.cochat.ai/papers/10.1101/2022.11.24.517858
- The paper
- Fromm, B., & Sorger, T. (2022). Rapid Adaptation of Cellular Metabolic Rate to the MicroRNA Complements of Mammals and its Relevance to the Evolution of Endothermy. iScience. https://doi.org/10.1101/2022.11.24.517858
