Cited by 103

The DOI matches its Crossref record; 14 of the 14 references it cites were found in a registry or an index.

Protein signatures of centenarians and their offspring suggest centenarians age slower than other humans

Sebastiani, Paola, Federico, Anthony, Morris, Melody, Gurinovich, Anastasia, Tanaka, Toshiko, Chandler, Kevin B., Andersen, Stacy L., Denis, Gerald, Costello, Catherine E., Ferrucci, Luigi, Jennings, Lori, Glass, David J., Monti, Stefano, Perls, Thomas T.·2021·Aging Cell

Abstract

Using samples from the New England Centenarian Study (NECS), we sought to characterize the serum proteome of 77 centenarians, 82 centenarians' offspring, and 65 age‐matched controls of the offspring (mean ages: 105, 80, and 79 years). We identified 1312 proteins that significantly differ between centenarians and their offspring and controls (FDR < 1%), and two different protein signatures that predict longer survival in centenarians and in younger people. By comparing the centenarian signature with 2 independent proteomic studies of aging, we replicated the association of 484 proteins of aging and we identified two serum protein signatures that are specific of extreme old age. The data suggest that centenarians acquire similar aging signatures as seen in younger cohorts that have short survival periods, suggesting that they do not escape normal aging markers, but rather acquire them much later than usual. For example, centenarian signatures are significantly enriched for senescence‐associated secretory phenotypes, consistent with those seen with younger aged individuals, and from this finding, we provide a new list of serum proteins that can be used to measure cellular senescence. Protein co‐expression network analysis suggests that a small number of biological drivers may regulate aging and extreme longevity, and that changes in gene regulation may be important to reach extreme old age. This centenarian study thus provides additional signatures that can be used to measure aging and provides specific circulating biomarkers of healthy aging and longevity, suggesting potential mechanisms that could help prolong health and support longevity.

Overview

The claims and statistics of this paper haven’t been checked yet.

Run the check — free, no account needed. It reads the open-access text and checks the sources it cites.

A few free checks a day · papers already verified open instantly · results are public

Integrity signals

Registry

Crossref · 10.1111/acel.13290

Cites

14 of 14 references verified0 citation errors · 0 not checkable

Statistics

Figures

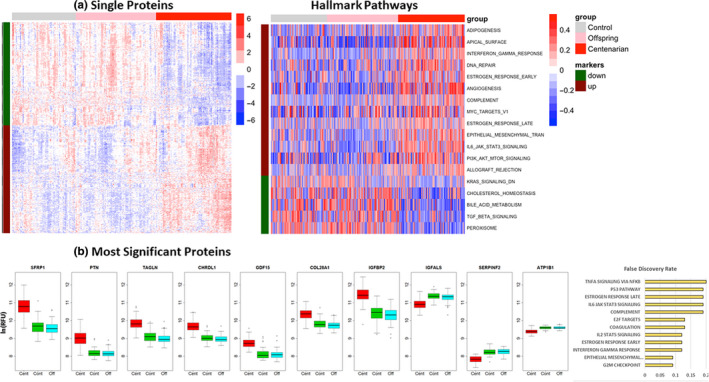
FIGURE 1 Proteomic signatures of centenarians. (a) Left: Heatmap of the 1428 SomaScan aptamers (1312 proteins) that were significantly different between centenarians, centenarians' offspring, and controls at 1% false discovery rate (FDR). The rows represent aptamers grouped into those lower in centenarians compared with the other two groups (695 aptamers, green bar on the left), and those higher in centenarians compared with the other groups (733 aptamers, red bar on the left). The columns represent samples, grouped into controls (gray bar on the top), centenarians' offspring (pink bar on the top), and centenarians (red bar on the top). The values in each cell represent log‐transformed relative fluorescence unit (RFU), standardized by row. The rows were clustered within up‐ and downregulated groups, and the columns were clustered within centenarians, centenarians' offspring, and controls using hierarchical clustering. Right: Heatmap of the 18 Hallmark pathways that were significantly altered in centenarians, centenarians' offspring, and controls at 5% FDR. The rows represent pathways, grouped into those downregulated in centenarians (5 pathways, green band on the left), and those upregulated in centenarians compared with the other two groups (13 pathways, red band on the left). The values in each cell represent the pathway scores, standardized by row. (b) Selection of 10 proteins with differential intensity in centenarians (red boxplots), controls (green), and centenarian offspring (cyan). Values on the y‐axis are log‐transformed relative fluorescence unit (RFU). The barplot in orange shows the adjusted p‐values of the 12 pathways enriched in the set of 1312 differentially expressed proteins
FIGURE 1 Proteomic signatures of centenarians. (a) Left: Heatmap of the 1428 SomaScan aptamers (1312 proteins) that were significantly different between centenarians, centenarians' offspring, and controls at 1% false discovery rate (FDR). The rows represent aptamers grouped into those lower in centenarians compared with the other two groups (695 aptamers, green bar on the left), and those higher in centenarians compared with the other groups (733 aptamers, red bar on the left). The columns represent samples, grouped into controls (gray bar on the top), centenarians' offspring (pink bar on the top), and centenarians (red bar on the top). The values in each cell represent log‐transformed relative fluorescence unit (RFU), standardized by row. The rows were clustered within up‐ and downregulated groups, and the columns were clustered within centenarians, centenarians' offspring, and controls using hierarchical clustering. Right: Heatmap of the 18 Hallmark pathways that were significantly altered in centenarians, centenarians' offspring, and controls at 5% FDR. The rows represent pathways, grouped into those downregulated in centenarians (5 pathways, green band on the left), and those upregulated in centenarians compared with the other two groups (13 pathways, red band on the left). The values in each cell represent the pathway scores, standardized by row. (b) Selection of 10 proteins with differential intensity in centenarians (red boxplots), controls (green), and centenarian offspring (cyan). Values on the y‐axis are log‐transformed relative fluorescence unit (RFU). The barplot in orange shows the adjusted p‐values of the 12 pathways enriched in the set of 1312 differentially expressed proteinsCC BY · PubMed Central
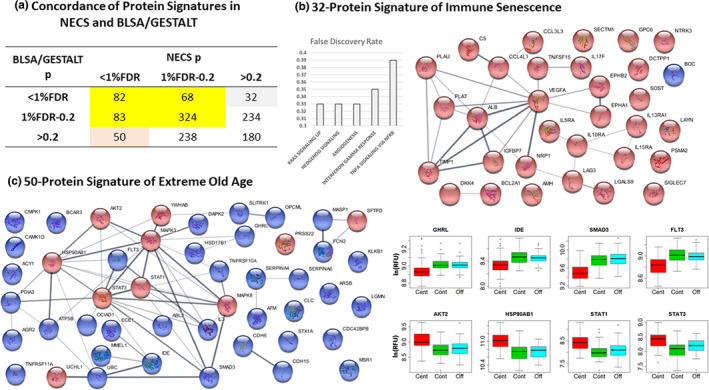
FIGURE 2 Comparison with proteomic profiles in plasma samples of BLSA/GESTALT participants. (a) Concordance table of the results for the 1291 aptamers common to the NECS and BLSA/GESTALT studies. The aptamers were grouped by level of significance (significant: p < 1% FDR), ambiguous (p between 1% FDR and 0.2), or not significant (p > 0.2). The concordance of the 82 significant results was highly significant (p from Fisher exact test <2.2e‐16). (b) Annotation of the 32 protein signature of immune senescence and their network of connection. The network was built using STRING (https://string‐db.org/), and nodes represent proteins (red denotes proteins that increase with age and blue denotes proteins that decrease with age) while edges are connections based on known interactions (magenta and cyan), text mining (light green), and co‐expression (black). (c) Network of connections between the 50 proteins of the extreme old‐age signature (red nodes = proteins over‐expressed in centenarians; blue nodes = proteins under‐expressed in centenarians), and selection of eight proteins that generate differential signal intensities in centenarians (red boxplots), compared with controls (green), and centenarian offspring (cyan). Values on the y‐axis are log‐transformed RFU
FIGURE 2 Comparison with proteomic profiles in plasma samples of BLSA/GESTALT participants. (a) Concordance table of the results for the 1291 aptamers common to the NECS and BLSA/GESTALT studies. The aptamers were grouped by level of significance (significant: p < 1% FDR), ambiguous (p between 1% FDR and 0.2), or not significant (p > 0.2). The concordance of the 82 significant results was highly significant (p from Fisher exact test <2.2e‐16). (b) Annotation of the 32 protein signature of immune senescence and their network of connection. The network was built using STRING (https://string‐db.org/), and nodes represent proteins (red denotes proteins that increase with age and blue denotes proteins that decrease with age) while edges are connections based on known interactions (magenta and cyan), text mining (light green), and co‐expression (black). (c) Network of connections between the 50 proteins of the extreme old‐age signature (red nodes = proteins over‐expressed in centenarians; blue nodes = proteins under‐expressed in centenarians), and selection of eight proteins that generate differential signal intensities in centenarians (red boxplots), compared with controls (green), and centenarian offspring (cyan). Values on the y‐axis are log‐transformed RFUCC BY · PubMed Central
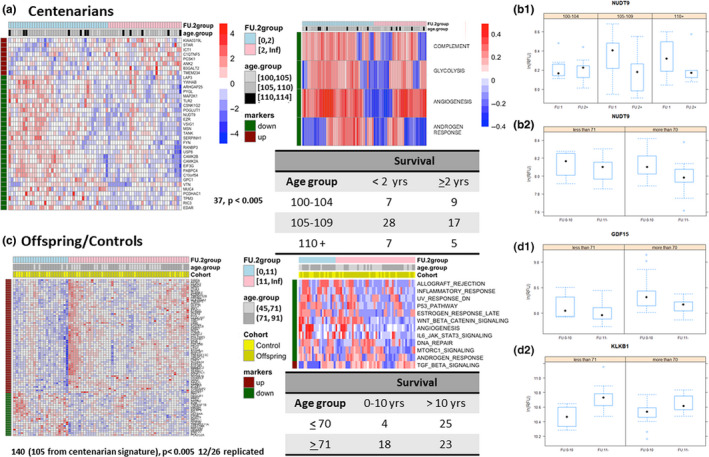
FIGURE 3 Longevity and extreme longevity signatures. (a) Heatmap of the 37‐protein signature in centenarians (nominal p‐value <0.005) and of the 4 Hallmark pathways that differentiate between shorter and longer survival in centenarians (p‐value <0.05). See the legend of Figure 1 for details of the heatmaps. (b.1) Conditional boxplots of ADP‐ribose diphosphatase (gene NUDT9) in centenarians. Each panel displays boxplots of log‐transformed RFU by survival (FU:1 = less than 2 years, FU:2+ =2 or more years). Different panels show increasing age at blood draw. (b.2). Conditional boxplots of ADP‐ribose diphosphatase (gene NUDT9) in centenarians' offspring and controls. The left panel displays boxplots of log‐transformed RFU by survival (FU:10 = up to 10 years, FU:11+ = 11 or more years), in subjects aged <71 years at blood draw. The right panel represents subjects aged 71 and older at blood draw. Both conditional plots show that ADP‐ribose diphosphatase (gene NUDT9) increases with older age but is lower in people with longer survival. (c) Heatmap of the 140‐protein signature (p‐value <0.005) and of the 12 Hallmark pathways that correlate with longer survival in longevity in centenarians' offspring and controls. (d1, d2) Conditional boxplots of log‐transformed RFU for GDF15 and KLKB1 in centenarians' offspring and controls stratified by survival (FU:10 = up to 10 years, FU:11+ = 11 or more years) and age at blood draw (<71 years or 71 and older). The plots show that GDF15 increases with age and lower levels are associated with longevity in centenarians offspring and controls, and KLKB1 expression decreases with age and higher values are predictive of longer survival
FIGURE 3 Longevity and extreme longevity signatures. (a) Heatmap of the 37‐protein signature in centenarians (nominal p‐value <0.005) and of the 4 Hallmark pathways that differentiate between shorter and longer survival in centenarians (p‐value <0.05). See the legend of Figure 1 for details of the heatmaps. (b.1) Conditional boxplots of ADP‐ribose diphosphatase (gene NUDT9) in centenarians. Each panel displays boxplots of log‐transformed RFU by survival (FU:1 = less than 2 years, FU:2+ =2 or more years). Different panels show increasing age at blood draw. (b.2). Conditional boxplots of ADP‐ribose diphosphatase (gene NUDT9) in centenarians' offspring and controls. The left panel displays boxplots of log‐transformed RFU by survival (FU:10 = up to 10 years, FU:11+ = 11 or more years), in subjects aged <71 years at blood draw. The right panel represents subjects aged 71 and older at blood draw. Both conditional plots show that ADP‐ribose diphosphatase (gene NUDT9) increases with older age but is lower in people with longer survival. (c) Heatmap of the 140‐protein signature (p‐value <0.005) and of the 12 Hallmark pathways that correlate with longer survival in longevity in centenarians' offspring and controls. (d1, d2) Conditional boxplots of log‐transformed RFU for GDF15 and KLKB1 in centenarians' offspring and controls stratified by survival (FU:10 = up to 10 years, FU:11+ = 11 or more years) and age at blood draw (<71 years or 71 and older). The plots show that GDF15 increases with age and lower levels are associated with longevity in centenarians offspring and controls, and KLKB1 expression decreases with age and higher values are predictive of longer survivalCC BY · PubMed Central
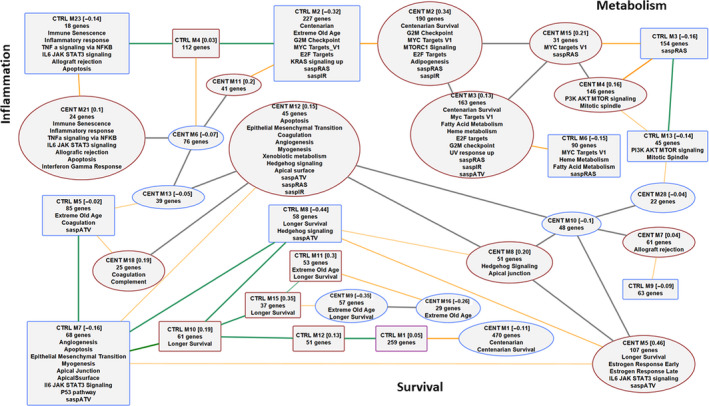
FIGURE 4 Overlap of modules of co‐regulated proteins in centenarians, and centenarians' offspring and controls. Squares denote protein modules in centenarians' offspring and controls (CTRL), and ellipses denote protein modules in centenarians (CENT). A red border denotes upregulated modules and a blue border denotes downregulated modules. Green edges represent correlations between centenarians' offspring and control modules, and gray edges represent correlation between centenarian modules. The numbers within square brackets represent the average standardized expression comparing CTRL to CENT in the CTRL modules and the other way round in CENT modules. For example, CENT M1 [−0.11] means that the average standardized expression of the proteins in the module comparing centenarians to offspring/control is −0.11. Gray edges represent correlation between eigengenes >0.8. Orange edges represent a >10% overlap based on Jaccard's concordance index. Each module was annotated with enrichment for the 50 Hallmark pathways, the 1312 centenarian signature, the 32‐protein signature of immune senescence, the 50‐protein signature of extreme old age, the 37‐protein signature of survival in the centenarians, the 140‐protein signature of survival in the offspring and controls, and the three SASP signatures of senescence
FIGURE 4 Overlap of modules of co‐regulated proteins in centenarians, and centenarians' offspring and controls. Squares denote protein modules in centenarians' offspring and controls (CTRL), and ellipses denote protein modules in centenarians (CENT). A red border denotes upregulated modules and a blue border denotes downregulated modules. Green edges represent correlations between centenarians' offspring and control modules, and gray edges represent correlation between centenarian modules. The numbers within square brackets represent the average standardized expression comparing CTRL to CENT in the CTRL modules and the other way round in CENT modules. For example, CENT M1 [−0.11] means that the average standardized expression of the proteins in the module comparing centenarians to offspring/control is −0.11. Gray edges represent correlation between eigengenes >0.8. Orange edges represent a >10% overlap based on Jaccard's concordance index. Each module was annotated with enrichment for the 50 Hallmark pathways, the 1312 centenarian signature, the 32‐protein signature of immune senescence, the 50‐protein signature of extreme old age, the 37‐protein signature of survival in the centenarians, the 140‐protein signature of survival in the offspring and controls, and the three SASP signatures of senescenceCC BY · PubMed Central

Verification

Claims the paper makes

The claims and statistics of this paper haven’t been checked yet.

Run the check — free, no account needed. It reads the open-access text and checks the sources it cites.

A few free checks a day · papers already verified open instantly · results are public

Claims other papers make about this one

Each is checked against this paper’s own text: does it say what the citing paper says it does?

Self-check

Percentages, sums and reported differences re-computed from the paper’s own numbers.

The self-check needs the paper’s full text.

Citations

Cites

Show all 14 references

Research works printed but not linked: 50

  1. 10.1093/gerona/glr223 · DOI · Paper page
  2. 10.1002/jbmr.1718 · DOI
  3. 10.1093/gerona/glu166 · DOI
  4. 10.1038/s41598-017-14755-5 · DOI
  5. 10.1016/j.tem.2016.12.003 · DOI
  6. 10.1111/acel.12065 · DOI · Paper page
  7. 10.1073/pnas.1213933109 · DOI
  8. 10.1016/j.bone.2016.10.007 · DOI
  9. 10.1080/10409238.2019.1610722 · DOI
  10. 10.1016/j.bbadis.2017.09.017 · DOI
  11. 10.1126/science.aaq1327 · DOI · Paper page
  12. 10.1111/acel.13080 · DOI · Paper page
  13. 10.3389/fimmu.2017.01960 · DOI · Paper page
  14. 10.1016/j.bbadis.2012.03.013 · DOI
  15. 10.1073/pnas.1507719112 · DOI
  16. 10.1111/jgs.14222 · DOI
  17. 10.1038/ncb3118 · DOI
  18. 10.1161/CIRCHEARTFAILURE.118.005133 · DOI
  19. 10.1128/MCB.00141-19 · DOI · Paper page
  20. 10.1373/clinchem.2007.099937 · DOI
  21. 10.1007/s11357-018-0042-y · DOI · Paper page
  22. 10.1126/science.aad3267 · DOI · Paper page
  23. 10.1016/j.cmet.2016.05.009 · DOI · Paper page
  24. 10.1016/j.breast.2008.04.005 · DOI
  25. 10.1161/ATVBAHA.107.159608 · DOI
  26. 10.1002/hep.22360 · DOI
  27. 10.1016/j.ab.2007.11.020 · DOI
  28. 10.1093/gerona/glu121 · DOI · Paper page
  29. 10.1002/jbmr.217 · DOI
  30. 10.1016/j.tem.2018.05.002 · DOI · Paper page
  31. 10.1002/dvg.22991 · DOI
  32. 10.18632/aging.100242 · DOI
  33. 10.1111/acel.12717 · DOI
  34. 10.1038/s41586-018-0457-8 · DOI · Paper page
  35. 10.1074/jbc.M205601200 · DOI
  36. 10.18632/aging.102826 · DOI
  37. 10.1007/s11357-018-0046-7 · DOI
  38. 10.1093/gerona/glx027 · DOI
  39. 10.3389/fgene.2012.00277 · DOI · Paper page
  40. 10.3389/fpubh.2013.00038 · DOI
  41. 10.1111/acel.12557 · DOI · Paper page
  42. 10.1371/journal.pone.0180046 · DOI
  43. 10.1016/j.cell.2019.02.038 · DOI · Paper page
  44. 10.1038/s41586-018-0175-2 · DOI · Paper page
  45. 10.1111/acel.12799 · DOI · Paper page
  46. Terry D., 2002, Familial traits of longevity in children of centenarians: Preliminary findings, Journal of the American Geriatrics Society, 50, S138
  47. 10.1016/j.tem.2017.07.004 · DOI
  48. 10.7554/eLife.39856 · DOI · Paper page
  49. 10.1016/j.tips.2016.11.005 · DOI
  50. 10.1126/science.aav4809 · DOI

Cited by

Sorted by citations

Metadata

Authors
Sebastiani, P., Federico, A., Morris, M., Gurinovich, A., Tanaka, T., Chandler, K. B., Andersen, S. L., Denis, G., Costello, C. E., Ferrucci, L., Jennings, L., Glass, D. J., Monti, S., & Perls, T. T.
Affiliations
  • Institute for Clinical Research and Health Policy Studies Tufts Medical Center Boston MA USA
  • Bioinformatics Program Boston University Boston MA USA
  • Novartis Institutes for Biomedical Research Cambridge MA USA
  • Translational Gerontology Branch National Institute on Aging Baltimore MD USA
  • Translational Glycobiology Institute Department of Translational MedicineFlorida International University Herbert Wertheim College of Medicine Miami FL USA
  • Geriatric Section Department of Medicine Boston University School of Medicine and Boston Medical Center Boston MA USA
  • Department of Medicine BU‐BMC Cancer Center Boston University School of Medicine Boston MA USA
  • Department of Biochemistry Center for Biomedical Mass Spectrometry Boston University School of Medicine Boston MA USA
Venue
Aging Cell
Publisher
Wiley
Published
2021-01-29
Volume
20
Issue
2
ISSN
  • 1474-9718
  • 1474-9726
Cited by
103
References
14
Language
en
Funders
  • National Institute on Aging (R01‐, AG061844)
  • National Institute of General Medical Sciences (R24‐GM134210)
  • NIH Office of the Director (S10‐OD021728)

About these checks

Registry, retraction, Cites and statistics results are computed, not judged, with one exception: a printed reference that no index lists is read once by a model before it counts as a citation error. Claims are extracted by a model and kept only when their quote appears verbatim in the text; each cited source is then checked, with a model’s help, for whether it says what the claim relies on. Those verdicts can be wrong — read the claim’s quote and the cited source before relying on one.

Statistics and arithmetic are recomputed, not judged.

Confidence bands are shown only for fields calibrated on our annotated test set. None is calibrated yet, so no band is shown.

What counts as a claim ›How we measure confidence ›How we check this ›

Are you an author, or do you see a problem with this page? Request a review