Cited by 32

The DOI matches its Crossref record; 13 of the 13 references it cites were found in a registry or an index.

Type I Interferon signaling controls the accumulation and transcriptomes of monocytes in the aged lung

D’Souza, Shanti S., Zhang, Yuanyue, Bailey, Jacob T., Fung, Ivan T. H., Kuentzel, Marcy L., Chittur, Sridar V., Yang, Qi·2021·Aging Cell

Abstract

Aging is paradoxically associated with a deteriorated immune defense (immunosenescence) and increased basal levels of tissue inflammation (inflammaging). The lung is particularly sensitive to the effects of aging. The immune cell mechanisms underlying physiological lung aging remain poorly understood. Here we reveal that aging leads to increased interferon signaling and elevated concentrations of chemokines in the lung, which is associated with infiltration of monocytes into the lung parenchyma. scRNA‐seq identified a novel Type‐1 interferon signaling dependent monocyte subset (MO‐ifn) that upregulated IFNAR1 expression and exhibited greater transcriptomal changes with aging than the other monocytes. Blockade of type‐1 interferon signaling by treatment with anti‐IFNAR1 neutralizing antibodies rapidly ablated MO‐ifn cells. Treatment with anti‐IFNAR1 antibodies also reduced airway chemokine concentrations and repressed the accumulation of the overall monocyte population in the parenchyma of the aged lung. Together, our work suggests that physiological aging is associated with increased basal level of airway monocyte infiltration and inflammation in part due to elevated type‐1 interferon signaling.

Overview

The claims and statistics of this paper haven’t been checked yet.

Run the check — free, no account needed. It reads the open-access text and checks the sources it cites.

A few free checks a day · papers already verified open instantly · results are public

Integrity signals

Registry

Crossref · 10.1111/acel.13470

Cites

13 of 13 references verified0 citation errors · 0 not checkable

Statistics

Figures

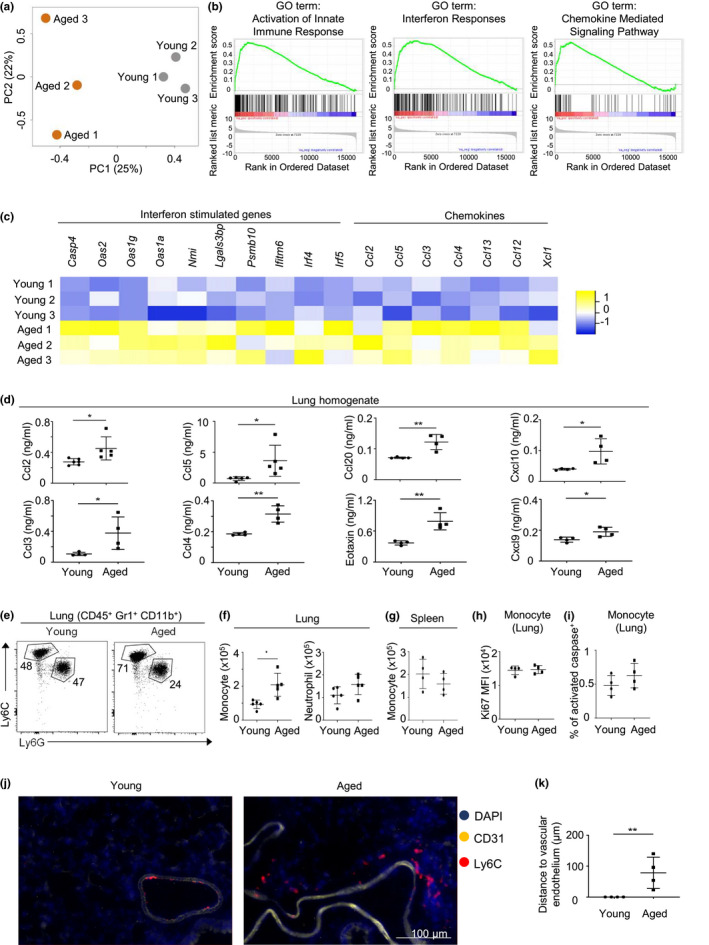
FIGURE 1 Increased Type I Interferon signaling and chemokines in lungs of aged mice. (a) Principle component analysis of microarray data from total lung cells of young (gray) and aged (orange) female mice. (b) Significant gene sets based on Gene Set Enrichment Analyses (GSEA) of microarray data from lungs of young and aged mice. (c) Heatmap depicting the expression of representative genes in young and aged mouse lungs. p value <0.05 for all gene shown in the heatmap. (d) Chemokine concentrations from the lung homogenates of naïve young and aged mice. Data are from 4–5 mice per group. (e) Representative flow cytometry plot of monocytes (CD45+ Gr1+ CD11b+ Ly6C+) and neutrophils (CD45+ Gr1+ CD11b+ Ly6G+) from lungs of young and aged mice. (f) Number of monocytes and neutrophils in lungs of young and aged mice. (g) Number of monocytes in lungs of young and aged mice. (h) Geometric mean fluorescence intensity of Ki67 staining of monocytes and neutrophils in lungs of young and aged mice. (i) Percentage of activated caspase+ monocytes and neutrophils in lungs of young and aged female mice. (j) Representative immunofluorescence staining of monocytes (Ly6C+) and vascular endothelial cells (CD31+) in the lungs of young and aged mice. (i) Distance between monocytes and vascular endothelium. Data are from female mice (a‐k). Data are from 3 mice per group (a‐c), or are from 4–6 mice per group, two independent experiments (d‐k). Error bars are mean ± SD. *, p < 0.05; **, p < 0.01
FIGURE 1 Increased Type I Interferon signaling and chemokines in lungs of aged mice. (a) Principle component analysis of microarray data from total lung cells of young (gray) and aged (orange) female mice. (b) Significant gene sets based on Gene Set Enrichment Analyses (GSEA) of microarray data from lungs of young and aged mice. (c) Heatmap depicting the expression of representative genes in young and aged mouse lungs. p value <0.05 for all gene shown in the heatmap. (d) Chemokine concentrations from the lung homogenates of naïve young and aged mice. Data are from 4–5 mice per group. (e) Representative flow cytometry plot of monocytes (CD45+ Gr1+ CD11b+ Ly6C+) and neutrophils (CD45+ Gr1+ CD11b+ Ly6G+) from lungs of young and aged mice. (f) Number of monocytes and neutrophils in lungs of young and aged mice. (g) Number of monocytes in lungs of young and aged mice. (h) Geometric mean fluorescence intensity of Ki67 staining of monocytes and neutrophils in lungs of young and aged mice. (i) Percentage of activated caspase+ monocytes and neutrophils in lungs of young and aged female mice. (j) Representative immunofluorescence staining of monocytes (Ly6C+) and vascular endothelial cells (CD31+) in the lungs of young and aged mice. (i) Distance between monocytes and vascular endothelium. Data are from female mice (a‐k). Data are from 3 mice per group (a‐c), or are from 4–6 mice per group, two independent experiments (d‐k). Error bars are mean ± SD. *, p < 0.05; **, p < 0.01CC BY · PubMed Central
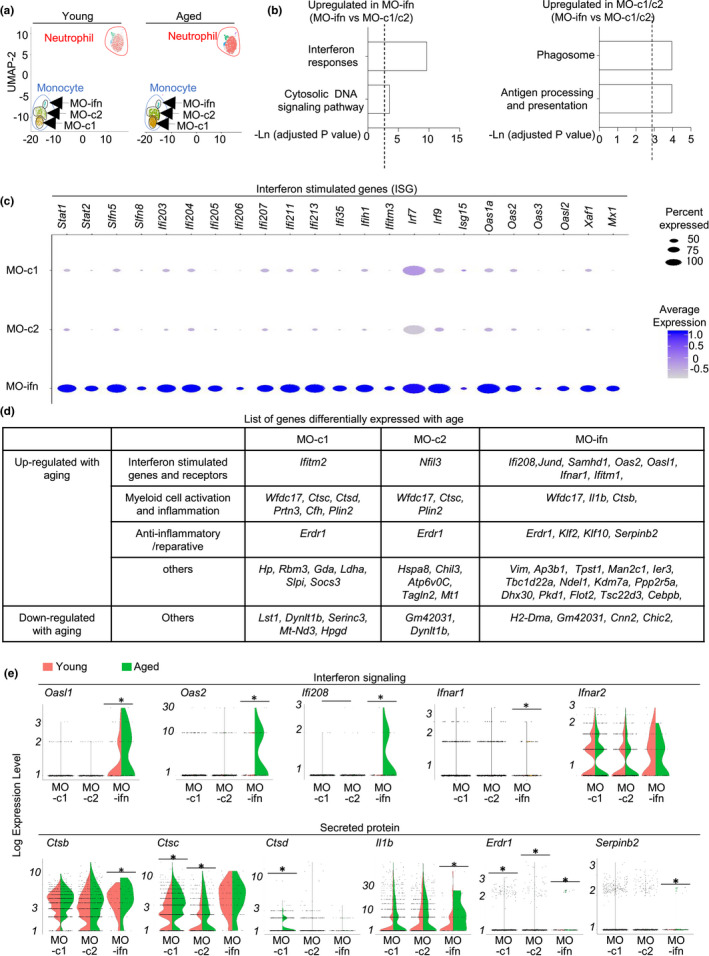
FIGURE 2 Aging alters the single‐cell transcriptomes of pulmonary monocytes. Single‐cell RNA‐seq were performed with FACS‐sorted Ly6C+ monocytes and Ly6G+ neutrophils from lungs of young and aged female mice. (a) Unsupervised clustering of cell subsets by UMAP analysis. (b) Pathways of genes highly expressed in MO‐ifn cells, or in MO‐c1 and MO‐c2 cells. p value < 0.05, and absolute log (FC) value >0.3 were used as threshold to identify differentially expressed genes. (c) Dot map depicts expressional levels of interferon‐stimulated genes that were highly expressed in MO‐ifn cells. (d) List of genes that were differentiated expressed with aging in each monocyte subset. (e). Violin plots depicts expression of the indicated genes in each monocyte subset in young and aged mice. Data are from 5 mice pooled, per group. * p < 0.05
FIGURE 2 Aging alters the single‐cell transcriptomes of pulmonary monocytes. Single‐cell RNA‐seq were performed with FACS‐sorted Ly6C+ monocytes and Ly6G+ neutrophils from lungs of young and aged female mice. (a) Unsupervised clustering of cell subsets by UMAP analysis. (b) Pathways of genes highly expressed in MO‐ifn cells, or in MO‐c1 and MO‐c2 cells. p value < 0.05, and absolute log (FC) value >0.3 were used as threshold to identify differentially expressed genes. (c) Dot map depicts expressional levels of interferon‐stimulated genes that were highly expressed in MO‐ifn cells. (d) List of genes that were differentiated expressed with aging in each monocyte subset. (e). Violin plots depicts expression of the indicated genes in each monocyte subset in young and aged mice. Data are from 5 mice pooled, per group. * p < 0.05CC BY · PubMed Central
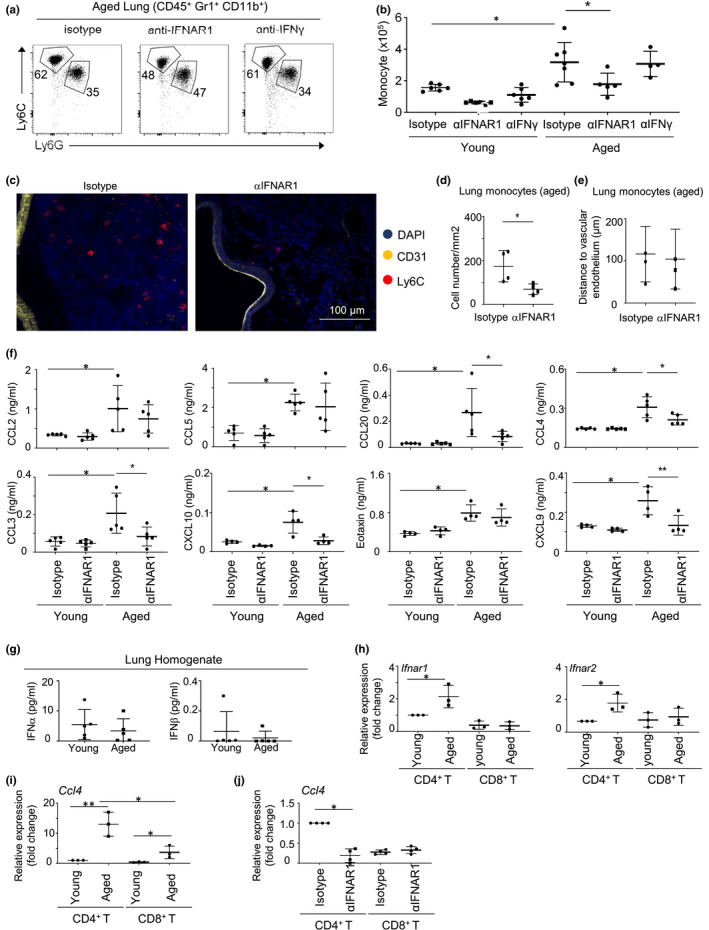
FIGURE 3 Type I Interferon, but not IFNγ promote monocyte accumulation in the aged lung. Young and aged female mice were treated with either Isotype, anti‐IFNAR1 or anti‐IFNγ antibodies for 1 week. (a) Representative flow cytometry plots showing lung monocytes (CD45+ Gr1+ Ly6G− Ly6C+ CD11b+) and neutrophils (CD45+ Gr1+ CD11b+ Ly6C− Ly6G+). (b) Total number of lung monocytes from flow cytometry analysis. (c) Immunofluorescence staining of monocytes and vascular endothelial cells in the lungs of aged mice treated with isotype control or anti‐IFNAR1 antibody. (d) Average numbers of monocytes by immunofluorescence staining. (e) Distance between monocytes and vascular endothelium. (f) Chemokine concentrations from the lung homogenates of naïve young and aged mice treated with Isotype or anti‐IFNAR1 antibody for one week. (g) Levels of IFNα and IFNβ in the lung homogenate. (h) CD4+ and CD8+ T cells were sorted from the lungs of young and aged mice by fluorescence activated cell sorting (FACS). QPCR analyses were performed to examine the expression of Ifnar1 and Ifnar2. (i) Expressional levels of Ccl4 in FACS‐sorted CD4+ and CD8+ T cells. (j) Expressional levels of Ccl4 in CD4+ and CD8+ T cells from the lungs of aged mice treated with isotype control or anti‐IFNAR1 antibody. Data are from 4–6 mice per group, two independent experiments. Error bars are mean ± SD. *, p<0.05; **, p<0.01
FIGURE 3 Type I Interferon, but not IFNγ promote monocyte accumulation in the aged lung. Young and aged female mice were treated with either Isotype, anti‐IFNAR1 or anti‐IFNγ antibodies for 1 week. (a) Representative flow cytometry plots showing lung monocytes (CD45+ Gr1+ Ly6G− Ly6C+ CD11b+) and neutrophils (CD45+ Gr1+ CD11b+ Ly6C− Ly6G+). (b) Total number of lung monocytes from flow cytometry analysis. (c) Immunofluorescence staining of monocytes and vascular endothelial cells in the lungs of aged mice treated with isotype control or anti‐IFNAR1 antibody. (d) Average numbers of monocytes by immunofluorescence staining. (e) Distance between monocytes and vascular endothelium. (f) Chemokine concentrations from the lung homogenates of naïve young and aged mice treated with Isotype or anti‐IFNAR1 antibody for one week. (g) Levels of IFNα and IFNβ in the lung homogenate. (h) CD4+ and CD8+ T cells were sorted from the lungs of young and aged mice by fluorescence activated cell sorting (FACS). QPCR analyses were performed to examine the expression of Ifnar1 and Ifnar2. (i) Expressional levels of Ccl4 in FACS‐sorted CD4+ and CD8+ T cells. (j) Expressional levels of Ccl4 in CD4+ and CD8+ T cells from the lungs of aged mice treated with isotype control or anti‐IFNAR1 antibody. Data are from 4–6 mice per group, two independent experiments. Error bars are mean ± SD. *, p<0.05; **, p<0.01CC BY · PubMed Central
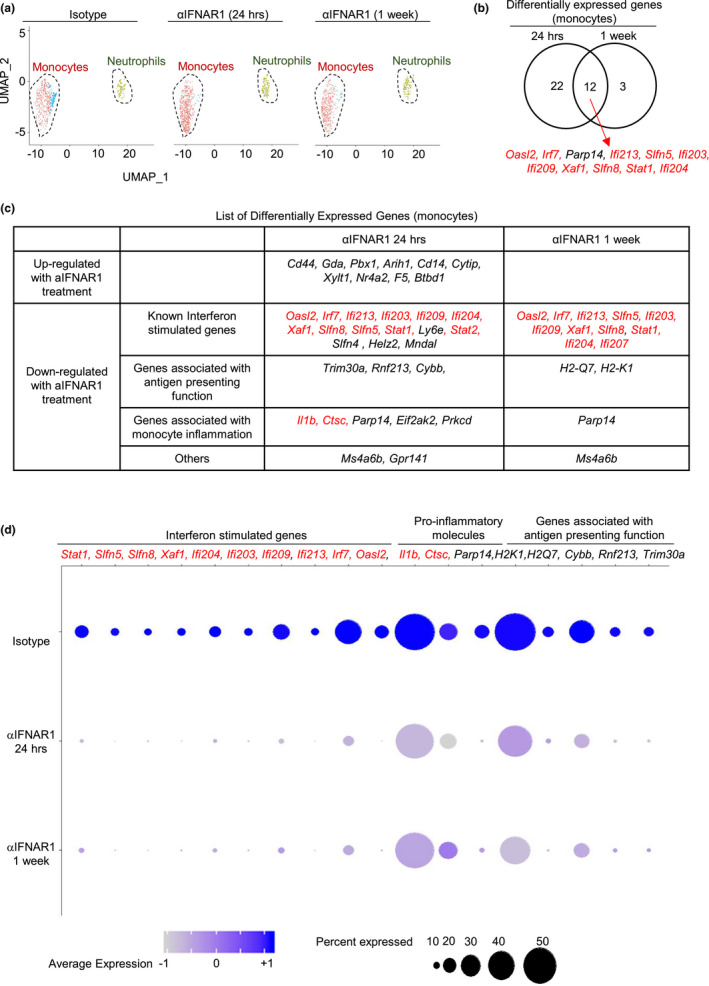
FIGURE 4 Neutralizing anti‐IFNAR1 treatment alters the transcriptome of aged lung monocytes. (a) Ly6C+ monocytes and Ly6G+ neutrophils from lungs of aged mice treated with isotype or anti‐IFNAR1 antibody were sorted, and single‐cell RNA sequencing was carried out. UMAP plot reveals two populations of cells. (b) Venn diagram showing the overlap between genes either upregulated or downregulated with one day or one week of anti‐IFNAR1 treatment in aged mouse monocytes. p value < 0.05, and absolute log (FC) value >0.3 were used as threshold to identify differentially expressed genes. Genes in red colors were highly expressed in MO‐ifn cells. (c) List of genes that were upregulated or downregulated with one day or one week of anti‐IFNAR1 treatment in aged mouse monocytes. Gene in red colors were genes that were highly expressed in MO‐ifn cells. (d) Dot plots showing representative differentially expressed genes. Gene in red colors were highly expressed in MO‐ifn cells. Data are from 5 mice pooled, per group
FIGURE 4 Neutralizing anti‐IFNAR1 treatment alters the transcriptome of aged lung monocytes. (a) Ly6C+ monocytes and Ly6G+ neutrophils from lungs of aged mice treated with isotype or anti‐IFNAR1 antibody were sorted, and single‐cell RNA sequencing was carried out. UMAP plot reveals two populations of cells. (b) Venn diagram showing the overlap between genes either upregulated or downregulated with one day or one week of anti‐IFNAR1 treatment in aged mouse monocytes. p value < 0.05, and absolute log (FC) value >0.3 were used as threshold to identify differentially expressed genes. Genes in red colors were highly expressed in MO‐ifn cells. (c) List of genes that were upregulated or downregulated with one day or one week of anti‐IFNAR1 treatment in aged mouse monocytes. Gene in red colors were genes that were highly expressed in MO‐ifn cells. (d) Dot plots showing representative differentially expressed genes. Gene in red colors were highly expressed in MO‐ifn cells. Data are from 5 mice pooled, per groupCC BY · PubMed Central
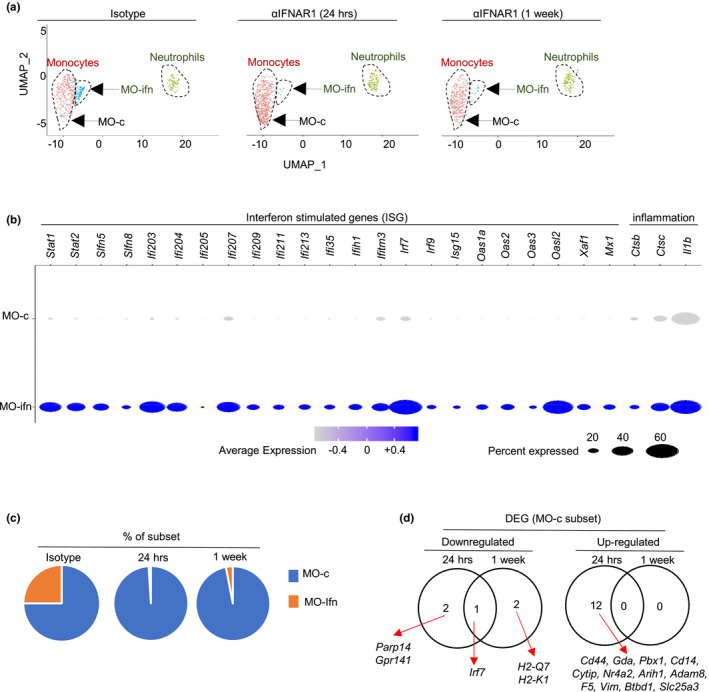
FIGURE 5 Neutralizing anti‐IFNAR1 treatment differentially alters the transcriptomes of MO‐ifn and MO‐c cells. Single‐cell RNA‐seq (scRNA‐seq) was performed with Ly6C+ monocytes and Ly6G+ neutrophils sorted from lungs of aged female mice treated with isotype or anti‐IFNAR1 antibody. (a) Unsupervised clustering by UMAP analysis. (b) Dot plots showing genes that were highly expressed in MO‐ifn cells. p value < 0.05, and absolute log (FC) value >0.3 were used as threshold to identify differentially expressed genes. (c) Percentages of MO‐ifn and MO‐cells in aged mice treated with isotype or anti‐IFNAR1 antibody. (d) List of genes that were differentially expressed with aging in MO‐c cells. Data are from 5 mice pooled, per group
FIGURE 5 Neutralizing anti‐IFNAR1 treatment differentially alters the transcriptomes of MO‐ifn and MO‐c cells. Single‐cell RNA‐seq (scRNA‐seq) was performed with Ly6C+ monocytes and Ly6G+ neutrophils sorted from lungs of aged female mice treated with isotype or anti‐IFNAR1 antibody. (a) Unsupervised clustering by UMAP analysis. (b) Dot plots showing genes that were highly expressed in MO‐ifn cells. p value < 0.05, and absolute log (FC) value >0.3 were used as threshold to identify differentially expressed genes. (c) Percentages of MO‐ifn and MO‐cells in aged mice treated with isotype or anti‐IFNAR1 antibody. (d) List of genes that were differentially expressed with aging in MO‐c cells. Data are from 5 mice pooled, per groupCC BY · PubMed Central
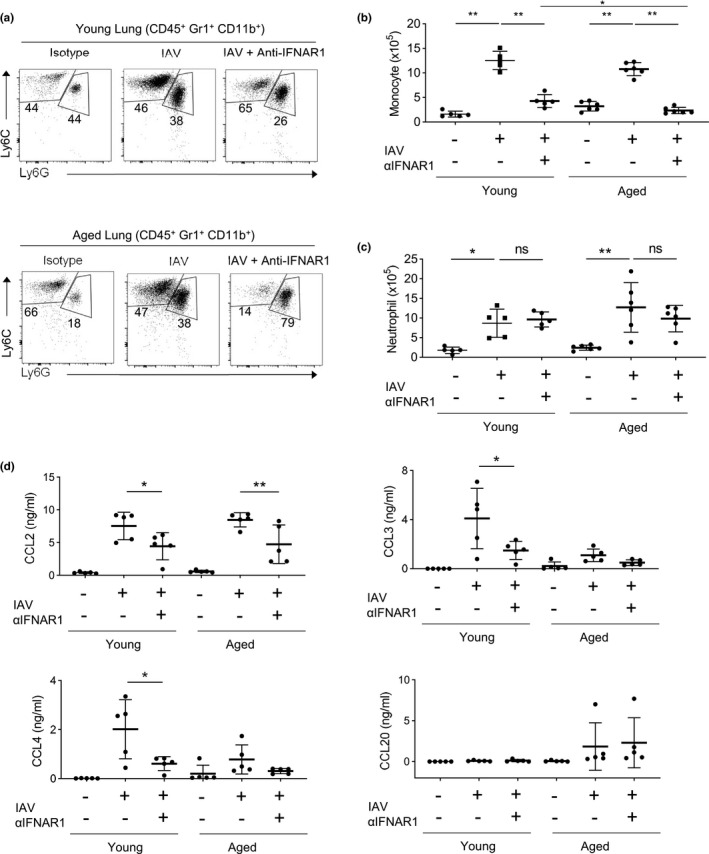
FIGURE 6 Aging monocytes further expand during Influenza infection in an IFNAR1‐dependent manner. Young and aged mice were either treated with anti‐IFNAR1 and/or infected with IAV and sacrificed on day 6 of infection. (a) Representative flow cytometry plots showing lung monocytes (CD45+ Gr1+ CD11b+ Ly6G− Ly6C+) and neutrophils (CD45+ Gr1+ CD11b+ Ly6C− Ly6G+). (b) Total number of lung monocytes. (c) Total number of lung neutrophils. (d) Chemokine concentrations from the lung homogenates. Data are from 5–6 mice per group, two independent experiments. Error bars are mean ± SD. *, p < 0.05; **, p < 0.01
FIGURE 6 Aging monocytes further expand during Influenza infection in an IFNAR1‐dependent manner. Young and aged mice were either treated with anti‐IFNAR1 and/or infected with IAV and sacrificed on day 6 of infection. (a) Representative flow cytometry plots showing lung monocytes (CD45+ Gr1+ CD11b+ Ly6G− Ly6C+) and neutrophils (CD45+ Gr1+ CD11b+ Ly6C− Ly6G+). (b) Total number of lung monocytes. (c) Total number of lung neutrophils. (d) Chemokine concentrations from the lung homogenates. Data are from 5–6 mice per group, two independent experiments. Error bars are mean ± SD. *, p < 0.05; **, p < 0.01CC BY · PubMed Central

Verification

Claims the paper makes

The claims and statistics of this paper haven’t been checked yet.

Run the check — free, no account needed. It reads the open-access text and checks the sources it cites.

A few free checks a day · papers already verified open instantly · results are public

Claims other papers make about this one

Each is checked against this paper’s own text: does it say what the citing paper says it does?

Self-check

Percentages, sums and reported differences re-computed from the paper’s own numbers.

The self-check needs the paper’s full text.

Citations

Cites

Show all 13 references

Research works printed but not linked: 47

  1. 10.1089/ars.2016.6691 · DOI
  2. 10.1016/j.cellimm.2012.01.001 · DOI · Paper page
  3. 10.1038/s41467‐019‐08831‐9 · DOI · Paper page
  4. 10.1146/annurev‐immunol‐042718‐041728 · DOI
  5. 10.1016/j.chest.2018.09.003 · DOI
  6. 10.1038/nature04651 · DOI
  7. 10.1016/j.chom.2016.01.007 · DOI
  8. 10.1016/j.imlet.2020.12.003 · DOI · Paper page
  9. 10.1111/j.0818‐9641.2004.01242.x · DOI
  10. 10.3390/jcm7090244 · DOI
  11. 10.1084/jem.20101158 · DOI · Paper page
  12. 10.1182/blood.V87.6.2095.bloodjournal8762095 · DOI · Paper page
  13. 10.1111/acel.13019 · DOI
  14. 10.1111/j.1749‐6632.2000.tb06651.x · DOI · Paper page
  15. 10.1084/jem.20190915 · DOI
  16. 10.1128/JVI.00333‐14 · DOI
  17. 10.1084/jem.20140825 · DOI
  18. 10.1074/jbc.M115.707109 · DOI
  19. 10.1038/s41590‐019‐0445‐7 · DOI
  20. 10.1111/j.1474‐9726.2012.00851.x · DOI · Paper page
  21. 10.1164/rccm.201203‐0508OC · DOI
  22. 10.4049/jimmunol.0903300 · DOI
  23. 10.1161/ATVBAHA.109.197442 · DOI
  24. 10.1172/JCI34694 · DOI
  25. 10.1016/j.pharmthera.2018.05.011 · DOI
  26. 10.1084/jem.20160880 · DOI
  27. 10.2353/ajpath.2009.090328 · DOI
  28. 10.1186/s12929‐014‐0099‐6 · DOI
  29. 10.2147/CIA.S51152 · DOI
  30. 10.3389/fimmu.2017.00259 · DOI
  31. 10.1186/s12979‐020‐00181‐1 · DOI
  32. 10.4049/jimmunol.1001866 · DOI
  33. 10.1039/c8fo01420e · DOI
  34. 10.1186/s12979‐019‐0143‐1 · DOI · Paper page
  35. 10.1038/nri1604 · DOI
  36. 10.1371/journal.ppat.1005368 · DOI
  37. 10.1038/ncomms6366 · DOI
  38. 10.1080/1744666X.2017.1384313 · DOI
  39. 10.1146/annurev‐immunol‐032713‐120231 · DOI · Paper page
  40. 10.1016/j.coviro.2014.03.006 · DOI
  41. 10.1371/journal.ppat.1001304 · DOI
  42. 10.1089/jir.2006.26.804 · DOI
  43. 10.1016/j.immuni.2006.08.007 · DOI
  44. 10.1007/s12038‐011‐9169‐z · DOI
  45. 10.1016/j.cell.2019.05.031 · DOI · Paper page
  46. 10.1016/j.jinf.2020.03.019 · DOI
  47. 10.1189/jlb.5A0717‐302 · DOI

Cited by

Sorted by citations

Metadata

Authors
D’Souza, S. S., Zhang, Y., Bailey, J. T., Fung, I. T. H., Kuentzel, M. L., Chittur, S. V., & Yang, Q.
Affiliations
  • Department of Immunology and Microbial Disease Albany Medical College Albany NY USA
  • Center for Functional Genomics University at Albany‐SUNY Rensselaer NY USA
Venue
Aging Cell
Publisher
Wiley
Published
2021-09-21
Volume
20
Issue
10
ISSN
  • 1474-9718
  • 1474-9726
Cited by
32
References
13
Language
en
Funders
  • National Institutes of Health (R01HL155021)
  • National Heart, Lung, and Blood Institute (R01HL137813)
  • National Institute on Aging (R01AG057782)

About these checks

Registry, retraction, Cites and statistics results are computed, not judged, with one exception: a printed reference that no index lists is read once by a model before it counts as a citation error. Claims are extracted by a model and kept only when their quote appears verbatim in the text; each cited source is then checked, with a model’s help, for whether it says what the claim relies on. Those verdicts can be wrong — read the claim’s quote and the cited source before relying on one.

Statistics and arithmetic are recomputed, not judged.

Confidence bands are shown only for fields calibrated on our annotated test set. None is calibrated yet, so no band is shown.

What counts as a claim ›How we measure confidence ›How we check this ›

Are you an author, or do you see a problem with this page? Request a review