Cited by 63

The DOI matches its Crossref record; 9 of the 9 references it cites were found in a registry or an index.

Dietary citrate supplementation enhances longevity, metabolic health, and memory performance through promoting ketogenesis

Fan, Shou‐Zen, Lin, Cheng‐Sheng, Wei, Yu‐Wen, Yeh, Sheng‐Rong, Tsai, Yi‐Hsuan, Lee, Andrew Chengyu, Lin, Wei‐Sheng, Wang, Pei‐Yu·2021·Aging Cell

Abstract

Citrate is an essential substrate for energy metabolism that plays critical roles in regulating cell growth and survival. However, the action of citrate in regulating metabolism, cognition, and aging at the organismal level remains poorly understood. Here, we report that dietary supplementation with citrate significantly reduces energy status and extends lifespan in Drosophila melanogaster. Our genetic studies in fruit flies implicate a molecular mechanism associated with AMP‐activated protein kinase (AMPK), target of rapamycin (TOR), and ketogenesis. Mice fed a high‐fat diet that supplemented with citrate or the ketone body β‐hydroxybutyrate (βOHB) also display improved metabolic health and memory. These results suggest that dietary citrate supplementation may prove to be a useful intervention in the future treatment of age‐related dysfunction.

Overview

The claims and statistics of this paper haven’t been checked yet.

Run the check — free, no account needed. It reads the open-access text and checks the sources it cites.

A few free checks a day · papers already verified open instantly · results are public

Integrity signals

Registry

Crossref · 10.1111/acel.13510

Cites

9 of 9 references verified0 citation errors · 0 not checkable

Statistics

Figures

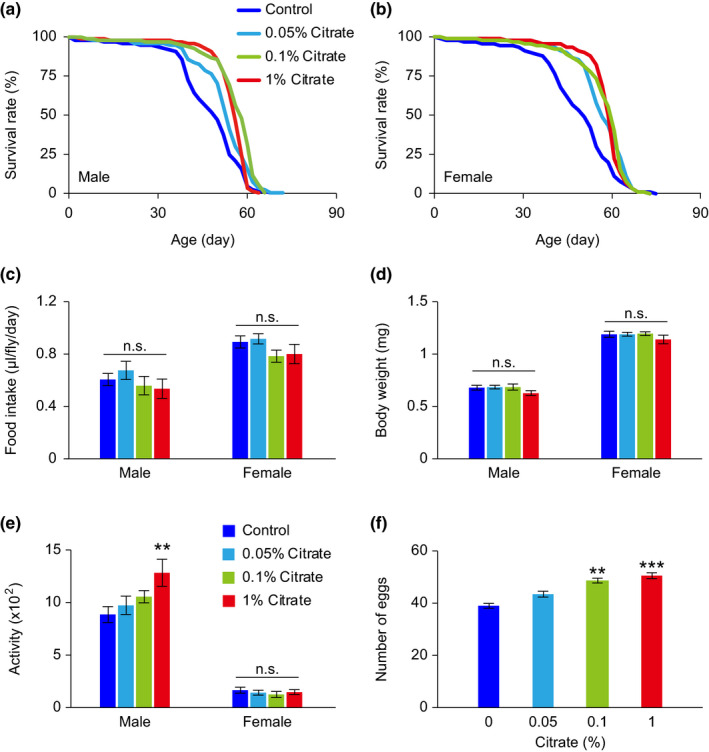
FIGURE 1 Physiological status of w1118 Drosophila melanogaster treated with various concentrations of citrate. (a, b) Lifespans of male (a) and female (b) w1118 flies treated with different concentrations of citrate. (c–f) Food intake (c), body weight (d), locomotor activity (e), and fecundity (f) of flies treated with different concentrations of citrate for 10 days. Detailed statistical analyses for the lifespans are shown in Table S2. The other data are expressed as mean ± SEM (n = 10–42 vials, 10 flies per vial). Not significant (n.s.), **p < 0.01, ***p < 0.001, compared to the control group by one‐way ANOVA with Fisher's LSD post hoc test
FIGURE 1 Physiological status of w1118 Drosophila melanogaster treated with various concentrations of citrate. (a, b) Lifespans of male (a) and female (b) w1118 flies treated with different concentrations of citrate. (c–f) Food intake (c), body weight (d), locomotor activity (e), and fecundity (f) of flies treated with different concentrations of citrate for 10 days. Detailed statistical analyses for the lifespans are shown in Table S2. The other data are expressed as mean ± SEM (n = 10–42 vials, 10 flies per vial). Not significant (n.s.), **p < 0.01, ***p < 0.001, compared to the control group by one‐way ANOVA with Fisher's LSD post hoc testCC BY · PubMed Central
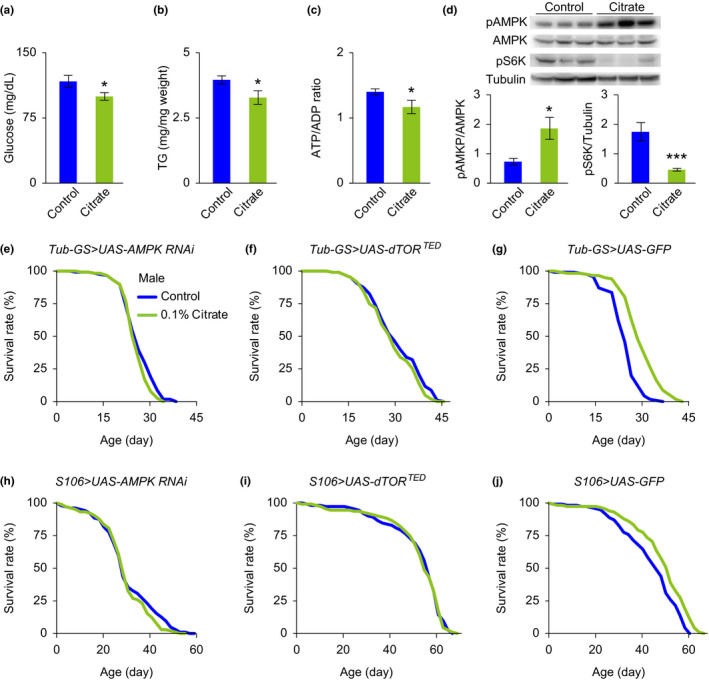
FIGURE 2 Citrate‐induced lifespan extension is associated with the AMPK and TOR pathways. (a–c) The levels of hemolymph glucose (a), total triglyceride (b), and ATP/ADP ratio (c) of male w1118 flies treated with vehicle or 0.1% citrate for 10 days. (d) Representative Western blots and quantitative analyses showing that phosphorylated AMPK and phosphorylated S6K are upregulated and downregulated, respectively, in male w1118 flies treated with 0.1% citrate for 10 days, compared with vehicle‐treated controls. (e, f) Lifespans of male mutant flies with RU486‐induced systemic inhibition of AMPK (e, Tub‐GS>UAS‐AMPK RNAi) and dTOR (f, Tub‐GS>UAS‐dTORTED ), treated with vehicle or 0.1% citrate. (h, i) Lifespans of male mutant flies with RU486‐induced fat body‐specific inhibition of AMPK (h, S106>UAS‐AMPK RNAi) and dTOR (i, S106>UAS‐dTORTED ), treated with vehicle or 0.1% citrate. (g, j) Lifespans of male mutant flies with RU486‐induced systemic (g, Tub‐GS>UAS‐GFP) and fat body‐specific (j, S106>UAS‐GFP) overexpression of GFP, treated with vehicle or 0.1% citrate. Detailed statistical analyses for the lifespans are shown in Table S2. The other data are expressed as mean ± SEM (n = 6–9 samples). *p < 0.05, ***p < 0.001 compared to the control group by Student's t test
FIGURE 2 Citrate‐induced lifespan extension is associated with the AMPK and TOR pathways. (a–c) The levels of hemolymph glucose (a), total triglyceride (b), and ATP/ADP ratio (c) of male w1118 flies treated with vehicle or 0.1% citrate for 10 days. (d) Representative Western blots and quantitative analyses showing that phosphorylated AMPK and phosphorylated S6K are upregulated and downregulated, respectively, in male w1118 flies treated with 0.1% citrate for 10 days, compared with vehicle‐treated controls. (e, f) Lifespans of male mutant flies with RU486‐induced systemic inhibition of AMPK (e, Tub‐GS>UAS‐AMPK RNAi) and dTOR (f, Tub‐GS>UAS‐dTORTED ), treated with vehicle or 0.1% citrate. (h, i) Lifespans of male mutant flies with RU486‐induced fat body‐specific inhibition of AMPK (h, S106>UAS‐AMPK RNAi) and dTOR (i, S106>UAS‐dTORTED ), treated with vehicle or 0.1% citrate. (g, j) Lifespans of male mutant flies with RU486‐induced systemic (g, Tub‐GS>UAS‐GFP) and fat body‐specific (j, S106>UAS‐GFP) overexpression of GFP, treated with vehicle or 0.1% citrate. Detailed statistical analyses for the lifespans are shown in Table S2. The other data are expressed as mean ± SEM (n = 6–9 samples). *p < 0.05, ***p < 0.001 compared to the control group by Student's t testCC BY · PubMed Central
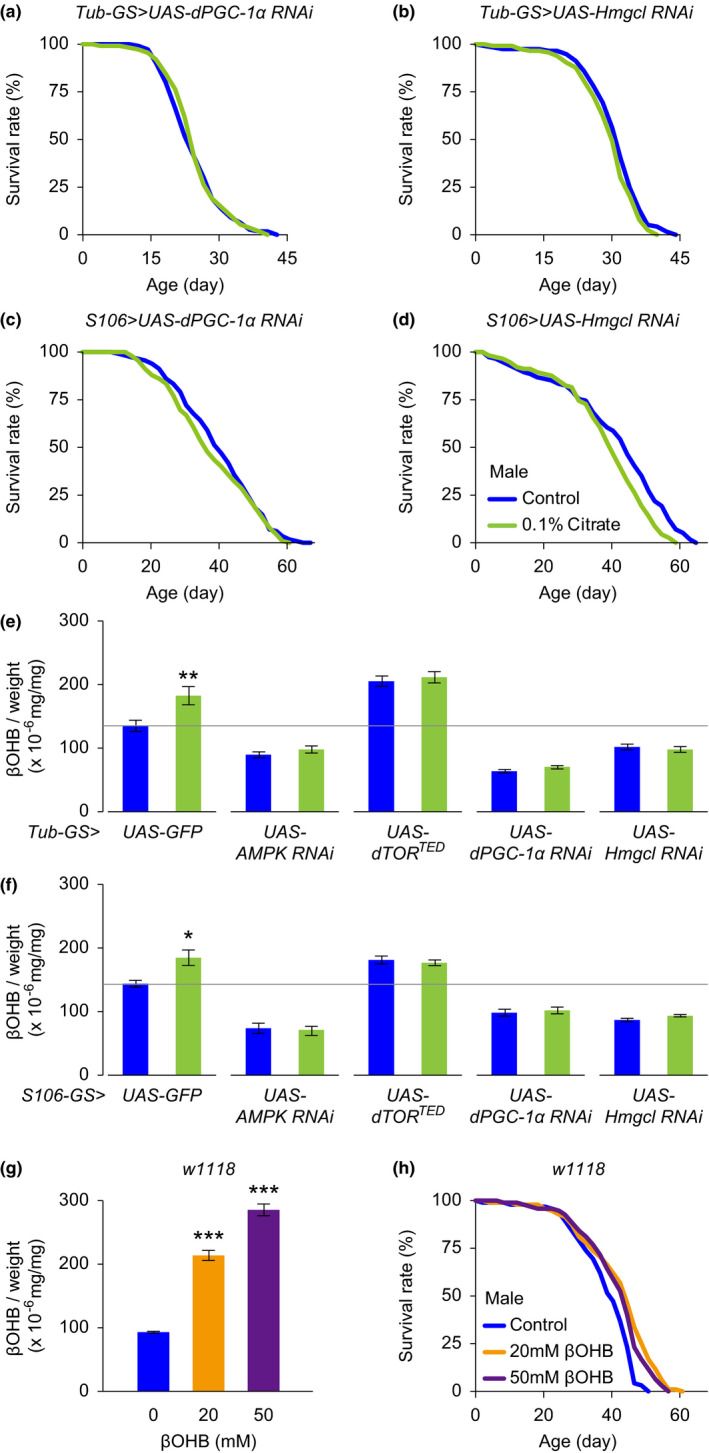
FIGURE 3 Ketogenesis mediates citrate‐induced lifespan extension. (a, b) Lifespans of male mutant flies with RU486‐induced systemic inhibition of PGC‐1α (a, Tub‐GS>UAS‐PGC‐1α RNAi) and Hmgcl (b, Tub‐GS>UAS‐Hmgcl RNAi), treated with vehicle or 0.1% citrate. (c, d) Lifespans of male mutant flies with RU486‐induced fat body‐specific inhibition of PGC‐1α (c, S106>UAS‐PGC‐1α RNAi) and Hmgcl (d, S106>UAS‐Hmgcl RNAi), treated with vehicle or 0.1% citrate. (e, f) Citrate treatment for 10 days increases βOHB levels in male genetic control flies (Tub‐GS/S106>UAS‐GFP), but not in male mutant flies with systemic and fat body‐specific overexpression of AMPK RNAi (Tub‐GS/S106>UAS‐AMPK RNAi), dTORTED (Tub‐GS/S106>UAS‐dTORTED ), PGC‐1α RNAi (Tub‐GS/S106>UAS‐PGC‐1α RNAi), and HMGL RNAi (Tub‐GS/S106>UAS‐Hmgcl RNAi). (g) Dietary βOHB supplementation for 10 days dose‐dependently increases βOHB in male flies. (h) Lifespans of male w1118 flies treated with various concentrations of βOHB. Detailed statistical analyses for the lifespans are shown in Table S2 and S3. The other data are expressed as mean ± SEM (n = 9–10 samples). *p < 0.05, **p < 0.01, ***p < 0.001 compared to the control group by Student's t test or one‐way ANOVA with Fisher's LSD post hoc test
FIGURE 3 Ketogenesis mediates citrate‐induced lifespan extension. (a, b) Lifespans of male mutant flies with RU486‐induced systemic inhibition of PGC‐1α (a, Tub‐GS>UAS‐PGC‐1α RNAi) and Hmgcl (b, Tub‐GS>UAS‐Hmgcl RNAi), treated with vehicle or 0.1% citrate. (c, d) Lifespans of male mutant flies with RU486‐induced fat body‐specific inhibition of PGC‐1α (c, S106>UAS‐PGC‐1α RNAi) and Hmgcl (d, S106>UAS‐Hmgcl RNAi), treated with vehicle or 0.1% citrate. (e, f) Citrate treatment for 10 days increases βOHB levels in male genetic control flies (Tub‐GS/S106>UAS‐GFP), but not in male mutant flies with systemic and fat body‐specific overexpression of AMPK RNAi (Tub‐GS/S106>UAS‐AMPK RNAi), dTORTED (Tub‐GS/S106>UAS‐dTORTED ), PGC‐1α RNAi (Tub‐GS/S106>UAS‐PGC‐1α RNAi), and HMGL RNAi (Tub‐GS/S106>UAS‐Hmgcl RNAi). (g) Dietary βOHB supplementation for 10 days dose‐dependently increases βOHB in male flies. (h) Lifespans of male w1118 flies treated with various concentrations of βOHB. Detailed statistical analyses for the lifespans are shown in Table S2 and S3. The other data are expressed as mean ± SEM (n = 9–10 samples). *p < 0.05, **p < 0.01, ***p < 0.001 compared to the control group by Student's t test or one‐way ANOVA with Fisher's LSD post hoc testCC BY · PubMed Central
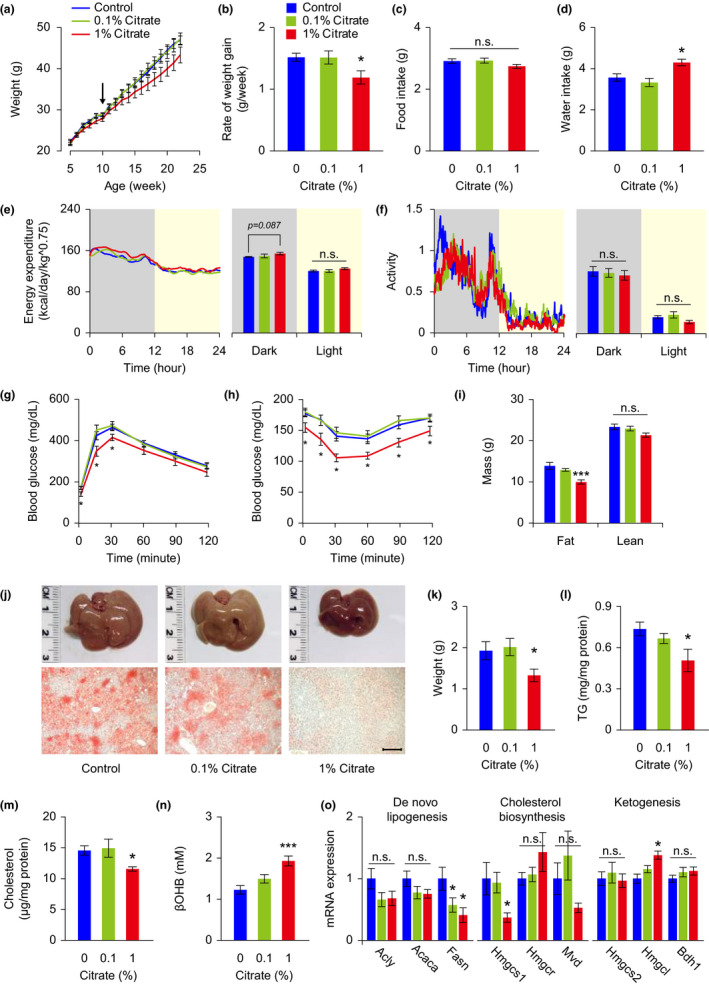
FIGURE 4 Citrate administration improves metabolic health in mice fed on a high‐fat diet. Mice fed on a high‐fat diet were treated with various concentrations of citrate from 10 weeks of age (arrow). Metabolic health of mice was examined between 20 and 28 weeks of age. (a–d) Body weight (a), rate of weight gain (b), food intake (c), and water consumption (d) were monitored and analyzed. (e, f) Energy expenditure (e), and spontaneous locomotor activity (f) were analyzed in mice receiving vehicle and citrate treatments. (g, h) Glucose tolerance test (g) and insulin tolerance test (h) were conducted in mice receiving vehicle and citrate treatments. (i) Body composition was analyzed in mice receiving vehicle and citrate treatments. (j–m) Mice receiving 1% citrate treatment showed reduced liver weight (j, k) and decreased hepatic lipid accumulation, including reduced oil red O staining (j, lower panels) and lower levels of triglyceride (TG, l) and cholesterol (m). (n) Citrate administration dose‐dependently enhanced βOHB levels in the blood. (o) mRNA measurements of genes associated with de novo lipogenesis, cholesterol biosynthesis, and ketogenesis, from livers of mice receiving vehicle and citrate treatments. ATP citrate lyase (Acly), acetyl‐CoA carboxylase (Acaca), fatty acid synthase (Fasn), HMG‐CoA synthetase 1 (Hmgcs1), HMG‐CoA reductase (Hmgr), mevalonate diphosphate decarboxylase (Mvd), HMG‐CoA synthetase 2 (Hmgcs2), HMG‐CoA lyase (Hmgcl), β‐hydroxybutyrate dehydrogenase 1 (Bdh1). Data are expressed as mean ± SEM (n = 8 mice for each group in the whole‐body metabolic analyses, n = 10 mice for each group in all the other tests). Not significant (n.s.), *p < 0.05, **p < 0.01, ***p < 0.001 compared to the control group by one‐way ANOVA with Fisher's LSD post hoc test. Scale bar = 200 μm
FIGURE 4 Citrate administration improves metabolic health in mice fed on a high‐fat diet. Mice fed on a high‐fat diet were treated with various concentrations of citrate from 10 weeks of age (arrow). Metabolic health of mice was examined between 20 and 28 weeks of age. (a–d) Body weight (a), rate of weight gain (b), food intake (c), and water consumption (d) were monitored and analyzed. (e, f) Energy expenditure (e), and spontaneous locomotor activity (f) were analyzed in mice receiving vehicle and citrate treatments. (g, h) Glucose tolerance test (g) and insulin tolerance test (h) were conducted in mice receiving vehicle and citrate treatments. (i) Body composition was analyzed in mice receiving vehicle and citrate treatments. (j–m) Mice receiving 1% citrate treatment showed reduced liver weight (j, k) and decreased hepatic lipid accumulation, including reduced oil red O staining (j, lower panels) and lower levels of triglyceride (TG, l) and cholesterol (m). (n) Citrate administration dose‐dependently enhanced βOHB levels in the blood. (o) mRNA measurements of genes associated with de novo lipogenesis, cholesterol biosynthesis, and ketogenesis, from livers of mice receiving vehicle and citrate treatments. ATP citrate lyase (Acly), acetyl‐CoA carboxylase (Acaca), fatty acid synthase (Fasn), HMG‐CoA synthetase 1 (Hmgcs1), HMG‐CoA reductase (Hmgr), mevalonate diphosphate decarboxylase (Mvd), HMG‐CoA synthetase 2 (Hmgcs2), HMG‐CoA lyase (Hmgcl), β‐hydroxybutyrate dehydrogenase 1 (Bdh1). Data are expressed as mean ± SEM (n = 8 mice for each group in the whole‐body metabolic analyses, n = 10 mice for each group in all the other tests). Not significant (n.s.), *p < 0.05, **p < 0.01, ***p < 0.001 compared to the control group by one‐way ANOVA with Fisher's LSD post hoc test. Scale bar = 200 μmCC BY · PubMed Central
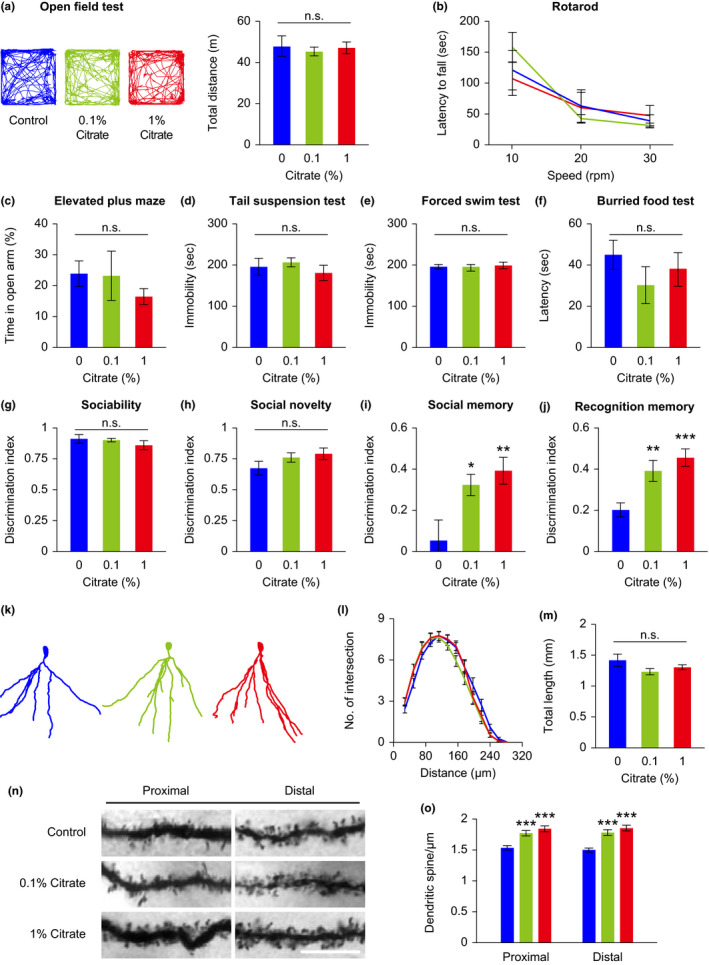
FIGURE 5 Citrate administration affects mouse cognitive function. Mice fed on a high‐fat diet were treated with different concentrations of citrate from 10 weeks of age. Behavioral tests of mice were carried out between 16 and 20 weeks of age. (a–j) Mice were subjected to the open field test (a, representative moving path and total travel distance), rotarod test (b), elevated plus maze test (c), tail suspension test (d), forced swim test (e), buried food test (f), 3‐chamber social test (g–i), and novel object recognition test (j). (k–o) Structural analyses of hippocampal DG granule cells from vehicle‐ and citrate‐treated mice were analyzed at 28 weeks of age. DG granule cells were reconstructed (k), and the dendritic profile (l) and dendritic length (m) were analyzed. Representative micrographs of proximal (<50 μm from the soma) and distal (>150 μm from the soma) dendrites (n), and quantitative spine density (o) of DG granule cells. Data are expressed as mean ± SEM (n = 10 mice for behavioral tests, n = 29–30 neurons, and 58–60 dendritic segments for structural analyses). Not significant (n.s.), *p < 0.05, **p < 0.01, ***p < 0.001 compared to the control group by one‐way ANOVA with Fisher's LSD post hoc test. Scale bar = 10 μm
FIGURE 5 Citrate administration affects mouse cognitive function. Mice fed on a high‐fat diet were treated with different concentrations of citrate from 10 weeks of age. Behavioral tests of mice were carried out between 16 and 20 weeks of age. (a–j) Mice were subjected to the open field test (a, representative moving path and total travel distance), rotarod test (b), elevated plus maze test (c), tail suspension test (d), forced swim test (e), buried food test (f), 3‐chamber social test (g–i), and novel object recognition test (j). (k–o) Structural analyses of hippocampal DG granule cells from vehicle‐ and citrate‐treated mice were analyzed at 28 weeks of age. DG granule cells were reconstructed (k), and the dendritic profile (l) and dendritic length (m) were analyzed. Representative micrographs of proximal (<50 μm from the soma) and distal (>150 μm from the soma) dendrites (n), and quantitative spine density (o) of DG granule cells. Data are expressed as mean ± SEM (n = 10 mice for behavioral tests, n = 29–30 neurons, and 58–60 dendritic segments for structural analyses). Not significant (n.s.), *p < 0.05, **p < 0.01, ***p < 0.001 compared to the control group by one‐way ANOVA with Fisher's LSD post hoc test. Scale bar = 10 μmCC BY · PubMed Central
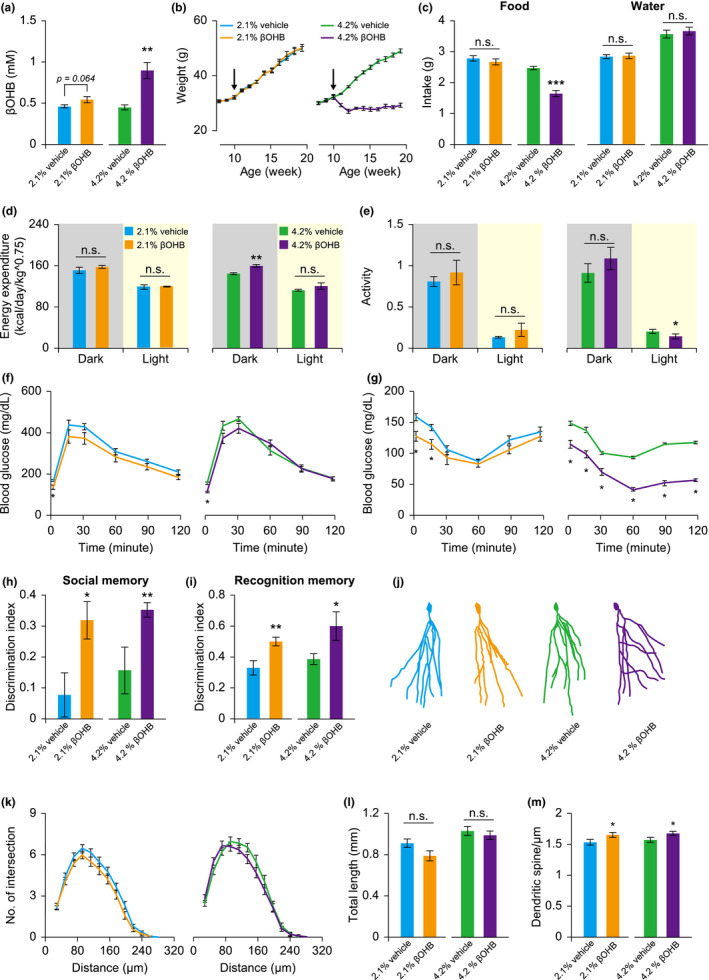
FIGURE 6 βOHB administration improves metabolic health and memory performance of mice. Mice fed on a high‐fat diet were treated with different concentrations of βOHB and/or vehicle from 10 weeks of age (arrow). Metabolic health and behavioral tests were carried out between 16 and 24 weeks of age. (a–c) Circulating βOHB (a), body weight (b), and food and water intake (c) were monitored and analyzed. (d, e) Energy expenditure (d), and spontaneous locomotor activity (e) were analyzed in mice receiving vehicle and βOHB treatments. (f, g) Glucose tolerance test (f) and insulin tolerance test (g) were conducted in mice receiving vehicle and βOHB treatments. (h, i) Memory performance of mice was evaluated using a 3‐chamber social test (h) and novel object recognition test (i), respectively. (j–m) DG granule cells were reconstructed (j), and the dendritic profile (k), dendritic length (l), and spine density of distal dendrites (m) were analyzed. Data are expressed as mean ± SEM (n = 4–5 for whole‐body metabolic analyses, n = 8–10 mice for behavioral and the other tests, n = 26–39 neurons, and 30–31 dendritic segments for structural analyses). Not significant (n.s.), *p < 0.05, **p < 0.01, ***p < 0.001 compared to the control group by Student's t test
FIGURE 6 βOHB administration improves metabolic health and memory performance of mice. Mice fed on a high‐fat diet were treated with different concentrations of βOHB and/or vehicle from 10 weeks of age (arrow). Metabolic health and behavioral tests were carried out between 16 and 24 weeks of age. (a–c) Circulating βOHB (a), body weight (b), and food and water intake (c) were monitored and analyzed. (d, e) Energy expenditure (d), and spontaneous locomotor activity (e) were analyzed in mice receiving vehicle and βOHB treatments. (f, g) Glucose tolerance test (f) and insulin tolerance test (g) were conducted in mice receiving vehicle and βOHB treatments. (h, i) Memory performance of mice was evaluated using a 3‐chamber social test (h) and novel object recognition test (i), respectively. (j–m) DG granule cells were reconstructed (j), and the dendritic profile (k), dendritic length (l), and spine density of distal dendrites (m) were analyzed. Data are expressed as mean ± SEM (n = 4–5 for whole‐body metabolic analyses, n = 8–10 mice for behavioral and the other tests, n = 26–39 neurons, and 30–31 dendritic segments for structural analyses). Not significant (n.s.), *p < 0.05, **p < 0.01, ***p < 0.001 compared to the control group by Student's t testCC BY · PubMed Central

Verification

Claims the paper makes

The claims and statistics of this paper haven’t been checked yet.

Run the check — free, no account needed. It reads the open-access text and checks the sources it cites.

A few free checks a day · papers already verified open instantly · results are public

Claims other papers make about this one

Each is checked against this paper’s own text: does it say what the citing paper says it does?

Self-check

Percentages, sums and reported differences re-computed from the paper’s own numbers.

The self-check needs the paper’s full text.

Citations

Cites

Show all 9 references

Research works printed but not linked: 36

  1. 10.1016/j.cmet.2011.06.009 · DOI
  2. 10.1111/j.1432-1033.1989.tb15186.x · DOI
  3. 10.1172/JCI5392 · DOI
  4. 10.1038/nature13264 · DOI
  5. 10.1530/JOE-17-0505 · DOI
  6. 10.1186/s12863-015-0167-2 · DOI
  7. 10.18632/aging.100683 · DOI
  8. 10.1093/gerona/glaa203 · DOI
  9. 10.1093/gerona/glv094 · DOI
  10. 10.1515/hsz-2013-0271 · DOI
  11. 10.1073/pnas.0702726104 · DOI
  12. 10.1126/science.1115535 · DOI · Paper page
  13. 10.1074/jbc.M110.138198 · DOI
  14. 10.2337/db13-1090 · DOI
  15. 10.1007/s11357-013-9606-z · DOI
  16. 10.1096/fsb2fj201800067r · DOI
  17. Linford N. J., 2013, Measurement of lifespan in Drosophila melanogaster, Journal of Visualized Experiments: JoVE, e50068
  18. Lu Y., 2011, Citrate induces apoptotic cell death: A promising way to treat gastric carcinoma?, Anticancer Research, 31, 797
  19. 10.1093/gerona/glu198 · DOI
  20. 10.1016/j.cmet.2019.01.018 · DOI · Paper page
  21. Panchala K., 2016, Dietary Supplementation of Citric acid (monohydrate) Improves Health Span in Drosophila melanogaster, Journal of Applied Biology and Biotechnology, 4, 60
  22. 10.1038/268462a0 · DOI
  23. 10.1126/science.290.5499.2137 · DOI
  24. 10.18632/aging.100791 · DOI
  25. 10.1126/science.1227166 · DOI · Paper page
  26. 10.7554/eLife.15092 · DOI · Paper page
  27. 10.1016/0047-6374(94)90104-X · DOI · Paper page
  28. 10.1096/fj.11-200410 · DOI
  29. 10.1016/j.cmet.2012.12.006 · DOI
  30. 10.1016/j.tem.2014.02.006 · DOI
  31. 10.1371/journal.pbio.2007097 · DOI
  32. 10.1073/pnas.0508304102 · DOI
  33. 10.1073/pnas.0904115106 · DOI
  34. 10.1093/jn/116.4.641 · DOI
  35. 10.1111/j.1474-9726.2009.00527.x · DOI
  36. Zhang X., 2009, Effect of citrate on malignant pleural mesothelioma cells: a synergistic effect with cisplatin, Anticancer Research, 29, 1249

Cited by

Sorted by citations

Metadata

Authors
Fan, S., Lin, C., Wei, Y., Yeh, S., Tsai, Y., Lee, A. C., Lin, W., & Wang, P.
Affiliations
  • Department of Anesthesiology National Taiwan University Hospital National Taiwan University Taipei Taiwan
  • Graduate Institute of Brain and Mind Sciences College of Medicine National Taiwan University Taipei Taiwan
  • Department of Pediatrics Taipei Veterans General Hospital Taipei Taiwan
Venue
Aging Cell
Publisher
Wiley
Published
2021-10-31
Volume
20
Issue
12
ISSN
  • 1474-9718
  • 1474-9726
Cited by
63
References
9
Language
en
Funders
Ministry of Science and Technology, Taiwan (107‐2410‐H‐002‐118, 108‐2314‐B‐002‐092, 108‐2410‐H‐002‐102, 109‐2311‐B‐002‐007)

About these checks

Registry, retraction, Cites and statistics results are computed, not judged, with one exception: a printed reference that no index lists is read once by a model before it counts as a citation error. Claims are extracted by a model and kept only when their quote appears verbatim in the text; each cited source is then checked, with a model’s help, for whether it says what the claim relies on. Those verdicts can be wrong — read the claim’s quote and the cited source before relying on one.

Statistics and arithmetic are recomputed, not judged.

Confidence bands are shown only for fields calibrated on our annotated test set. None is calibrated yet, so no band is shown.

What counts as a claim ›How we measure confidence ›How we check this ›

Are you an author, or do you see a problem with this page? Request a review