

The DOI matches its Crossref record; 10 of the 10 references it cites were found in a registry or an index.
Sex- and strain-specific effects of mitochondrial uncoupling on age-related metabolic diseases in high-fat diet-fed mice
Abstract
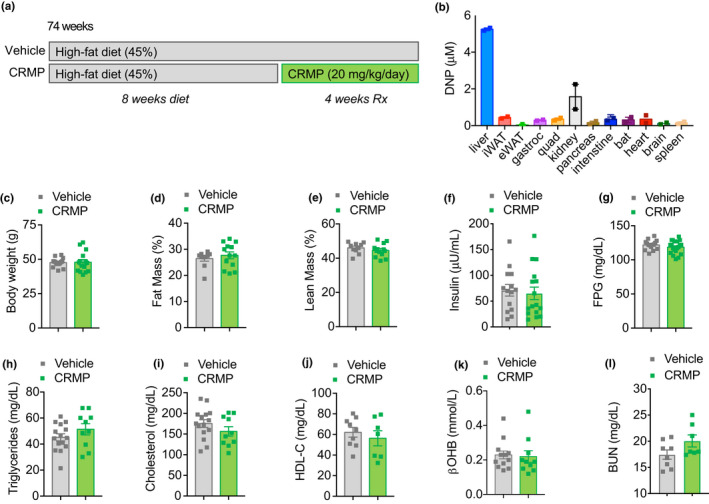
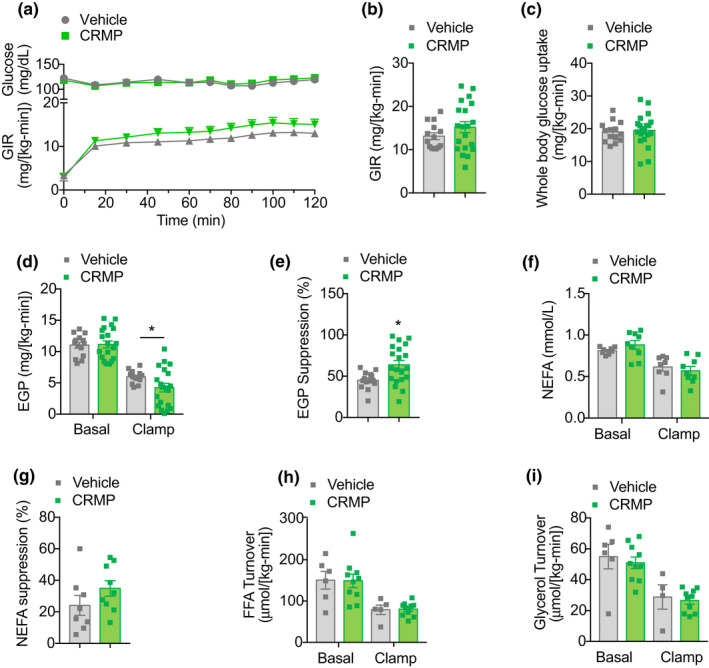
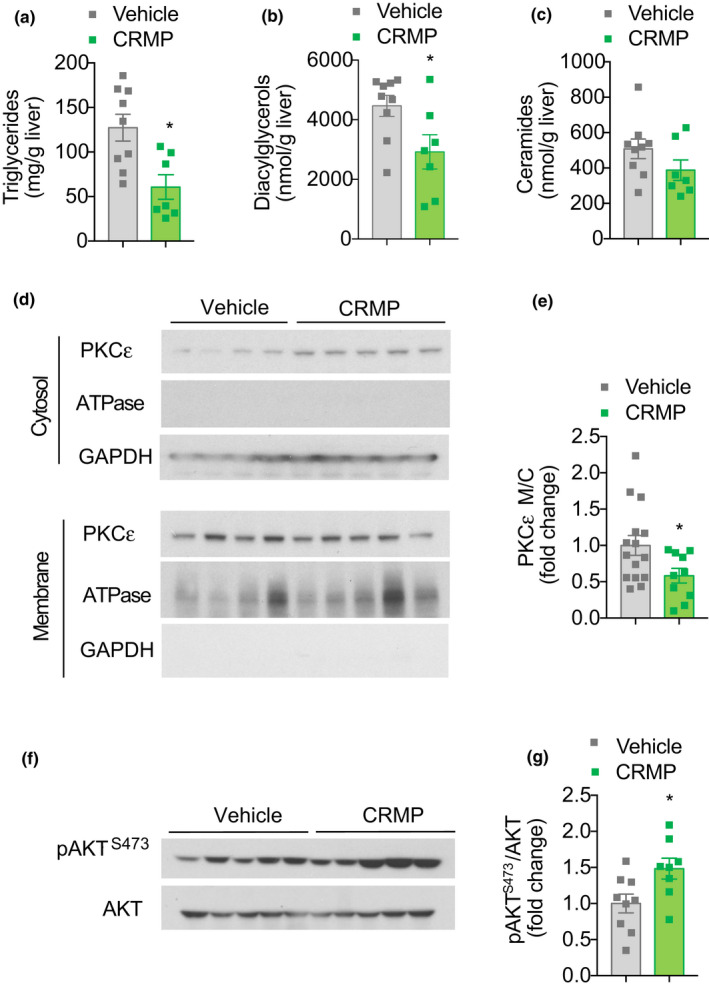
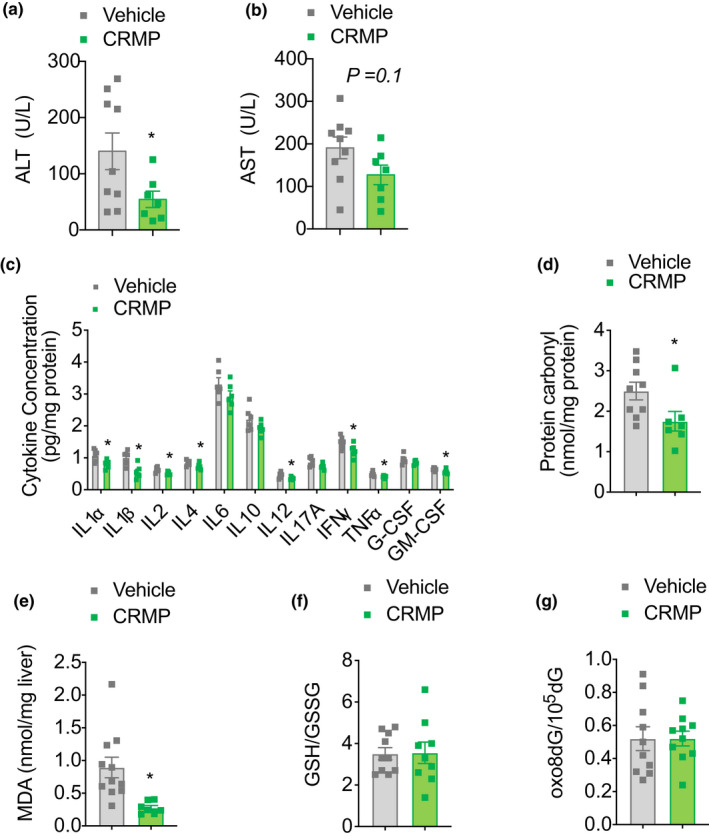
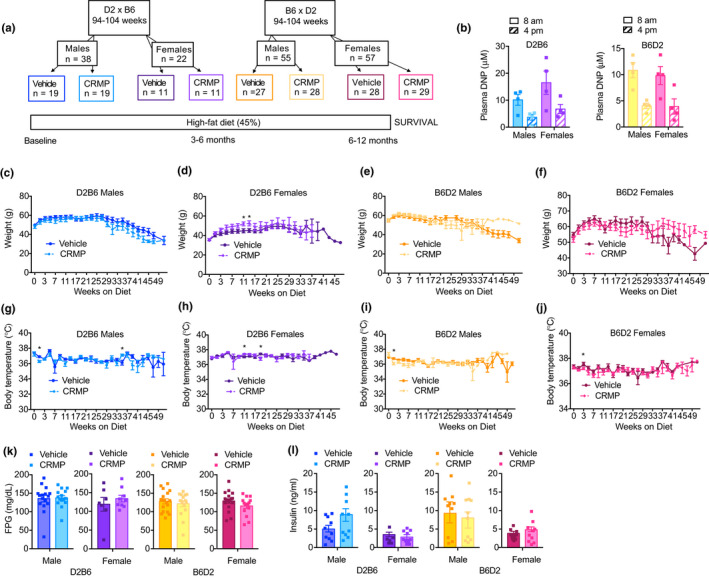
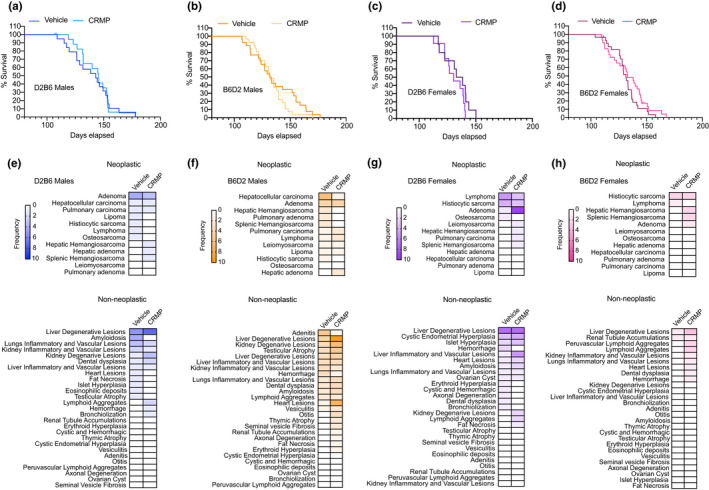
Mild uncoupling of oxidative phosphorylation is an intrinsic property of all mitochondria and may have evolved to protect cells against the production of damaging reactive oxygen species. Therefore, compounds that enhance mitochondrial uncoupling are potentially attractive anti‐aging therapies; however, chronic ingestion is associated with a number of unwanted side effects. We have previously developed a controlled‐release mitochondrial protonophore (CRMP) that is functionally liver‐directed and promotes oxidation of hepatic triglycerides by causing a subtle sustained increase in hepatic mitochondrial inefficiency. Here, we sought to leverage the higher therapeutic index of CRMP to test whether mild mitochondrial uncoupling in a liver‐directed fashion could reduce oxidative damage and improve age‐related metabolic disease and lifespan in diet‐induced obese mice. Oral administration of CRMP (20 mg/[kg‐day] × 4 weeks) reduced hepatic lipid content, protein kinase C epsilon activation, and hepatic insulin resistance in aged (74‐week‐old) high‐fat diet (HFD)‐fed C57BL/6J male mice, independently of changes in body weight, whole‐body energy expenditure, food intake, or markers of hepatic mitochondrial biogenesis. CRMP treatment was also associated with a significant reduction in hepatic lipid peroxidation, protein carbonylation, and inflammation. Importantly, long‐term (49 weeks) hepatic mitochondrial uncoupling initiated late in life (94–104 weeks), in conjugation with HFD feeding, protected mice against neoplastic disorders, including hepatocellular carcinoma (HCC), in a strain and sex‐specific manner. Taken together, these studies illustrate the complex variation of aging and provide important proof‐of‐concept data to support further studies investigating the use of liver‐directed mitochondrial uncouplers to promote healthy aging in humans.
Overview
The claims and statistics of this paper haven’t been checked yet.
Run the check — free, no account needed. It reads the open-access text and checks the sources it cites.
Integrity signals
Registry
Cites
Statistics
Figures
Verification
Claims the paper makes
The claims and statistics of this paper haven’t been checked yet.
Run the check — free, no account needed. It reads the open-access text and checks the sources it cites.
Claims other papers make about this one
Each is checked against this paper’s own text: does it say what the citing paper says it does?
The source backs part of the claim, not all of it — or backs it for a different population, condition or comparison.
In the citing paper
“Partial uncoupling of hepatic mitochondria by means of a controlled release mitochondrial protonophore (CRMP) also reverses age-related metabolic syndrome in mice with high-fat diet-induced obesity 167 .”
From Hallmarks of aging: An expanding universe (2023) · cites this paper as [167]
Experimental — accuracy not yet measuredThe cited source says what the claim attributes to it.
In the citing paper
“| | Mouse | CRMP that preferentially acts to uncouple hepatocyte mitochondria | Administration to obese old mice reduces hepatosteatosis and liver insulin resistance | 167 |”
From Hallmarks of aging: An expanding universe (2023) · cites this paper as [167]
Self-check
Percentages, sums and reported differences re-computed from the paper’s own numbers.
The self-check needs the paper’s full text.
Citations
Cites
López-Otín, C., Blasco, M. A., Partridge, L., Serrano, M., & Kroemer, G. (2013) · Cell · doi:10.1016/j.cell.2013.05.039 · Cited by 14,982
Metformin improves healthspan and lifespan in mice
Martin-Montalvo, A., Mercken, E. M., Mitchell, S. J., Palacios, H. H., Mote, P. L., Scheibye-Knudsen, M., Gomes, A. P., Ward, T. M., Minor, R. K., Blouin, M.-J., et al. (2013) · Nature Communications · doi:10.1038/ncomms3192 · Cited by 1,445
Metformin suppresses gluconeogenesis by inhibiting mitochondrial glycerophosphate dehydrogenase
Madiraju, A. K., Erion, D. M., Rahimi, Y., Zhang, X.-M., Braddock, D. T., Albright, R. A., Prigaro, B. J., Wood, J. L., Bhanot, S., MacDonald, M. J., et al. (2014) · Nature · doi:10.1038/nature13270 · Cited by 1,284
Self-citationThe role of mitochondria in aging
Bratic, A., & Larsson, N.-G. (2013) · Journal of Clinical Investigation · doi:10.1172/jci64125 · Cited by 1,087
Samuel, V. T., Liu, Z.-X., Wang, A., Beddow, S. A., Geisler, J. G., Kahn, M., Zhang, X.-M., Monia, B. P., Bhanot, S., & Shulman, G. I. (2007) · Journal of Clinical Investigation · doi:10.1172/jci30400 · Cited by 497
Self-citationMitochondrial Uncoupling: A Key Controller of Biological Processes in Physiology and Diseases
Demine, S., Renard, P., & Arnould, T. (2019) · Cells · doi:10.3390/cells8080795 · Cited by 476
Effects of Sex, Strain, and Energy Intake on Hallmarks of Aging in Mice
Mitchell, S. J., Madrigal-Matute, J., Scheibye-Knudsen, M., Fang, E., Aon, M., González-Reyes, J. A., Cortassa, S., Kaushik, S., Gonzalez-Freire, M., Patel, B., et al. (2016) · Cell Metabolism · doi:10.1016/j.cmet.2016.05.027 · Cited by 451
Controlled-release mitochondrial protonophore reverses diabetes and steatohepatitis in rats
Perry, R. J., Zhang, D., Zhang, X.-M., Boyer, J. L., & Shulman, G. I. (2015) · Science · doi:10.1126/science.aaa0672 · Cited by 283
Genotype and age influence the effect of caloric intake on mortality in mice
Forster, M. J., Morris, P., & Sohal, R. S. (2003) · The FASEB Journal · doi:10.1096/fj.02-0533fje · Cited by 236
Mitochondrial uncoupling and lifespan
Mookerjee, S. A., Divakaruni, A. S., Jastroch, M., & Brand, M. D. (2010) · Mechanisms of Ageing and Development · doi:10.1016/j.mad.2010.03.010 · Cited by 169
Research works printed but not linked: 67
- 10.1016/j.metabol.2018.12.003 · DOI
- 10.1096/fj.201700001R · DOI · Paper page
- 10.1194/jlr.RA119000586 · DOI
- 10.1093/gerona/glx212 · DOI
- 10.1159/000078349 · DOI
- 10.1016/j.tibs.2017.06.005 · DOI
- 10.1074/jbc.M408918200 · DOI
- 10.1093/gerona/gls332 · DOI
- 10.1177/019262339502300503 · DOI · Paper page
- 10.1016/j.mito.2020.07.007 · DOI
- 10.1016/S0531-5565(00)00135-2 · DOI · Paper page
- 10.1177/0300985811430696 · DOI
- 10.1111/j.1474-9726.2008.00407.x · DOI · Paper page
- 10.1038/nrc1408 · DOI · Paper page
- 10.1056/NEJMoa021423 · DOI · Paper page
- 10.7554/eLife.55513 · DOI
- 10.1021/acs.jmedchem.7b01182 · DOI
- 10.1155/2014/238463 · DOI · Paper page
- 10.1016/bs.pmbts.2016.12.015 · DOI
- 10.1002/mas.21381 · DOI
- 10.18632/aging.100067 · DOI · Paper page
- 10.1016/j.cmet.2005.01.005 · DOI
- 10.1002/hep.30097 · DOI
- 10.1126/scitranslmed.aay0284 · DOI · Paper page
- 10.1016/j.molmet.2021.101178 · DOI
- 10.1093/gerona/gly161 · DOI
- 10.1038/s41598-018-20909-w · DOI
- 10.1016/j.exger.2007.03.009 · DOI
- 10.1093/gerona/60.12.1510 · DOI · Paper page
- 10.1111/jgs.12876 · DOI
- Jeng H. A., 2015, Measurement of 8‐Oxo‐7,8‐dihydro‐2′‐deoxyguanosine in human semen and urine by isotope‐dilution liquid chromatography‐tandem mass spectrometry with on‐line solid‐phase extraction: Comparison with a commercial available enzyme‐linked immunosorbent assay, Andrology, 1, 1
- 10.1016/j.mad.2009.05.001 · DOI
- 10.1016/j.cell.2016.07.031 · DOI · Paper page
- 10.1016/j.cmet.2020.08.001 · DOI
- McCarter R. J., 1997, Physical activity as a factor in the action of dietary restriction on aging: Effects in Fischer 344 rats, Aging, 9, 73
- 10.1016/j.cmet.2018.08.011 · DOI
- 10.1073/pnas.0812484106 · DOI
- 10.1007/s11357-019-00062-6 · DOI
- 10.1038/oby.2009.477 · DOI
- 10.1016/j.cmet.2018.12.013 · DOI
- 10.1155/2016/1987960 · DOI
- 10.3390/nu12051416 · DOI
- 10.1016/j.cell.2009.12.052 · DOI · Paper page
- 10.1016/j.cell.2015.01.012 · DOI · Paper page
- 10.1016/j.cmet.2013.10.004 · DOI
- 10.1172/JCI86013 · DOI
- 10.1016/j.yjmcc.2015.04.023 · DOI
- 10.1016/j.cmet.2012.04.003 · DOI · Paper page
- 10.1016/j.bbadis.2019.165612 · DOI · Paper page
- 10.1016/j.ccr.2008.06.016 · DOI · Paper page
- 10.2147/CIA.S48918 · DOI
- 10.1074/jbc.M313478200 · DOI · Paper page
- 10.1179/135100007X162112 · DOI
- 10.1016/j.molmet.2018.02.010 · DOI
- 10.1038/nrm.2017.110 · DOI
- 10.4082/kjfm.19.0087 · DOI
- 10.1016/j.celrep.2017.05.035 · DOI
- 10.1038/s41467-020-15617-x · DOI
- 10.1152/physiolgenomics.00122.2003 · DOI · Paper page
- 10.1016/j.freeradbiomed.2018.06.028 · DOI
- 10.1126/science.aac4357 · DOI
- 10.1016/j.celrep.2018.06.008 · DOI
- 10.1016/j.heliyon.2020.e04107 · DOI
- 10.1056/NEJM199710023371407 · DOI
- 10.1111/j.0014-3820.2003.tb00356.x · DOI
- 10.1111/acel.13263 · DOI
- 10.3389/fcell.2021.656201 · DOI
Cited by
Sorted by citations
Hallmarks of aging: An expanding universe
López-Otín, C., Blasco, M. A., Partridge, L., Serrano, M., & Kroemer, G. (2023) · Cell · doi:10.1016/j.cell.2022.11.001 · Cited by 6,549
Fekete, M., Szarvas, Z., Fazekas-Pongor, V., Feher, A., Csipo, T., Forrai, J., Dosa, N., Peterfi, A., Lehoczki, A., Tarantini, S., et al. (2022) · Nutrients · doi:10.3390/nu15010047 · Cited by 137
Metadata
- Authors
- Goedeke, L., Murt, K. N., Di Francesco, A., Camporez, J. P., Nasiri, A. R., Wang, Y., Zhang, X., Cline, G. W., de Cabo, R., & Shulman, G. I.
- Affiliations
- Department of Internal Medicine Yale School of Medicine New Haven Connecticut USA
- Translational Gerontology Branch Intramural Research Program National Institute on Aging, NIH Baltimore Maryland USA
- ORCID
- Shulman, Gerald I.
- Venue
- Aging Cell
- Publisher
- Wiley
- Published
- 2022-01-28
- Volume
- 21
- Issue
- 2
- ISSN
- 1474-9718
- 1474-9726
- PMC
- PMC8844126
- Cited by
- 22
- References
- 10
- Language
- en
- Funders
- National Institute of Diabetes and Digestive and Kidney Diseases (P30 DK045735, R01 DK116774, R01 DK119968)
- National Heart, Lung, and Blood Institute (K99 HL150234)
About these checks
Registry, retraction, Cites and statistics results are computed, not judged, with one exception: a printed reference that no index lists is read once by a model before it counts as a citation error. Claims are extracted by a model and kept only when their quote appears verbatim in the text; each cited source is then checked, with a model’s help, for whether it says what the claim relies on. Those verdicts can be wrong — read the claim’s quote and the cited source before relying on one.
Statistics and arithmetic are recomputed, not judged.
Confidence bands are shown only for fields calibrated on our annotated test set. None is calibrated yet, so no band is shown.
What counts as a claim ›How we measure confidence ›How we check this ›
Are you an author, or do you see a problem with this page? Request a review
How to cite
Cite CoChat for the checks on this page, and the paper for its own findings.
- This page
- CoChat. (2026). Citation check: Sex- and strain-specific effects of mitochondrial uncoupling on age-related metabolic diseases in high-fat diet-fed mice. https://app.cochat.ai/papers/10.1111/acel.13539
- The paper
- Goedeke, L., Murt, K. N., Di Francesco, A., Camporez, J. P., Nasiri, A. R., Wang, Y., Zhang, X., Cline, G. W., de Cabo, R., & Shulman, G. I. (2022). Sex- and strain-specific effects of mitochondrial uncoupling on age-related metabolic diseases in high-fat diet-fed mice. Aging Cell. https://doi.org/10.1111/acel.13539
