

The DOI matches its Crossref record; 38 of the 38 references it cites were found in a registry or an index.
Carbon cycle inverse modeling suggests large changes in fractional organic burial are consistent with the carbon isotope record and may have contributed to the rise of oxygen
Abstract
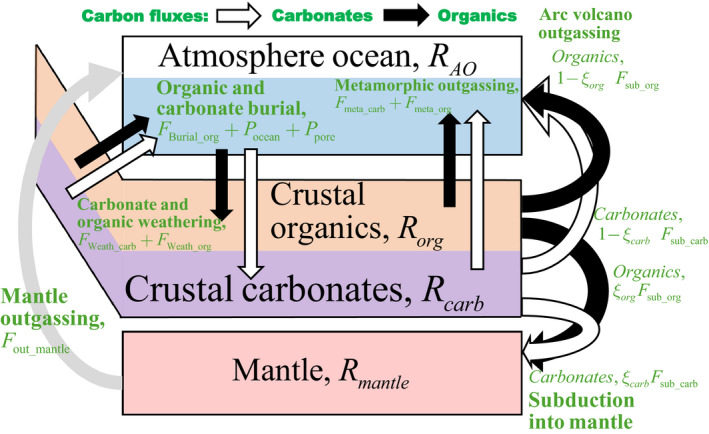
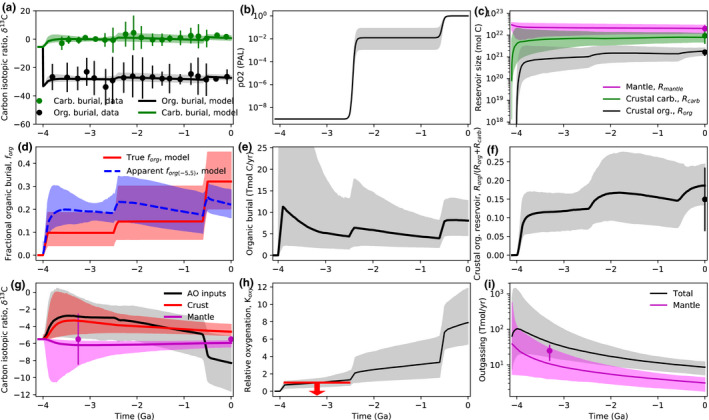
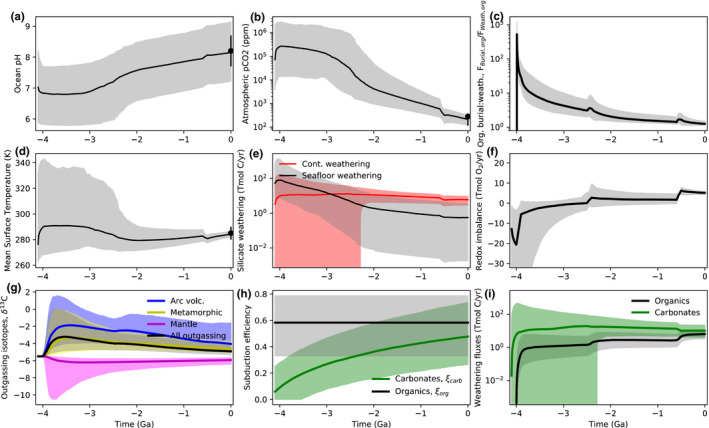
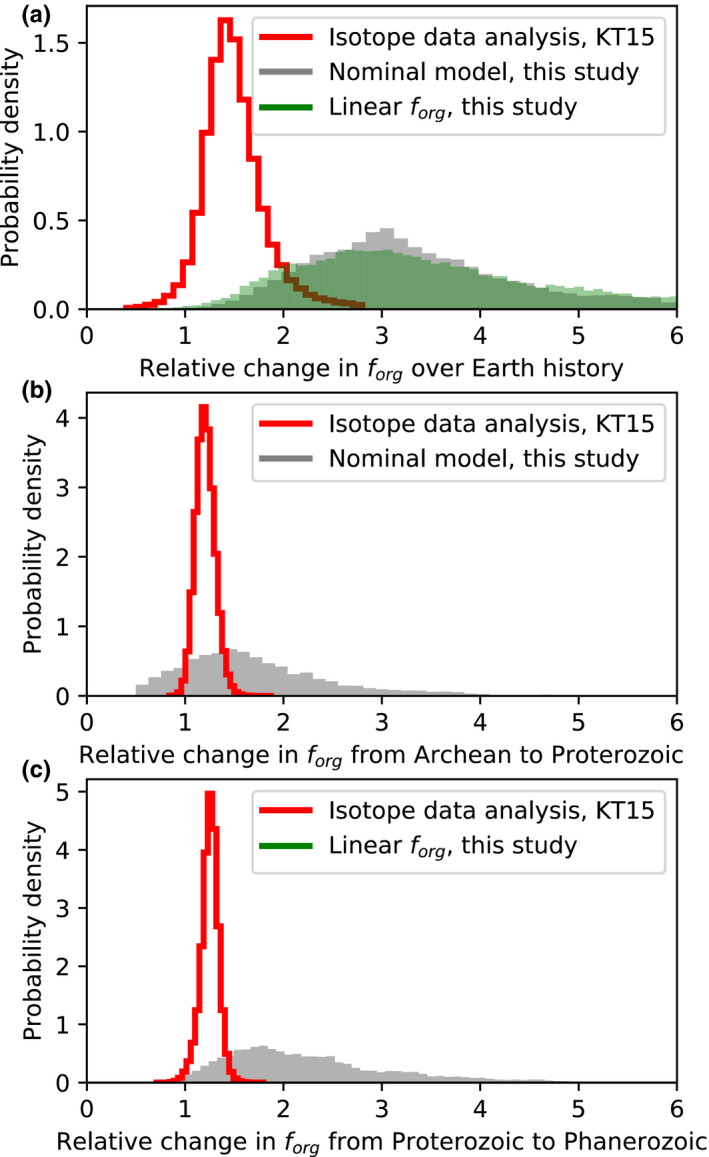
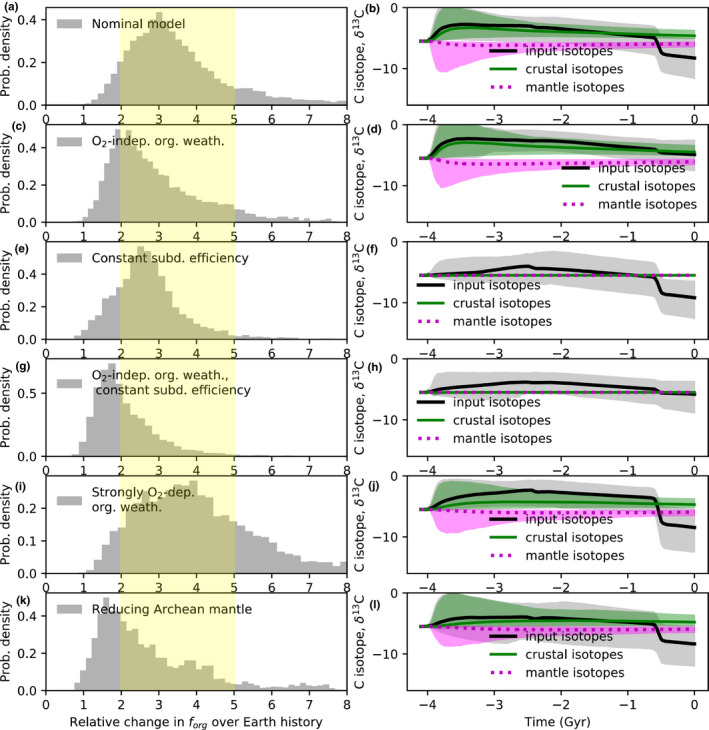
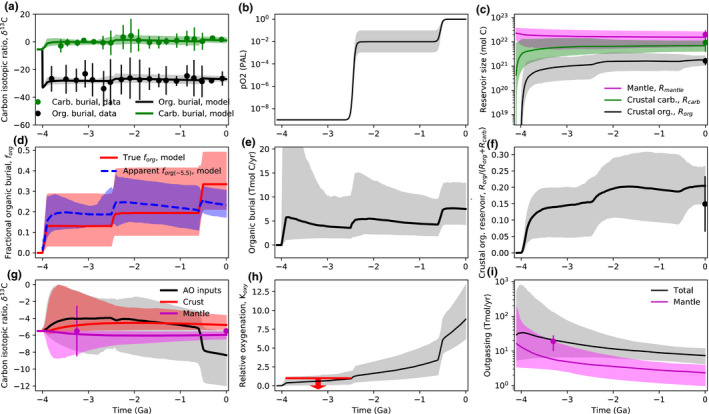
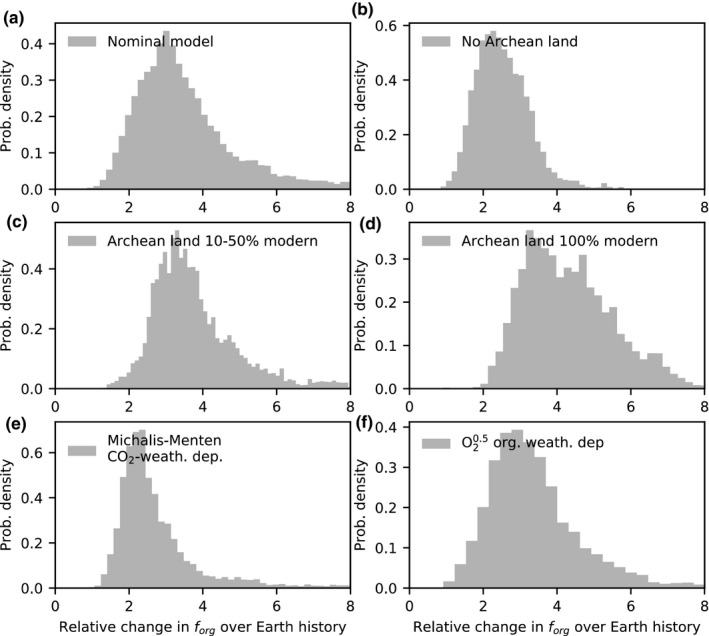
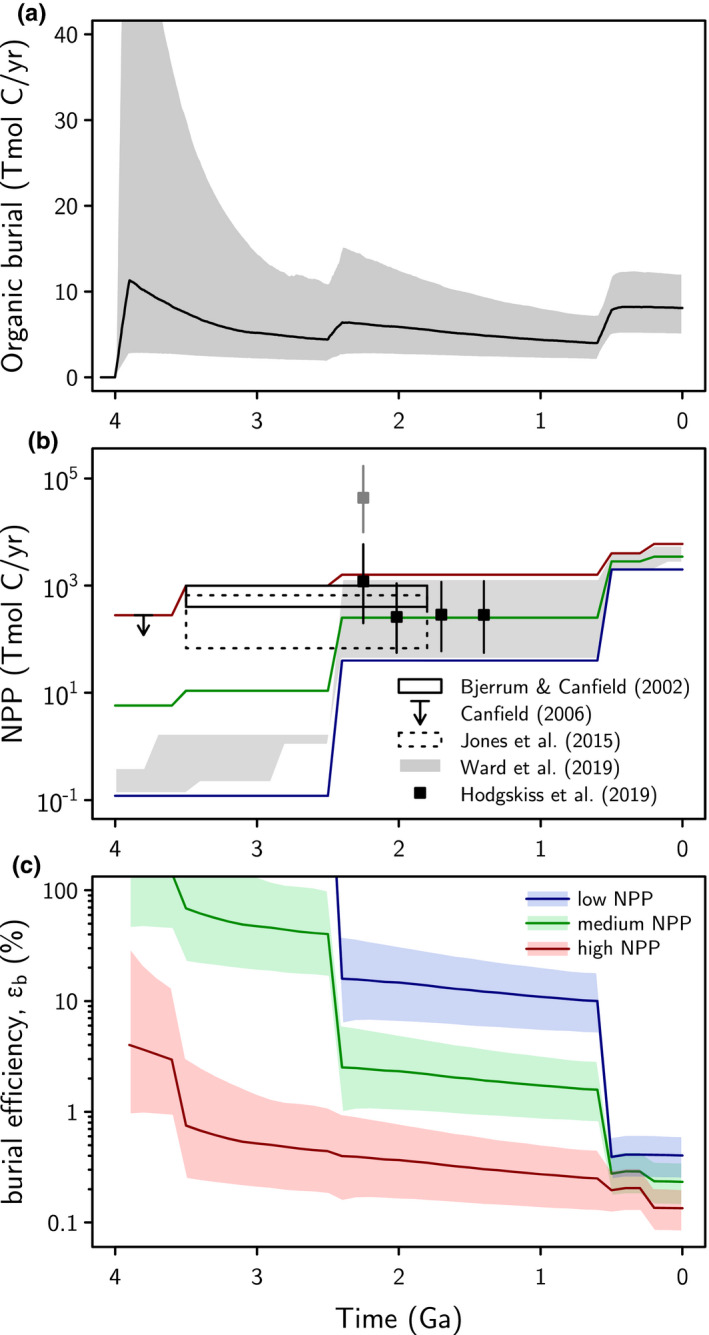
Abundant geologic evidence shows that atmospheric oxygen levels were negligible until the Great Oxidation Event (GOE) at 2.4–2.1 Ga. The burial of organic matter is balanced by the release of oxygen, and if the release rate exceeds efficient oxygen sinks, atmospheric oxygen can accumulate until limited by oxidative weathering. The organic burial rate relative to the total carbon burial rate can be inferred from the carbon isotope record in sedimentary carbonates and organic matter, which provides a proxy for the oxygen source flux through time. Because there are no large secular trends in the carbon isotope record over time, it is commonly assumed that the oxygen source flux changed only modestly. Therefore, declines in oxygen sinks have been used to explain the GOE. However, the average isotopic value of carbon fluxes into the atmosphere–ocean system can evolve due to changing proportions of weathering and outgassing inputs. If so, large secular changes in organic burial would be possible despite unchanging carbon isotope values in sedimentary rocks. Here, we present an inverse analysis using a self‐consistent carbon cycle model to determine the maximum change in organic burial since ~4 Ga allowed by the carbon isotope record and other geological proxies. We find that fractional organic burial may have increased by 2–5 times since the Archean. This happens because O 2‐dependent continental weathering of 13 C‐depleted organics changes carbon isotope inputs to the atmosphere–ocean system. This increase in relative organic burial is consistent with an anoxic‐to‐oxic atmospheric transition around 2.4 Ga without declining oxygen sinks, although these likely contributed. Moreover, our inverse analysis suggests that the Archean absolute organic burial flux was comparable to modern, implying high organic burial efficiency and ruling out very low Archean primary productivity.
Overview
The claims and statistics of this paper haven’t been checked yet.
Run the check — free, no account needed. It reads the open-access text and checks the sources it cites.
Integrity signals
Registry
Cites
Statistics
Figures
Verification
Claims the paper makes
The claims and statistics of this paper haven’t been checked yet.
Run the check — free, no account needed. It reads the open-access text and checks the sources it cites.
Self-check
Percentages, sums and reported differences re-computed from the paper’s own numbers.
The self-check needs the paper’s full text.
Citations
Cites
Global silicate weathering and CO2 consumption rates deduced from the chemistry of large rivers
Gaillardet, J., Dupré, B., Louvat, P., & Allègre, C. J. (1999) · Chemical Geology · doi:10.1016/s0009-2541(99)00031-5 · Cited by 3,334
The rise of oxygen in Earth's early ocean and atmosphere
Lyons, T. W., Reinhard, C. T., & Planavsky, N. J. (2014) · Nature · doi:10.1038/nature13068 · Cited by 2,810 · cited 5×
“This is broadly consistent with the measured organic carbon content of Archean marine sedimentary rocks, which is indistinguishable from that of recent sediments (Krissansen- Totton et al., 2015; Lyons et al., 2014).”
BackgroundInfluentialAtmospheric Influence of Earth's Earliest Sulfur Cycle
Farquhar, J., Bao, H., & Thiemens, M. (2000) · Science · doi:10.1126/science.289.5480.756 · Cited by 1,805
Volcanic gases, black smokers, and the great oxidation event
Holland, H. D. (2002) · Geochimica et Cosmochimica Acta · doi:10.1016/s0016-7037(02)00950-x · Cited by 920
Hayes, J. M., Strauss, H., & Kaufman, A. J. (1999) · Chemical Geology · doi:10.1016/s0009-2541(99)00083-2 · Cited by 843
Low Mid-Proterozoic atmospheric oxygen levels and the delayed rise of animals
Planavsky, N. J., Reinhard, C. T., Wang, X., Thomson, D., McGoldrick, P., Rainbird, R. H., Johnson, T., Fischer, W. W., & Lyons, T. W. (2014) · Science · doi:10.1126/science.1258410 · Cited by 763
Evolution of the global phosphorus cycle
Reinhard, C. T., Planavsky, N. J., Gill, B. C., Ozaki, K., Robbins, L. J., Lyons, T. W., Fischer, W. W., Wang, C., Cole, D. B., & Konhauser, K. O. (2017) · Nature · doi:10.1038/nature20772 · Cited by 649
Carbon dioxide cycling and implications for climate on ancient Earth
Sleep, N. H., & Zahnle, K. (2001) · Journal of Geophysical Research: Planets · doi:10.1029/2000je001247 · Cited by 592
Catling, D. C., & Zahnle, K. J. (2020) · Science Advances · doi:10.1126/sciadv.aax1420 · Cited by 568 · cited 1×
“The answer may inform the search for life elsewhere (Meadows et al., 2018) and elucidate the evolution of complex life on Earth (Catling et al., 2005; Catling & Zahnle, 2020; Mills et al., 2014; Reinhard et al., 2016; Sperling et al., 2013).”
BackgroundSelf-citationAuthigenic Carbonate and the History of the Global Carbon Cycle
Schrag, D. P., Higgins, J. A., Macdonald, F. A., & Johnston, D. T. (2013) · Science · doi:10.1126/science.1229578 · Cited by 532
Stromatolites 3,400–3,500 Myr old from the North Pole area, Western Australia
Walter, M. R., Buick, R., & Dunlop, J. S. R. (1980) · Nature · doi:10.1038/284443a0 · Cited by 508
Biogenic Methane, Hydrogen Escape, and the Irreversible Oxidation of Early Earth
Catling, D. C., Zahnle, K. J., & McKay, C. P. (2001) · Science · doi:10.1126/science.1061976 · Cited by 507
Self-citationThe evolution of the marine phosphate reservoir
Planavsky, N. J., Rouxel, O. J., Bekker, A., Lalonde, S. V., Konhauser, K. O., Reinhard, C. T., & Lyons, T. W. (2010) · Nature · doi:10.1038/nature09485 · Cited by 488
Dahl, T. W., Hammarlund, E. U., Anbar, A. D., Bond, D. P. G., Gill, B. C., Gordon, G. W., Knoll, A. H., Nielsen, A. T., Schovsbo, N. H., & Canfield, D. E. (2010) · Proceedings of the National Academy of Sciences · doi:10.1073/pnas.1011287107 · Cited by 443
Increased subaerial volcanism and the rise of atmospheric oxygen 2.5 billion years ago
Kump, L. R., & Barley, M. E. (2007) · Nature · doi:10.1038/nature06058 · Cited by 403
How Earth's atmosphere evolved to an oxic state: A status report
Catling, D. C., & Claire, M. W. (2005) · Earth and Planetary Science Letters · doi:10.1016/j.epsl.2005.06.013 · Cited by 376
Self-citationThe geologic history of seawater pH
Halevy, I., & Bachan, A. (2017) · Science · doi:10.1126/science.aal4151 · Cited by 376
Oxygen overshoot and recovery during the early Paleoproterozoic
Bekker, A., & Holland, H. D. (2012) · Earth and Planetary Science Letters · doi:10.1016/j.epsl.2011.12.012 · Cited by 366
Oxygen requirements of the earliest animals
Mills, D. B., Ward, L. M., Jones, C., Sweeten, B., Forth, M., Treusch, A. H., & Canfield, D. E. (2014) · Proceedings of the National Academy of Sciences · doi:10.1073/pnas.1400547111 · Cited by 355 · cited 2×
“The answer may inform the search for life elsewhere (Meadows et al., 2018) and elucidate the evolution of complex life on Earth (Catling et al., 2005; Catling & Zahnle, 2020; Mills et al., 2014; Reinhard et al., 2016; Sperling et al., 2013).”
BackgroundCOPSE reloaded: An improved model of biogeochemical cycling over Phanerozoic time
Lenton, T. M., Daines, S. J., & Mills, B. J. W. (2018) · Earth-Science Reviews · doi:10.1016/j.earscirev.2017.12.004 · Cited by 350 · cited 14×
“…et al., 2009); however, the total carbonate burial flux may be as high as 30– 40 Tmol C/year (Milliman, 1993), which would imply a carbonate weathering flux around 20– 30 Tmol C/year, assuming a ~10 Tmol C/year contribution from silicate weathering (Gaillardet et al., 1999; Lenton et al., 2018).”
BackgroundMethodResultInfluentialAtmospheric Evolution on Inhabited and Lifeless Worlds
Catling, D. C., & Kasting, J. F. (2017) · doi:10.1017/9781139020558 · Cited by 342
Self-citationZAHNLE, K., CLAIRE, M., & CATLING, D. (2006) · Geobiology · doi:10.1111/j.1472-4669.2006.00085.x · Cited by 315
Self-citationCatling, D. C., Glein, C. R., Zahnle, K. J., & McKay, C. P. (2005) · Astrobiology · doi:10.1089/ast.2005.5.415 · Cited by 307
Self-citationEarth's oxygen cycle and the evolution of animal life
Reinhard, C. T., Planavsky, N. J., Olson, S. L., Lyons, T. W., & Erwin, D. H. (2016) · Proceedings of the National Academy of Sciences · doi:10.1073/pnas.1521544113 · Cited by 287
Stepwise oxygenation of the Paleozoic atmosphere
Krause, A. J., Mills, B. J. W., Zhang, S., Planavsky, N. J., Lenton, T. M., & Poulton, S. W. (2018) · Nature Communications · doi:10.1038/s41467-018-06383-y · Cited by 255
Iron oxides, divalent cations, silica, and the early earth phosphorus crisis
Jones, C., Nomosatryo, S., Crowe, S. A., Bjerrum, C. J., & Canfield, D. E. (2015) · Geology · doi:10.1130/g36044.1 · Cited by 226
Was There Really an Archean Phosphate Crisis?
Konhauser, K. O., Lalonde, S. V., Amskold, L., & Holland, H. D. (2007) · Science · doi:10.1126/science.1136328 · Cited by 222 · cited 2×
“While high Precambrian phosphorus levels have been proposed (Konhauser et al. 2007; Planavsky et al. 2010), limited availability of reductants (1) forg = (13)CBurial_carb − (13)Cinputs (13)CBurial_carb − (13)CBurial_org Key Points”
BackgroundBiogeochemical modelling of the rise in atmospheric oxygen
CLAIRE, M. W., CATLING, D. C., & ZAHNLE, K. J. (2006) · Geobiology · doi:10.1111/j.1472-4669.2006.00084.x · Cited by 200
Self-citationTriple oxygen isotope evidence for limited mid-Proterozoic primary productivity
Crockford, P. W., Hayles, J. A., Bao, H., Planavsky, N. J., Bekker, A., Fralick, P. W., Halverson, G. P., Bui, T. H., Peng, Y., & Wing, B. A. (2018) · Nature · doi:10.1038/s41586-018-0349-y · Cited by 196
Why the atmosphere became oxygenated: A proposal
Holland, H. D. (2009) · Geochimica et Cosmochimica Acta · doi:10.1016/j.gca.2009.05.070 · Cited by 191 · cited 2×
“This has been interpreted as reflecting a relatively invariant oxygen source flux from organic carbon burial relative to carbon inputs, implying that increases in atmospheric oxygen required decreases in oxygen sinks (Holland, 2002, 2009; Kump et al., 2009; Rothman, 2015).”
BackgroundKrissansen-Totton, J., Buick, R., & Catling, D. C. (2015) · American Journal of Science · doi:10.2475/04.2015.01 · Cited by 180
Self-citationDaines, S. J., Mills, B. J. W., & Lenton, T. M. (2017) · Nature Communications · doi:10.1038/ncomms14379 · Cited by 166 · cited 7×
“Rather than explicitly model the boundary layer and attempt to integrate global uplift rates, we instead assume that the global O2 dependence of oxidative weathering can be approximated with a RO 2 power law (Bolton et al., 2006; Daines et al., 2017), where RO2 is the ratio of oxygen level relative to modern, pO2∕pO m…”
BackgroundMethodInfluentialRegulation of atmospheric oxygen during the Proterozoic
Laakso, T. A., & Schrag, D. P. (2014) · Earth and Planetary Science Letters · doi:10.1016/j.epsl.2013.11.049 · Cited by 159
Stepwise Earth oxygenation is an inherent property of global biogeochemical cycling
Alcott, L. J., Mills, B. J. W., & Poulton, S. W. (2019) · Science · doi:10.1126/science.aax6459 · Cited by 152
What caused the rise of atmospheric O2?
Kasting, J. F. (2013) · Chemical Geology · doi:10.1016/j.chemgeo.2013.05.039 · Cited by 144
Bolton, E. W., Berner, R. A., & Petsch, S. T. (2006) · American Journal of Science · doi:10.2475/08.2006.01 · Cited by 126
Sperling, E. A., & Stockey, R. G. (2018) · Integrative and Comparative Biology · doi:10.1093/icb/icy088 · Cited by 122
A case for low atmospheric oxygen levels during Earth's middle history
Planavsky, N. J., Cole, D. B., Isson, T. T., Reinhard, C. T., Crockford, P. W., Sheldon, N. D., & Lyons, T. W. (2018) · Emerging Topics in Life Sciences · doi:10.1042/etls20170161 · Cited by 84
Research works printed but not linked: 85
- 10.1029/94GB00297 · DOI
- 10.1130/G38070.1 · DOI
- 10.1038/ncomms15455 · DOI
- 10.2475/ajs.289.4.333 · DOI
- 10.1007/s10498-010-9113-0 · DOI
- 10.1038/417159a · DOI · Paper page
- 10.1029/2004GC000713 · DOI
- 10.1029/JC075i018p03553 · DOI
- 10.1098/rstb.2006.1906 · DOI · Paper page
- 10.1016/S0016-7037(99)00252-5 · DOI · Paper page
- 10.1029/2003GL018873 · DOI
- 10.1016/S0301-9268(00)00097-8 · DOI
- 10.1016/j.epsl.2010.06.039 · DOI
- 10.1016/0016-7037(73)90158-0 · DOI
- 10.1016/j.epsl.2010.05.035 · DOI
- 10.1016/B978-0-08-095975-7.01014-7 · DOI · Paper page
- 10.1016/0012-821X(84)90073-6 · DOI
- 10.1016/j.gca.2013.09.026 · DOI
- 10.1038/ngeo2939 · DOI
- 10.5194/essd-11-1-2019 · DOI
- 10.1007/978-0-387-68656-1_12 · DOI
- 10.1126/science.281.5374.237 · DOI · Paper page
- 10.1086/670067 · DOI
- 10.21105/joss.00024 · DOI
- 10.1038/nature10460 · DOI
- 10.1016/j.chemgeo.2018.05.009 · DOI
- 10.1126/science.1161408 · DOI
- 10.1016/S0016-7037(98)00121-5 · DOI
- Garrels R. &Perry E.(1974).The Sea Vol.5.
- 10.1007/s00531-010-0635-x · DOI
- 10.1016/j.gloplacha.2009.07.007 · DOI
- 10.1098/rstb.2006.1840 · DOI
- 10.1016/0304-4203(95)00008-F · DOI
- 10.1130/G31352.1 · DOI
- 10.1073/pnas.1900325116 · DOI · Paper page
- 10.1515/9780691220239 · DOI · Paper page
- Höning D.et al (2019).Carbon cycling and interior evolution of water‐covered plate tectonics and stagnant lid planets. arXiv preprint arXiv:1905.12392. · DOI
- 10.1038/300171a0 · DOI
- 10.1038/s41467-020-16493-1 · DOI
- 10.1086/648219 · DOI
- 10.1029/2020GB006707 · DOI
- 10.1126/sciadv.aao4795 · DOI
- 10.1098/rsta.2017.0408 · DOI
- 10.1073/pnas.1721296115 · DOI · Paper page
- 10.1038/ncomms15423 · DOI
- 10.5670/oceanog.2009.100 · DOI
- 10.1111/gbi.12141 · DOI
- 10.1002/2017GB005832 · DOI
- 10.1029/GM032p0397 · DOI
- 10.1130/G24124A.1 · DOI
- 10.1126/science.aan5049 · DOI
- 10.1089/ast.2017.1727 · DOI
- 10.1029/93GB02524 · DOI
- 10.1086/629606 · DOI
- 10.1029/2018JG004416 · DOI
- 10.1016/j.precamres.2008.04.008 · DOI
- 10.1016/j.gca.2004.05.023 · DOI
- 10.1016/j.gca.2019.01.037 · DOI
- 10.1144/SP389.5 · DOI
- 10.1089/153110702753621321 · DOI · Paper page
- 10.1038/320248a0 · DOI
- Petsch S.(2014).Weathering of organic carbon. · DOI
- 10.1017/CBO9781139047203 · DOI
- 10.1038/s41586-019-1643-z · DOI
- 10.1130/G21316.1 · DOI · Paper page
- 10.1016/j.chemgeo.2018.08.010 · DOI
- 10.1016/j.epsl.2018.04.051 · DOI
- 10.1090/S0273-0979-2014-01471-5 · DOI
- 10.1073/pnas.0832439100 · DOI · Paper page
- 10.5194/essd-12-1561-2020 · DOI · Paper page
- 10.1038/s41467-020-16374-7 · DOI
- 10.1038/333313a0 · DOI
- 10.1016/S0301-9268(00)00128-5 · DOI
- 10.1073/pnas.1614506114 · DOI · Paper page
- 10.1130/GSATG102A.1 · DOI
- 10.2138/rmg.2013.75.12 · DOI
- 10.1073/pnas.1312778110 · DOI · Paper page
- 10.1038/ngeo2070 · DOI
- 10.1016/j.gca.2013.07.011 · DOI
- 10.1002/9781118280874.ch3 · DOI
- 10.1029/2018JG004679 · DOI
- 10.1016/0016-7037(95)00038-2 · DOI
- 10.1016/0016-7037(56)90065-5 · DOI
- 10.1126/sciadv.aav7337 · DOI
- 10.1073/pnas.1523449113 · DOI · Paper page
Cited by
Sorted by citations
Oxygenation, Life, and the Planetary System during Earth's Middle History: An Overview
Lyons, T. W., Diamond, C. W., Planavsky, N. J., Reinhard, C. T., & Li, C. (2021) · Astrobiology · doi:10.1089/ast.2020.2418 · Cited by 211
“Early estimates for stable atmospheric oxygen levels during the boring billion converged on a range from 1% to 40% of the present atmospheric level (Kump, 2008) (PAL; O2 presently comprises 21% of the atmosphere) until recent suggestions of even lower possible concentrations (addressed below).”
BackgroundInfluential
Metadata
- Authors
- Krissansen‐Totton, J., Kipp, M. A., & Catling, D. C.
- Affiliations
- Department of Earth and Space Sciences/Astrobiology Program University of Washington Seattle WA USA
- Venue
- Geobiology
- Publisher
- Wiley
- Published
- 2021-03-25
- Volume
- 19
- Issue
- 4
- Pages
- 342-363
- ISSN
- 1472-4677
- 1472-4669
- PMC
- PMC8359855
- Cited by
- 38
- References
- 38
- Language
- en
- Funders
- National Aeronautics and Space Administration (80NSSC18K0829, NNX15AL23G)
- Simons Foundation (511570, 511570FY20)
- Division of Earth Sciences (1338810)
About these checks
Registry, retraction, Cites and statistics results are computed, not judged, with one exception: a printed reference that no index lists is read once by a model before it counts as a citation error. Claims are extracted by a model and kept only when their quote appears verbatim in the text; each cited source is then checked, with a model’s help, for whether it says what the claim relies on. Those verdicts can be wrong — read the claim’s quote and the cited source before relying on one.
Statistics and arithmetic are recomputed, not judged.
Confidence bands are shown only for fields calibrated on our annotated test set. None is calibrated yet, so no band is shown.
What counts as a claim ›How we measure confidence ›How we check this ›
Are you an author, or do you see a problem with this page? Request a review
