

Microfibers in oceanic surface waters: A global characterization
Open accessThe DOI matches its Crossref record; 57 of the 57 references it cites were found in a registry or an index.
Abstract
Contrary to global production, most fibers floating in the ocean are not synthetic but natural fibers of animal or plant origin.
Overview
The claims and statistics of this paper haven’t been checked yet.
Free: it reads the open-access text and checks the first 5 claims that cite a source we can check. Create a free account to check every claim.
Integrity signals
Registry
Cites
Statistics
Figures



Verification
Claims the paper makes
The claims and statistics of this paper haven’t been checked yet.
Free: it reads the open-access text and checks the first 5 claims that cite a source we can check. Create a free account to check every claim.
Self-check
Percentages, sums and reported differences re-computed from the paper’s own numbers.
The self-check needs the paper’s full text.
Citations
Cites
Production, use, and fate of all plastics ever made
Geyer, R., Jambeck, J. R., & Law, K. L. (2017) · Science Advances · doi:10.1126/sciadv.1700782 · Cited by 18,606
Human Consumption of Microplastics
Cox, K. D., Covernton, G. A., Davies, H. L., Dower, J. F., Juanes, F., & Dudas, S. E. (2019) · Environmental Science & Technology · doi:10.1021/acs.est.9b01517 · Cited by 2,745 · cited 2×
“Given their abundance, it is not surprising that fibers have been detected in food (18), drinking water (28), and human lungs (29), as well as in the digestive tracts of many aquatic (30, 31) and terrestrial organisms (32).”
BackgroundAtmospheric transport and deposition of microplastics in a remote mountain catchment
Allen, S., Allen, D., Phoenix, V. R., Le Roux, G., Durántez Jiménez, P., Simonneau, A., Binet, S., & Galop, D. (2019) · Nature Geoscience · doi:10.1038/s41561-019-0335-5 · Cited by 2,319 · cited 5×
“Alternatively, smaller fibers may be most easily advected by long-range aerial transport, thus reaching the most remote areas of the planet (15).”
BackgroundResultInfluentialThe deep sea is a major sink for microplastic debris
Woodall, L. C., Sanchez-Vidal, A., Canals, M., Paterson, G. L. J., Coppock, R., Sleight, V., Calafat, A., Rogers, A. D., Narayanaswamy, B. E., & Thompson, R. C. (2014) · Royal Society Open Science · doi:10.1098/rsos.140317 · Cited by 1,946 · cited 4×
“This is in agreement with recent studies showing that cellulosic fibers account for more than 60–80% of all fibers in seafloor sediments (23, 24), marine organisms (30, 31), wastewater (38), fresh water (26, 27), ice cores (22), and airborne fiber populations (14, 39).”
BackgroundResultInfluentialA global inventory of small floating plastic debris
van Sebille, E., Wilcox, C., Lebreton, L., Maximenko, N., Hardesty, B. D., van Franeker, J. A., Eriksen, M., Siegel, D., Galgani, F., & Law, K. L. (2015) · Environmental Research Letters · doi:10.1088/1748-9326/10/12/124006 · Cited by 1,713
Napper, I. E., & Thompson, R. C. (2016) · Marine Pollution Bulletin · doi:10.1016/j.marpolbul.2016.09.025 · Cited by 1,679 · cited 3×
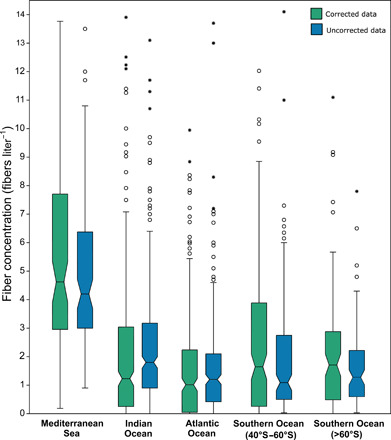
“Nevertheless, the longest fibers were found in the Mediterranean Sea, probably indicating recent inputs into the basin, being closer to pollution sources and more similar to the length of cotton and rayon fibers freshly released by laundering (10, 11).”
BackgroundResultA first overview of textile fibers, including microplastics, in indoor and outdoor environments
Dris, R., Gasperi, J., Mirande, C., Mandin, C., Guerrouache, M., Langlois, V., & Tassin, B. (2017) · Environmental Pollution · doi:10.1016/j.envpol.2016.12.013 · Cited by 1,604
Anthropogenic contamination of tap water, beer, and sea salt
Kosuth, M., Mason, S. A., & Wattenberg, E. V. (2018) · PLOS ONE · doi:10.1371/journal.pone.0194970 · Cited by 1,244 · cited 1×
“Given their abundance, it is not surprising that fibers have been detected in food (18), drinking water (28), and human lungs (29), as well as in the digestive tracts of many aquatic (30, 31) and terrestrial organisms (32).”
BackgroundGlobal warming releases microplastic legacy frozen in Arctic Sea ice
Obbard, R. W., Sadri, S., Wong, Y. Q., Khitun, A. A., Baker, I., & Thompson, R. C. (2014) · Earth's Future · doi:10.1002/2014ef000240 · Cited by 1,092 · cited 3×
“This is in agreement with recent studies showing that cellulosic fibers account for more than 60–80% of all fibers in seafloor sediments (23, 24), marine organisms (30, 31), wastewater (38), fresh water (26, 27), ice cores (22), and airborne fiber populations (14, 39).”
BackgroundResultPrimary microplastics in the oceans: A global evaluation of sources
Boucher, J., & Friot, D. (2017) · doi:10.2305/iucn.ch.2017.01.en · Cited by 1,023 · cited 3×
“Synthetic fibers, however, are generally smoother and brighter than cellulosic ones (55), and therefore, the bias should have been directed toward a preferential selection of synthetic fibers, rather than cellulosic ones.”
Background
Cited by
Items 501–544 of 544
Eco-fibers in the Textile Industry
Periyasamy, A. P. (2026) · Springer eBooks · doi:10.1007/978-3-319-48281-1_25-2
Frank, Y. A., Simonova, M. A., Abramenko, A. A., Vorobiev, E. D., Родиков, Ф. Н., & Vorobiev, D. S. (2026) · Textiles · doi:10.3390/textiles6020057
“The concentration of cellulose MFs in the ocean is significantly higher than that of synthetic ones [15].”
Vargas-Castillo, F., Suárez‐Isla, B. A., & Oliva, D. (2026) · Marine Pollution Bulletin · doi:10.1016/j.marpolbul.2026.119820
Tedesco, M. C. (2026) · UNSWorks (University of New South Wales, Sydney, Australia) · doi:10.26190/unsworks/32258
NeuraMFs: A deep learning model for airborne microfiber identification in plant biomonitors
Gaglione, A., Fusco, S., Granata, A., Cristina, S. M., Giordano, S., Capozzi, F., Nardone, R., & Spagnuolo, V. (2026) · Journal of Hazardous Materials · doi:10.1016/j.jhazmat.2026.142410
Sui, Y., You, X., Guo, G., Xu, X., Huang, L., Bi, C., & He, S. (2026) · Environmental Pollution · doi:10.1016/j.envpol.2026.128444
Magro, C., & Nogueira, M. G. (2026) · Environmental Monitoring and Assessment · doi:10.1007/s10661-026-15523-7
“The contamination of natural environments with plastic waste is an increasing concern and it is globally widespread (Suaria et al., 2020), even in remote areas such as deserts, mountain peaks, the deep ocean, and Arctic snow (MacLeod et al., 2021; Chauhan and Benerjee, 2025).”
Ahmed, N. S., Hasan, M. M., Riya, K. K., Ahmed, F., Arai, T., Kamaruddin, N. A., & Hossain, M. B. (2026) · Environmental Health Insights · doi:10.1177/11786302261461120
“66 Similar dominance is reported in urban river systems across Asia, driven by high population density and wastewater discharge.”
Varela, Z., Gaglione, A., Bouso, M., Giordano, S., Fernández, J. Á., Capozzi, F., & Spagnuolo, V. (2026) · Environmental Research · doi:10.1016/j.envres.2026.125115
Cordova, M. R., & Wang, Z. (2026) · Frontiers in Marine Science · doi:10.3389/fmars.2026.1715358 · Cited by 1
“…and tire abrasion have been widely recognized as major sources of secondary microplastics in both coastal and urban-in fl uenced environments (Parton et al., 2019; Baensch-Baltruschat et al., 2020; Dalla Fontana et al., 2020; Suaria et al., 2020; Waldschläger and Schüttrumpf, 2020; Xu et al., 2020).”
Jeong, H., Shin, J.-H., Kachiprath, B., Shim, K., Yeo, I., Hong, S.-E., Kim, S., & Jeong, C. (2026) · Environmental Science & Technology Letters · doi:10.1021/acs.estlett.6c00601
Su, Q., Li, Y., Kong¹, L., Lu, N., Qu, L., Sun, Y., Zhang, X., & Wang, X. (2026) · Regional Studies in Marine Science · doi:10.1016/j.rsma.2026.105225
Microplastic contamination in giant tiger prawn and greasyback shrimp from Malaysian waters
Wong, W. L., Hadibarata, T., Kristanti, R. A., Hernawan, U., Kurniawan, B., Jusoh, M. N. H., Rangga, J. U., Chin, H. K., & Ratnasari, A. (2026) · Environmental Sustainability · doi:10.1007/s42398-026-00455-2
“Estimate of the annual microfibers released to the ocean range between 1,800 and 52,000 metric tons (Suaria et al. 2020) and depict their general abundance in marine ecosystems.”
Lusher, A., Pakhomova, S. V., Singdahl-Larsen, C., Martínez-Francés, E., Consolaro, C., Lund, E., Knight, J., Jaccard, P. F., Sørensen, K., Alling, V., et al. (2026) · Marine Pollution Bulletin · doi:10.1016/j.marpolbul.2026.120003
Morgillo, A., Salatiello, F., Punta, C., Riva, L., Spagnuolo, A., D’Aniello, E., Corsi, I., & Ristoratore, F. (2026) · Marine Pollution Bulletin · doi:10.1016/j.marpolbul.2026.120130
Zhang, Q., Xu, H., Zheng, D., Cheng, H., Liu, Z., & Yang, C. (2026) · Molecules · doi:10.3390/molecules31142467
Bielmyer‐Fraser, G. K., Courville, J. M., Vervaeke, M., Hoopes, L. A., Hyatt, M. W., McBride, B., Fischer, G. C., & Newton, A. (2026) · Environmental Pollution · doi:10.1016/j.envpol.2026.128811
Microplastic Collection and Sampling Techniques
Frias, J. P. G. L. (2026) · Wiley eBooks · doi:10.1002/9781119906612.ch06
Lombardo, J., Cohen-Sánchez, A., Compa, M., Gil, L., Pinya, S., Tejada, S., & Sureda, A. (2026) · Environmental Pollution · doi:10.1016/j.envpol.2026.128836
Microplastic ingestion is ubiquitous in threatened stingrays from the Amazon estuary
Borges, V., Brabo, L., Monteiro, P., Gutjahr, A. L. N., MOTA, R. G., Pegado, T., Trindade, P. A. A., Rangel-Buitrago, N. G., & Giarrizzo, T. (2026) · Marine Pollution Bulletin · doi:10.1016/j.marpolbul.2026.120532
Balestra, V., Mossotti, R., Zini, L., & Bellopede, R. (2026) · Groundwater for Sustainable Development · doi:10.1016/j.gsd.2026.101669
Sun, Y., Lu, L., Liu, Z., Tian, J., Li, F., & Xu, L. (2026) · Environmental Research · doi:10.1016/j.envres.2026.125464
Cotter, R., Liboiron, M., McCarney, P., Pilgrim, L., Lyall, S. D., Onalik, J., Vuleta, L., Angnatok, J., Wyatt, K., Andersen, G., et al. (2026) · Environmental Research Communications · doi:10.1088/2515-7620/ae99b1
“We excluded microfibres from this analysis since they do not display erosion as clearly as other morphologies (Suaria et al 2020) and they can originate from far away sources by travelling through the air instead of the water (which would account for non-local, non-eroded plastics; Bergmann et al…”
O’Daly, S. H., Hennon, G. M. M., Kelly, T., Kiko, R., Lekanoff, R. M., Pretty, J. L., Schröder, S., & McDonnell, A. M. P. (2026) · Global Biogeochemical Cycles · doi:10.1029/2025gb008685
“However, they could also be, in part, composed of non‐organic fibers, such as microplastics or organic fibers (Suaria et al., 2020).”
Turning a Natural Biopolymer-Binding Protein into a Plastic Surface-Recognizing Protein
Hashino, Y., Hirose, M., & Nakamura, A. (2026) · ACS Synthetic Biology · doi:10.1021/acssynbio.6c00479
Atmospheric Nanoplastics: Detection and Characterization Using Online and Offline Techniques
Tawadrous, M. A. R. (2026) · TSpace (University of Toronto)
Muns‐Pujadas, L., Constenla, M., Dallarés, S., Carreras-Colom, E., Soler‐Membrives, A., & Padrós, F. (2026) · Continental Shelf Research · doi:10.1016/j.csr.2026.105773
Cai, X., Wen, X., & Wang, J. (2026) · Journal of Environmental Management · doi:10.1016/j.jenvman.2026.130795
Barros, Y., Soares, M. D. O., Ayala, A. P., Neto, V. S., Reichert, J., Castro, Í. B., Giarrizzo, T., & Cavalcante, R. M. (2026) · Marine Pollution Bulletin · doi:10.1016/j.marpolbul.2026.120302
Saunders, D. H. (2023) · DalSpace (Dalhousie University) · Cited by 1
Wardlaw, C. M., Kidd, K. A., Perrotta, B. G., Fast, J., & Prosser, R. S. (2026) · Environmental Pollution · doi:10.1016/j.envpol.2026.129116
Ferrari, E., Ariyathilake, V., Bergami, E., Birarda, G., Vaccari, L., & Corsi, I. (2026) · Research Square · doi:10.21203/rs.3.rs-10525164/v1
Hynes, N. J., Milne, R., Beardy, K., Asnicar, D., Sarazen, R., & Goodwin, C. (2026) · Frontiers in Marine Science · doi:10.3389/fmars.2026.1921010
Self-consistent fragmentation in dynamically dense turbulent fibre suspensions
Mazzino, A., Xiao, D., Rongpei, L., & Mao, X. (2026) · Journal of Fluid Mechanics · doi:10.1017/jfm.2026.12044
Piras, G., Cau, A., Meloni, D., Vodret, B., Cangini, M., Melillo, R., Salza, S., Molotzu, M. R., Cau, S., Lorenzoni, G., et al. (2026) · Foods · doi:10.3390/foods15193417
“These tiny particles, because of their physico-chemical properties, surface characteristics, large specific surface area, and hydrophobic nature, have the potential to adsorb other harmful contaminants from their surroundings [10,11].”
Evaluation of particle contamination in the Seine estuary biota
Rakwe, M. E., Revel, M., Prado, É., Cachot, J., Kazour, M., Normand, J., & Lemeille, M. P. H. (2026) · Regional Studies in Marine Science · doi:10.1016/j.rsma.2026.105511
Cepeda, G. E. M., Sarmiento, D. R., Rojas, R. A. S., González-Puetate, I. R., Torres-Lasso, P., Díaz-Cevallos, L., Cepeda-Sánchez, C., Carrillo-Fares, M., Holguín-Contreras, N., Bustillos-Huilca, R., et al. (2026) · SSRN Electronic Journal · doi:10.2139/ssrn.7572078
Impact of copepod ingestion on small microplastic dynamics in coastal waters of JapanPreprint
Zhang, Q., Yamashita, R., Nishibe, Y., & Saito, H. (2026) · SSRN Electronic Journal · doi:10.2139/ssrn.7593425
Skilbeck, O. J., Blackburn, R. S., & Kay, P. (2026) · SSRN Electronic Journal · doi:10.2139/ssrn.7624461
Flores-Cortés, M., Armstrong-Altrin, J. S., Flores-Ocampo, I. Z., Acevedo-Granados, I. V., Guadalupe-Díaz, I. A., Ibarra-Rueda, S. E., Pérez-Alvarado, B. Y., & Fernández-Guevara, G. D. (2026) · Microplastics · doi:10.3390/microplastics5040210
Mauro, R. P. D., Russo, R., Alves, N. M., Rodríguez, J. S., Rodríguez, J., Díaz, M. V., & Pastore, J. I. (2026) · Marine and Fishery Sciences (MAFIS) · doi:10.47193/mafis.4012027010107
Behavioural Responses of Mussels to Natural and Synthetic Textile Microfibres and Their Leachates
Zardi, G. I., Nicastro, K. R., Ennochi-Miroux, J., & Détrée, C. (2026) · Microplastics · doi:10.3390/microplastics5040220
Pupier, C. A., Gaertner‐Mazouni, N., Dehaut, A., Hermabessiere, L., Delpont, C., Godéré, I., & Gaertner, J.-C. (2026) · Journal of Hazardous Materials Advances · doi:10.1016/j.hazadv.2026.101738
Metadata
- Authors
- Suaria, G., Achtypi, A., Perold, V., Lee, J. R., Pierucci, A., Bornman, T. G., Aliani, S., & Ryan, P. G.
- Affiliations
- Istituto di Scienze Marine del Consiglio Nazionale delle Ricerche (IT)
- University of Cape Town (ZA)
- Monash University (AU)
- University of Cagliari (IT)
- South African Environmental Observation Network (ZA)
- Corresponding author
- Suaria, Giuseppe
- ORCID
- Venue
- Science Advances
- Published
- 2020-06-05
- Volume
- 6
- Issue
- 23
- Pages
- eaay8493-eaay8493
- ISSN
- 2375-2548 (ISSN-L)
- PMC
- PMC7274779
- OpenAlex
- W3033279253
- Cited by
- 528
- References
- 57
- Citations by year
- 2026: 79 · 2025: 100 · 2024: 101 · 2023: 79 · 2022: 83 · 2021: 74 · 2020: 12
- FWCI
- 15.32
- Type
- journal article
- Language
- en
- Open access
- gold
- doi.org
- Licence
- cc-by-nc
- Locations
- Science Advances (publishedVersion, cc-by-nc)
- PubMed Central (publishedVersion, cc-by-nc)
- PubMed (publishedVersion)
- Nelson Mandela University Research Repository (submittedVersion, cc-by-nc)
- HAL (submittedVersion)
- Funders
- Swiss Polar Institute
- Topics
- Physical Sciences › Environmental Science › Pollution › Microplastics and Plastic Pollution
- Physical Sciences › Environmental Science › Pollution › Pharmaceutical and Antibiotic Environmental Impacts
- Physical Sciences › Environmental Science › Pollution › Oil Spill Detection and Mitigation
- Keywords
- microfibers, marine surface waters, natural polymers, cellulose fibers, synthetic fibers, microplastics, fiber composition, marine plastic pollution
About these checks
Registry, retraction, Cites and statistics results are computed, not judged, with one exception: a printed reference that no index lists is read once by a model before it counts as a citation error. Claims are extracted by a model and kept only when their quote appears verbatim in the text; each cited source is then checked, with a model’s help, for whether it says what the claim relies on. Those verdicts can be wrong — read the claim’s quote and the cited source before relying on one.
Statistics and arithmetic are recomputed, not judged.
Confidence bands are shown only for fields calibrated on our annotated test set. None is calibrated yet, so no band is shown.
What counts as a claim ›How we measure confidence ›How we check this ›
Are you an author, or do you see a problem with this page? Request a review
Data sources
Bibliographic data: Semantic Scholar, OpenAlex, Crossref.
Contains information from the Semantic Scholar Academic Graph Datasets, made available under the ODC Attribution License (ODC-BY 1.0).
Semantic Scholar’s data is described in: Kinney, R., et al. (2023). The Semantic Scholar Open Data Platform. arXiv:2301.10140.
