

The DOI matches its Crossref record; 58 of the 58 references it cites were found in a registry or an index.
Scaling up fact-checking using the wisdom of crowds
Open accessAbstract
When rating articles’ accuracy, a small politically balanced crowd of laypeople yields high agreement with fact-checkers.
Overview
The claims and statistics of this paper haven’t been checked yet.
Run the check — free, no account needed. It reads the open-access text and checks the sources it cites.
Integrity signals
Registry
Cites
Statistics
Figures
Verification
Claims the paper makes
The claims and statistics of this paper haven’t been checked yet.
Run the check — free, no account needed. It reads the open-access text and checks the sources it cites.
Claims other papers make about this one
Each is checked against this paper’s own text: does it say what the citing paper says it does?
The source backs part of the claim, not all of it — or backs it for a different population, condition or comparison.
In the citing paper
“and (ii) it achieves high identification accuracy enabled by the wisdom of crowds (Drolsbach and Pr¨ ollochs 2023a; Allen et al. 2021; Martel et al. 2024)”
From Characterizing AI-Generated Misinformation on Social Media (2025) · cites this paper as Allen et al. 2021
Experimental — accuracy not yet measuredThe cited source says what the claim attributes to it.
In the citing paper
“Yet, evidence from studies on traditional misinformation shows that crowd-based approaches, where multiple judgments are aggregated, can achieve accuracy levels comparable to those of experts and overcome scalability issues (Allen et al. 2021; Martel et al. 2024; Drolsbach and Pr¨ ollochs 2023a; He et al. 2025; Pilarski and Pr¨ ollochs 2026).”
From Characterizing AI-Generated Misinformation on Social Media (2025) · cites this paper as Allen et al. 2021
In the citing paper
“Recent empirical research finds that averaged responses of ordinary people are on par with third-party fact-checkers for both factual claims in articles (47) and overall accuracy of content from URL domain names (48, 49).”
From Deepfake detection by human crowds, machines, and machine-informed crowds (2022) · cites this paper as [47]
Self-check
Percentages, sums and reported differences re-computed from the paper’s own numbers.
The self-check needs the paper’s full text.
Citations
Cites
Cognitive Reflection and Decision Making
Frederick, S. (2005) · Journal of Economic Perspectives · doi:10.1257/089533005775196732 · Cited by 5,256
Lazer, D. M. J., Baum, M. A., Benkler, Y., Berinsky, A. J., Greenhill, K. M., Menczer, F., Metzger, M. J., Nyhan, B., Pennycook, G., Rothschild, D., et al. (2018) · Science · doi:10.1126/science.aao2998 · Cited by 4,160
Self-citationFake News Detection on Social Media: A Data Mining Perspective
Shu, K., Sliva, A., Wang, S., Tang, J., & Liu, H. (2017) · ACM SIGKDD Explorations Newsletter · doi:10.1145/3137597.3137600 · Cited by 3,304
When Corrections Fail: The Persistence of Political Misperceptions
Nyhan, B., & Reifler, J. (2010) · Political Behavior · doi:10.1007/s11109-010-9112-2 · Cited by 3,173 · cited 1×
“Debunking false claims typically reduces incorrect belief ( 5 ) [early concerns about potential “backfire effects” ( 6 , 7 ) have not been supported by subsequent work; for a review, see ( 8 )].”
Misinformation and Its Correction: Continued Influence and Successful Debiasing
Lewandowsky, S., Ecker, U. K. H., Seifert, C. M., Schwarz, N., & Cook, J. (2012) · Psychological Science in the Public Interest · doi:10.1177/1529100612451018 · Cited by 2,920
The Polarizing Impact of Science Literacy and Numeracy on Perceived Climate Change Risks
Braman, D., Kahan, D. M., Peters, E. M., Wittlin, M., Slovic, P., Ouellette, L. L., & Mandel, G. N. (2012) · Scholarly Commons - George Washington University Law School (George Washington University) · Cited by 2,421
The Persuasiveness of Source Credibility: A Critical Review of Five Decades' Evidence
Pornpitakpan, C. (2004) · Journal of Applied Social Psychology · doi:10.1111/j.1559-1816.2004.tb02547.x · Cited by 2,205 · cited 1×
“While a large literature has shown that people preferentially believe information from trusted sources [for a review, see ( 52 )], this work has usually focused on information shared by people who are more or less trusted.”
Using AUC and accuracy in evaluating learning algorithms
Huang, J., & Ling, C. X. (2005) · IEEE Transactions on Knowledge and Data Engineering · doi:10.1109/tkde.2005.50 · Cited by 2,148
Pennycook, G., & Rand, D. G. (2019) · Cognition · doi:10.1016/j.cognition.2018.06.011 · Cited by 2,022 · cited 4×
“…we cannot rule out this possibility, we did replicate our results by analyzing a previously published dataset of researcher-selected headlines ( 25 ) and found that the crowd performed substantially better than for the articles provided by Facebook (see section S16), suggesting that the…”
InfluentialSelf-citationPennycook, G., McPhetres, J., Zhang, Y., Lu, J. G., & Rand, D. G. (2020) · Psychological Science · doi:10.1177/0956797620939054 · Cited by 1,715 · cited 2×
“…with rapidly evolving facts, such as in the case of the coronavirus disease 2019 (COVID-19) news environment, results for both the crowd and fact-checkers would differ [although studies with researcher-selected true and false COVID-19 headlines find high crowd performance, e.g., ( 39 )].”
Self-citationPennycook, G., & Rand, D. G. (2021) · Trends in Cognitive Sciences · doi:10.1016/j.tics.2021.02.007 · Cited by 1,360 · cited 2×
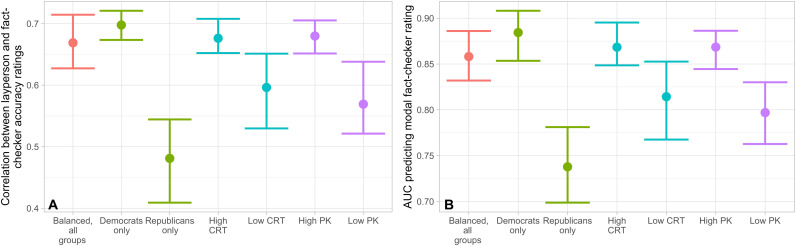
“In particular, we focus on three individual differences that have been previously associated with truth discern-ment ( 27 ): partisanship, political knowledge, and cognitive reflection (the tendency to engage in analytic thinking rather than relying on intuition).”
Self-citationIdeology, motivated reasoning, and cognitive reflection
Kahan, D. M. (2013) · Judgment and Decision Making · doi:10.1017/s1930297500005271 · Cited by 1,302
Prior exposure increases perceived accuracy of fake news
Pennycook, G., Cannon, T. D., & Rand, D. G. (2018) · Journal of Experimental Psychology General · doi:10.1037/xge0000465 · Cited by 1,268
Self-citationShifting attention to accuracy can reduce misinformation online
Pennycook, G., Epstein, Z., Mosleh, M., Arechar, A. A., Eckles, D., & Rand, D. G. (2021) · Nature · doi:10.1038/s41586-021-03344-2 · Cited by 1,155 · cited 1×
“Furthermore, work on accuracy prompts/nudges indicates yet another benefit of crowdsourcing: Simply asking users to rate the accuracy of content primes the concept of accuracy and makes them more discerning in their subsequent sharing ( 38 , 39 ).”
Self-citationGALTON, F. (1907) · Nature · doi:10.1038/075450a0 · Cited by 1,080 · cited 2×
“For example, the judgment of a diverse, independent group of laypeople has been found to outperform the judgment of a single expert across a variety of domains, including guessing tasks, medical diagnoses, and predictions of corporate earnings ( 14 , 15 , 18 , 19 ).”
Automatic deception detection: Methods for finding fake news
Conroy, N. K., Rubin, V. L., & Chen, Y. (2015) · Proceedings of the Association for Information Science and Technology · doi:10.1002/pra2.2015.145052010082 · Cited by 1,066 · cited 1×
“While machine-learning algorithms are scalable and have been shown to be somewhat effective for detecting fake news, they are also domain specific and thus susceptible to failure in our rapidly changing information environment ( 40 – 44 ).”
CSI: A Hybrid Deep Model for Fake News Detection
Ruchansky, N., Seo, S., & Liu, Y. (2017) · Proceedings of the 2017 ACM on Conference on Information and Knowledge Management · doi:10.1145/3132847.3132877 · Cited by 1,039 · cited 1×
“While machine-learning algorithms are scalable and have been shown to be somewhat effective for detecting fake news, they are also domain specific and thus susceptible to failure in our rapidly changing information environment ( 40 – 44 ).”
Fighting misinformation on social media using crowdsourced judgments of news source quality
Pennycook, G., & Rand, D. G. (2019) · Proceedings of the National Academy of Sciences · doi:10.1073/pnas.1806781116 · Cited by 947 · cited 5×
“Second, publisher trust ratings are largely driven by familiarity: People overwhelmingly distrust news publishers that they are unfamiliar with ( 20 , 21 ).”
InfluentialSelf-citationThe Elusive Backfire Effect: Mass Attitudes’ Steadfast Factual Adherence
Wood, T., & Porter, E. (2019) · Political Behavior · doi:10.1007/s11109-018-9443-y · Cited by 904 · cited 2×
“Debunking false claims typically reduces incorrect belief ( 5 ) [early concerns about potential “backfire effects” ( 6 , 7 ) have not been supported by subsequent work; for a review, see ( 8 )].”
Assessing the Effect of 'Disputed' Warnings and Source Salience on Perceptions of Fake News Accuracy
Pennycook, G., Bear, A., Collins, E., & Rand, D. G. (2017) · Management Science · doi:10.1287/mnsc.2019.3478 · Cited by 903
Self-citationPennycook, G., & Rand, D. G. (2020) · Journal of Personality · doi:10.1111/jopy.12476 · Cited by 879
Self-citationAutomatic Detection of Fake NewsPreprint
Pérez‐Rosas, V., Kleinberg, B., Lefevre, A., & Mihalcea, R. F. (2017) · arXiv (Cornell University) · doi:10.48550/arxiv.1708.07104 · Cited by 709
Knowledge does not protect against illusory truth.
Fazio, L. K., Brashier, N. M., Payne, B. K., & Marsh, E. J. (2015) · Journal of Experimental Psychology: General · doi:10.1037/xge0000098 · Cited by 598 · cited 1×
“In addition, down-ranking has the benefit of lowering the probability that a user encounters misinfor-mation at all, guarding against the illusory truth effect by which familiar falsities seem more true after repetition ( 9 , 36 ).”
Fake news, fast and slow: Deliberation reduces belief in false (but not true) news headlines.
Bago, B., Rand, D. G., & Pennycook, G. (2020) · Journal of Experimental Psychology: General · doi:10.1037/xge0000729 · Cited by 593
Self-citationDeception detection for news: Three types of fakes
Rubin, V. L., Chen, Y., & Conroy, N. K. (2015) · Proceedings of the Association for Information Science and Technology · doi:10.1002/pra2.2015.145052010083 · Cited by 558
A Bayesian Truth Serum for Subjective Data
Prelec, D. (2004) · Science · doi:10.1126/science.1102081 · Cited by 530 · cited 1×
“Another route to improved performance could be to investigate more complex algorithms for weighting the crowd responses ( 31 , 33 , 58 ) rather than simply averaging the ratings as we do here.”
Assessing the Capacity of Mass Electorates
Converse, P. E. (2000) · Annual Review of Political Science · doi:10.1146/annurev.polisci.3.1.331 · Cited by 381 · cited 1×
“However, most Americans do not actually care that much about politics ( 59 ) and thus are unlikely to be overly motivated to distort their responses.”
Searching for the backfire effect: Measurement and design considerations.
Swire-Thompson, B., DeGutis, J., & Lazer, D. (2020) · Journal of Applied Research in Memory and Cognition · doi:10.1016/j.jarmac.2020.06.006 · Cited by 360 · cited 2×
“Debunking false claims typically reduces incorrect belief ( 5 ) [early concerns about potential “backfire effects” ( 6 , 7 ) have not been supported by subsequent work; for a review, see ( 8 )].”
The Epistemology of Fact Checking
Uscinski, J. E., & Butler, R. W. (2013) · Critical Review · doi:10.1080/08913811.2013.843872 · Cited by 348
Ideology, Motivated Reasoning, and Cognitive Reflection: An Experimental Study
Kahan, D. M. (2012) · doi:10.2139/ssrn.2182588 · Cited by 331
Bronstein, M. V., Pennycook, G., Bear, A., Rand, D. G., & Cannon, T. D. (2019) · Journal of Applied Research in Memory and Cognition · doi:10.1016/j.jarmac.2018.09.005 · Cited by 324 · cited 1×
“It is possible that previous evidence of a link between cognitive sophistication and truth discernment ( 9 , 20 , 25 , 50 , 51 ) was induced by experimenters selecting headlines that were obviously true versus false.”
Self-citationA note on aggregating opinions
Hogarth, R. M. (1978) · Organizational Behavior and Human Performance · doi:10.1016/0030-5073(78)90037-5 · Cited by 322
Social Clicks: What and Who Gets Read on Twitter?
Gabielkov, M., Ramachandran, A., Chaintreau, A., & Legout, A. (2016) · Measurement and Modeling of Computer Systems · doi:10.1145/2896377.2901462 · Cited by 320
Anatomy of a Fact Check: Objective Practice and the Contested Epistemology of Fact Checking
Graves, L. (2016) · Communication Culture and Critique · doi:10.1111/cccr.12163 · Cited by 277 · cited 1×
“Professional fact-checkers have a great deal of training and expertise that enables them to assess information quality ( 16 ).”
Mannes, A. E., Soll, J. B., & Larrick, R. P. (2014) · Journal of Personality and Social Psychology · doi:10.1037/a0036677 · Cited by 275 · cited 2×
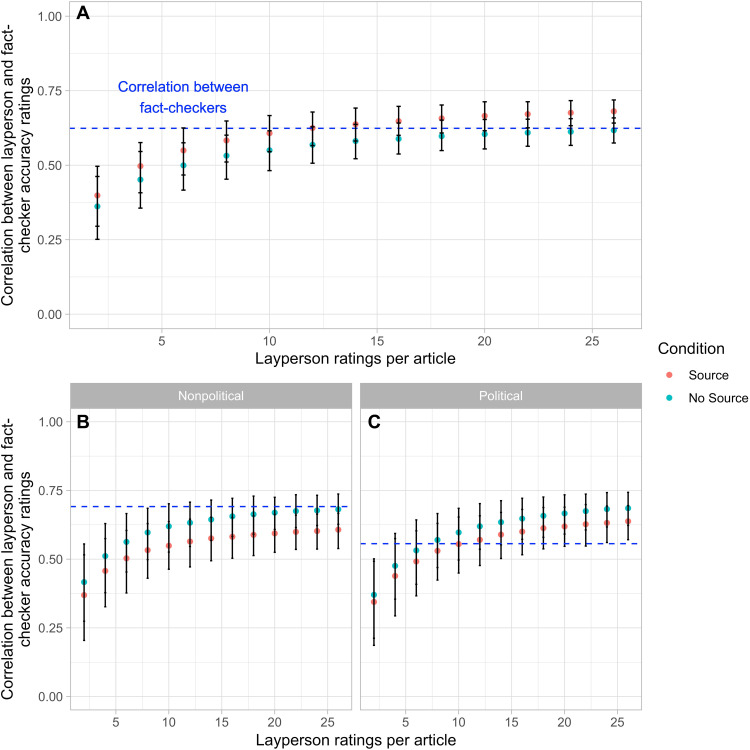
“…the layperson aggregate accuracy ratings and the fact-checker aggregate accuracy ratings varies with the size of the crowd [i.e., the number of layperson ratings per article, k , as smaller—and thus more scalable— crowds can often approximate the performance of larger crowds ( 31 – 33 )] (see Fig.”
Leveraging the Crowd to Detect and Reduce the Spread of Fake News and Misinformation
Kim, J., Tabibian, B., Oh, A., Schölkopf, B., & Gomez-Rodriguez, M. (2018) · Proceedings of the Eleventh ACM International Conference on Web Search and Data Mining · doi:10.1145/3159652.3159734 · Cited by 230 · cited 1×
“Previous efforts at using the crowd to identify misinformation have typically focused on allowing users to flag content that they encounter on platform and believe is problematic, and then algorithmically leveraging this user flagging activity ( 23 ).”
Social learning and partisan bias in the interpretation of climate trends
Guilbeault, D., Becker, J. A., & Centola, D. M. (2018) · Proceedings of the National Academy of Sciences · doi:10.1073/pnas.1722664115 · Cited by 204 · cited 1×
“In addition to the studies examining trust in news publishers described above ( 20 , 21 ), research has shown that crowdsourcing produces more accurate judgments than individual decision-making across a variety of partisan issues including climate change, immigration, and un-employment ( 54 , 55 ).”
Checking how fact-checkers check
Lim, C. (2018) · Research & Politics · doi:10.1177/2053168018786848 · Cited by 183 · cited 1×
“For example, a study comparing the scores given by FactCheck.org and PolitiFact using ordinal rating scales found a correlation of r = 0.66 ( 29 ), while another study found inter–fact-checker agreement as low as 0.47 when comparing the ratings of well-known fact-checking organizations ( 30 ).”
InfluentialHarnessing the Wisdom of Crowds
Da, Z., & Huang, X. (2019) · Management Science · doi:10.1287/mnsc.2019.3294 · Cited by 183
Effects of Credibility Indicators on Social Media News Sharing Intent
Yaqub, W., Kakhidze, O., Brockman, M. L., Memon, N., & Patil, S. (2020) · Proceedings of the 2020 CHI Conference on Human Factors in Computing Systems · doi:10.1145/3313831.3376213 · Cited by 171 · cited 1×
“In the context of social media specifically, putting warning labels on content that has been contested by fact-checkers substantially reduces sharing intentions ( 9 – 11 ).”
Confirmation bias with motivated beliefs
Charness, G., & Dave, C. (2017) · Games and Economic Behavior · doi:10.1016/j.geb.2017.02.015 · Cited by 164
Becker, J. A., Porter, E. V., & Centola, D. M. (2019) · Proceedings of the National Academy of Sciences · doi:10.1073/pnas.1817195116 · Cited by 162
The wisdom of polarized crowds
Shi, F., Teplitskiy, M., Duede, E., & Evans, J. A. (2019) · Carolina Digital Repository (University of North Carolina at Chapel Hill) · Cited by 162
Fighting misperceptions and doubting journalists’ objectivity: A review of fact-checking literature
Nieminen, S., & Rapeli, L. (2019) · Political Studies Review · doi:10.1177/1478929918786852 · Cited by 150 · cited 1×
“…to combating misinformation, which technology companies such as Facebook and Twitter are currently using ( 2 , 3 ) and which has received considerable attention within academia [for a review, see ( 4 )], is the use of professional fact-checkers to identify and label false or misleading claims.”
Emphasizing publishers does not effectively reduce susceptibility to misinformation on social media
Dias, N., Pennycook, G., & Rand, D. G. (2020) · Harvard Kennedy School Misinformation Review · doi:10.37016/mr-2020-001 · Cited by 145
Self-citationEcker, U. K. H., Lewandowsky, S., & Chadwick, M. (2020) · Cognitive Research Principles and Implications · doi:10.1186/s41235-020-00241-6 · Cited by 131 · cited 1×
“While corrections to misinformation have generally been shown to be effective ( 5 , 37 ), that efficacy is dependent on the manner of correction and the possibility of a familiarity backfire effect cannot be ruled out ( 9 ) [although there has been consistent evidence against it; see ( 8 )].”
The wisdom of polarized crowds
Shi, F., Teplitskiy, M., Duede, E., & Evans, J. A. (2019) · Nature Human Behaviour · doi:10.1038/s41562-019-0541-6 · Cited by 129
Checking the Fact-Checkers in 2008: Predicting Political Ad Scrutiny and Assessing Consistency
Amazeen, M. A. (2014) · Journal of Political Marketing · doi:10.1080/15377857.2014.959691 · Cited by 96
The wisdom of smaller, smarter crowds
Goldstein, D. G., McAfee, R. P., & Suri, S. (2014) · ACM Conference on Economics and Computation (EC) · doi:10.1145/2600057.2602886 · Cited by 76 · cited 2×
“…the layperson aggregate accuracy ratings and the fact-checker aggregate accuracy ratings varies with the size of the crowd [i.e., the number of layperson ratings per article, k , as smaller—and thus more scalable— crowds can often approximate the performance of larger crowds ( 31 – 33 )] (see Fig.”
Investigating Differences in Crowdsourced News Credibility Assessment
Bhuiyan, M. M., Zhang, A. X., Sehat, C. M., & Mitra, T. (2020) · Proceedings of the ACM on Human-Computer Interaction · doi:10.1145/3415164 · Cited by 75 · cited 1×
“…demonstrated that laypeople can discern truth from falsehoods on stimulus sets curated by experimenters ( 25 , 27 ); for example, Bhuiyan et al. ( 28 ) found that laypeople ratings were highly correlated with expert ratings for claims about scientific topics that had a “high degree of consensus…”
Epstein, Z., Pennycook, G., & Rand, D. (2020) · Proceedings of the 2020 CHI Conference on Human Factors in Computing Systems · doi:10.1145/3313831.3376232 · Cited by 67
Self-citationEmphasizing publishers does not effectively reduce susceptibility to misinformation on social mediaPreprint
Dias, N., Pennycook, G., & Rand, D. G. (2020) · doi:10.31234/osf.io/zv4dq · Cited by 60
Self-citationThe Wisdom of Crowds of Doctors
Kattan, M. W., O’Rourke, C., Yu, C., & Chagin, K. M. (2015) · Medical Decision Making · doi:10.1177/0272989x15581615 · Cited by 44 · cited 1×
“For example, the judgment of a diverse, independent group of laypeople has been found to outperform the judgment of a single expert across a variety of domains, including guessing tasks, medical diagnoses, and predictions of corporate earnings ( 14 , 15 , 18 , 19 ).”
The Role of Source, Headline and Expressive Responding in Political News Evaluation
Jakesch, M., Koren, M., Evtushenko, A., & Naaman, M. (2018) · SSRN Electronic Journal · doi:10.2139/ssrn.3306403 · Cited by 30 · cited 1×
“…numerous recent studies have examined the impact of the publisher associated with a news headline (either by hiding versus revealing the actual publisher or by experimentally manipulating which publisher is associated with a given article) and have surprisingly found little effect ( 22 , 26 , 53 ).”
Keck, S., & Tang, W. (2020) · Psychological Science · doi:10.1177/0956797620941840 · Cited by 25 · cited 1×
“Our results also show the limits of a recent finding that cognitively diverse groups made of a mix of intuitive and analytical thinkers perform better than crowds of only more analytical thinkers ( 57 ).”
Thought as a determinant of political opinion
Sloman, S. A., & Rabb, N. (2019) · Cognition · doi:10.1016/j.cognition.2019.02.014 · Cited by 21
Informed Crowds Can Effectively Identify Misinformation.Preprint
Resnick, P., Alfayez, A., Im, J., & Gilbert, É. (2021) · arXiv (Cornell University) · Cited by 8
Principled Evaluation with Human Labels: One Rater at a Time and Rater EquivalencePreprint
Resnick, P., Kong, Y., Schoenebeck, G. R., & Weninger, T. (2021) · arXiv (Cornell University) · doi:10.48550/arxiv.2106.01254 · Cited by 5 · cited 1×
“To assess how well the layperson judgments correlate with the fact-checkers’ in absolute terms, we use the correlation between the fact-checker ratings as a benchmark ( 34 ).”
Research works printed but not linked: 1
- 10.1038/nclimate1547 · DOI · Paper page
Cited by
Sorted by citations
Pennycook, G., & Rand, D. G. (2021) · Trends in Cognitive Sciences · doi:10.1016/j.tics.2021.02.007 · Cited by 1,360
“First, truth is not a black-and-white, clearly defined property: even professional fact-checkers often disagree on how exactly to classify content [77,78].”
BackgroundResultInfluentialSelf-citationShifting attention to accuracy can reduce misinformation online
Pennycook, G., Epstein, Z., Mosleh, M., Arechar, A. A., Eckles, D., & Rand, D. G. (2021) · Nature · doi:10.1038/s41586-021-03344-2 · Cited by 1,155
Self-citationDeepfake detection by human crowds, machines, and machine-informed crowds
Groh, M., Epstein, Z., Firestone, C., & Picard, R. (2022) · Proceedings of the National Academy of Sciences · doi:10.1073/pnas.2110013119 · Cited by 248
Spread of misinformation on social media: What contributes to it and how to combat it
Chen, S., Xiao, L., & Kumar, A. (2022) · Computers in Human Behavior · doi:10.1016/j.chb.2022.107643 · Cited by 239
Understanding and combatting misinformation across 16 countries on six continents
Arechar, A. A., Allen, J., Berinsky, A. J., Cole, R., Epstein, Z., Garimella, K., Gully, A., Lu, J. G., Ross, R. M., Stagnaro, M. N., et al. (2023) · Nature Human Behaviour · doi:10.1038/s41562-023-01641-6 · Cited by 188
Self-citation
Metadata
- Authors
- Allen, J., Arechar, A. A., Pennycook, G., & Rand, D. G.
- Affiliations
- Massachusetts Institute of Technology (US)
- University of Nottingham (GB)
- University of Regina (CA)
- Corresponding author
- Allen, Jennifer
- Arechar, Antonio A.
- Rand, David G.
- Venue
- Science Advances
- Published
- 2021-09-03
- Volume
- 7
- Issue
- 36
- Pages
- eabf4393-eabf4393
- ISSN
- 2375-2548 (ISSN-L)
- PMC
- PMC8442902
- OpenAlex
- W3172233798
- Cited by
- 234
- References
- 56
- Citations by year
- 2026: 44 · 2025: 47 · 2024: 48 · 2023: 45 · 2022: 33 · 2021: 15
- FWCI
- 49.20
- Type
- journal article
- Language
- en
- Open access
- gold
- doi.org
- Licence
- cc-by
- Locations
- Science Advances (publishedVersion, cc-by)
- Europe PMC (PubMed Central) (publishedVersion, other-oa)
- PubMed Central (publishedVersion, cc-by)
- PubMed (publishedVersion)
- DSpace@MIT (Massachusetts Institute of Technology) (submittedVersion, cc-by-nc)
- PsyArXiv (OSF Preprints) (submittedVersion)
- OSF Preprints (OSF Preprints) (submittedVersion)
- PsyArXiv (OSF Preprints) (submittedVersion, cc-by)
- Funders
- John Templeton Foundation (61061)
- Topics
- Social Sciences › Sociology and Political Science › Misinformation and Its Impacts
- Physical Sciences › Computer Science › Computer Science Applications › Mobile Crowdsensing and Crowdsourcing
- Physical Sciences › Computer Science › Information Systems › Spam and Phishing Detection
- Keywords
- fact-checking, misinformation, crowdsourcing, wisdom of crowds, laypeople, political balance, Facebook, news headlines, cognitive reflection, political knowledge, partisanship
About these checks
Registry, retraction, Cites and statistics results are computed, not judged, with one exception: a printed reference that no index lists is read once by a model before it counts as a citation error. Claims are extracted by a model and kept only when their quote appears verbatim in the text; each cited source is then checked, with a model’s help, for whether it says what the claim relies on. Those verdicts can be wrong — read the claim’s quote and the cited source before relying on one.
Statistics and arithmetic are recomputed, not judged.
Confidence bands are shown only for fields calibrated on our annotated test set. None is calibrated yet, so no band is shown.
What counts as a claim ›How we measure confidence ›How we check this ›
Are you an author, or do you see a problem with this page? Request a review
