

The DOI matches its Crossref record; 31 of the 32 references it cites were found in a registry or an index.
An investigation of transmission control measures during the first 50 days of the COVID-19 epidemic in China.
Open accessPublished version of a preprint
Abstract
Abstract Respiratory illness caused by a novel coronavirus (COVID-19) appeared in China during December 2019. Attempting to contain infection, China banned travel to and from Wuhan city on 23 January and implemented a national emergency response. Here we evaluate the spread and control of the epidemic based on a unique synthesis of data including case reports, human movement and public health interventions. The Wuhan shutdown slowed the dispersal of infection to other cities by an estimated 2.91 days (95%CI: 2.54-3.29), delaying epidemic growth elsewhere in China. Other cities that implemented control measures pre-emptively reported 33.3% (11.1-44.4%) fewer cases in the first week of their outbreaks (13.0; 7.1-18.8) compared with cities that started control later (20.6; 14.5-26.8). Among interventions investigated here, the most effective were suspending intra-city public transport, closing entertainment venues and banning public gatherings. The national emergency response delayed the growth and limited the size of the COVID-19 epidemic and, by 19 February (day 50), had averted hundreds of thousands of cases across China. One sentence summary Travel restrictions and the national emergency response delayed the growth and limited the size of the COVID-19 epidemic in China.
Overview
The claims and statistics of this paper haven’t been checked yet.
Run the check — free, no account needed. It reads the open-access text and checks the sources it cites.
Integrity signals
Registry
Cites
Statistics
Figures
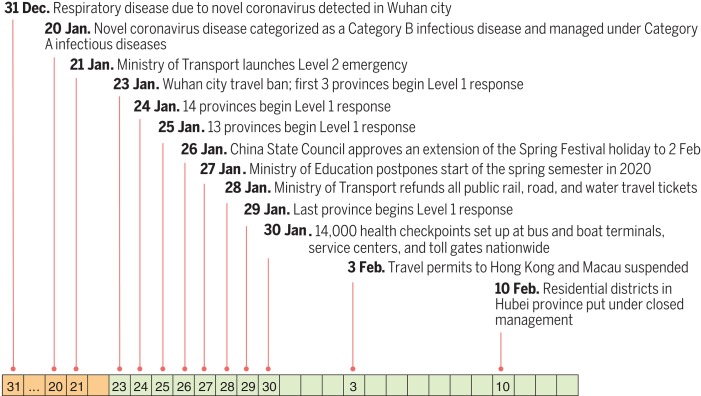
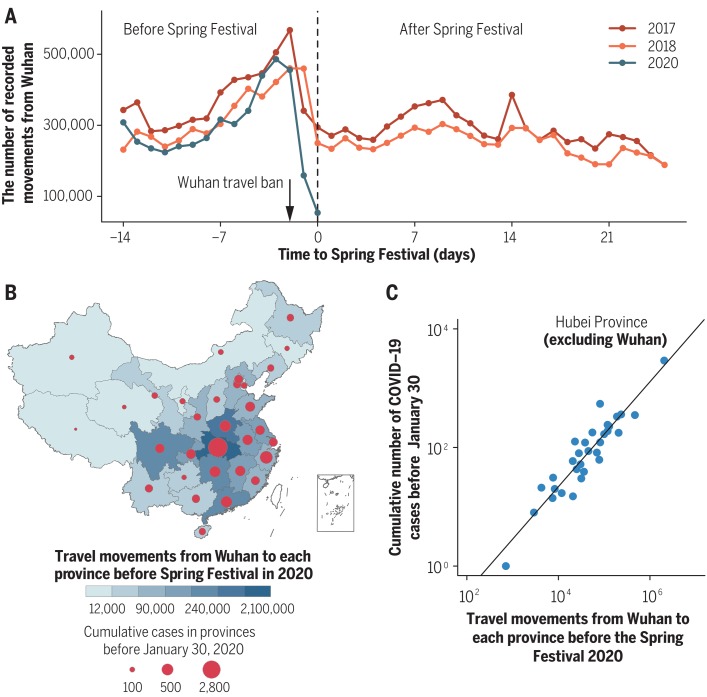
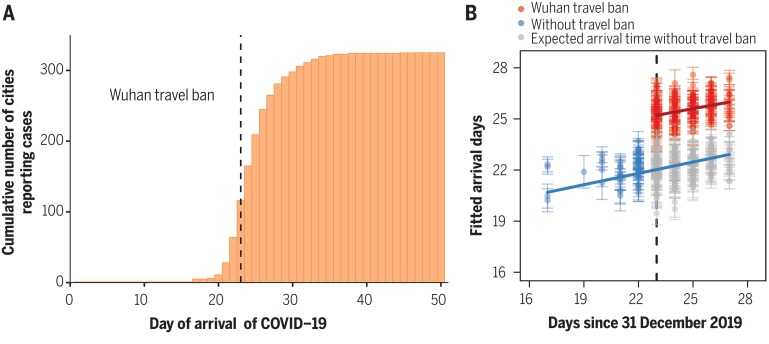
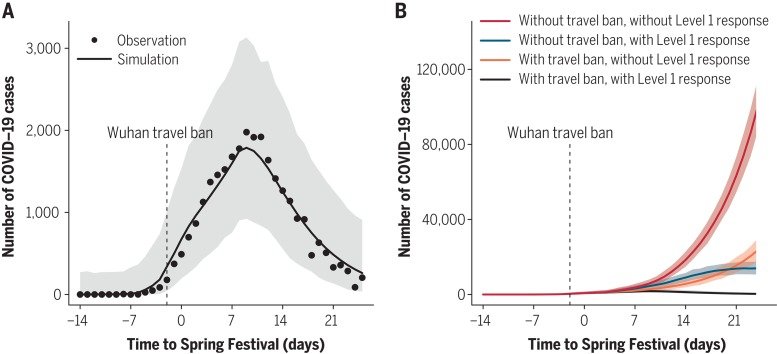
Verification
Claims the paper makes
The claims and statistics of this paper haven’t been checked yet.
Run the check — free, no account needed. It reads the open-access text and checks the sources it cites.
Claims other papers make about this one
Each is checked against this paper’s own text: does it say what the citing paper says it does?
The check wasn’t confident either way, so it gives no verdict — never disputed.
In the citing paper
“recent international studies have reported increased symptoms of anxiety, depression, sleep disorders, and psychological distress during lockdown (4–10)”
From The Evolution of Psychological and Behavioral Consequences of Self-Isolation During Lockdown: A Longitudinal Study Across United Kingdom and Italy (2022) · cites this paper as [9]
Experimental — accuracy not yet measured
Self-check
Percentages, sums and reported differences re-computed from the paper’s own numbers.
The self-check needs the paper’s full text.
Citations
Cites
A novel coronavirus from patients with pneumonia in China, 2019
Zhu, N., Zhang, D., Wang, W., Li, X., Yang, B., Song, J., Zhao, X., Huang, B., Shi, W., Lu, R., et al. (2020) · New England Journal of Medicine · doi:10.1056/nejmoa2001017 · Cited by 28,244
A pneumonia outbreak associated with a new coronavirus of probable bat origin
Zhou, P., Yang, X.-L., Wang, X.-G., Hu, B., Zhang, L., Zhang, W., Si, H.-R., Zhu, Y., Li, B., Huang, C.-L., et al. (2020) · Nature · doi:10.1038/s41586-020-2012-7 · Cited by 21,969
Self-citationEarly transmission dynamics in Wuhan, China, of novel coronavirus-infected pneumonia
Li, Q., Guan, X., Wu, P., Wang, X., Zhou, L., Tong, Y., Ren, R., Leung, K. S. M., Lau, E. H. Y., Wong, J. Y., et al. (2020) · New England Journal of Medicine · doi:10.1056/nejmoa2001316 · Cited by 16,575
Self-citationLu, R., Zhao, X., Li, J., Niu, P., Yang, B., Wu, H., Wang, W., Song, H., Huang, B., Zhu, N., et al. (2020) · The Lancet · doi:10.1016/s0140-6736(20)30251-8 · Cited by 11,907
A new coronavirus associated with human respiratory disease in China
Wu, F., Zhao, S., Yu, B., Chen, Y.-M., Wang, W., Song, Z.-G., Hu, Y., Tao, Z.-W., Tian, J.-H., Pei, Y.-Y., et al. (2020) · Nature · doi:10.1038/s41586-020-2008-3 · Cited by 11,688
Self-citationGlobal trends in emerging infectious diseases
Jones, K. E., Patel, N. G., Levy, M. A., Storeygard, A., Balk, D., Gittleman, J. L., & Daszak, P. (2008) · Nature · doi:10.1038/nature06536 · Cited by 8,338
Infectious Diseases of Humans: Dynamics and Control
(1992) · Annals of Internal Medicine · doi:10.7326/0003-4819-117-2-174_4 · Cited by 7,819
A novel coronavirus outbreak of global health concern
Wang, C., Horby, P. W., Hayden, F. G., & Gao, G. F. (2020) · The Lancet · doi:10.1016/s0140-6736(20)30185-9 · Cited by 7,700
Bootstrap Methods and their Application
Davison, A. C., & Hinkley, D. V. (1997) · doi:10.1017/cbo9780511802843 · Cited by 7,350
Infectious Diseases of Humans: Dynamics and Control
Anderson, R. M., & May, R. M. (1991) · doi:10.1093/oso/9780198545996.001.0001 · Cited by 6,179
Cited by
Sorted by citations
The effect of travel restrictions on the spread of the 2019 novel coronavirus (COVID-19) outbreak
Chinazzi, M., Davis, J. T., Ajelli, M., Gioannini, C., Litvinova, M., Merler, S., Pastore y Piontti, A., Mu, K., Rossi, L., Sun, K., et al. (2020) · Science · doi:10.1126/science.aba9757 · Cited by 3,694
The effect of human mobility and control measures on the COVID-19 epidemic in China
Kraemer, M. U. G., Yang, C.-H., Gutiérrez, B., Wu, C., Klein, B., Pigott, D. M., open COVID-19 data working group, du Plessis, L., Faria, N. R., Li, R., et al. (2020) · Science · doi:10.1126/science.abb4218 · Cited by 2,987
Self-citationViner, R. M., Russell, S. J., Croker, H., Packer, J., Ward, J., Stansfield, C., Mytton, O., Bonell, C., & Booy, R. (2020) · The Lancet Child & Adolescent Health · doi:10.1016/s2352-4642(20)30095-x · Cited by 2,213
Pan, A., Liu, L., Wang, C., Guo, H., Hao, X., Wang, Q., Huang, J., He, N., Yu, H., Lin, X., et al. (2020) · JAMA · doi:10.1001/jama.2020.6130 · Cited by 1,931
Self-citationAirborne transmission of SARS-CoV-2: The world should face the reality
Morawska, L., & Cao, J. (2020) · Environment International · doi:10.1016/j.envint.2020.105730 · Cited by 1,728
Metadata
- Authors
- Tian, H., Liu, Y., Li, Y., Wu, C.-H., Chen, B., Kraemer, M. U. G., Li, B., Cai, J., Xu, B., Yang, Q., Wang, B., Yang, P., Cui, Y., Song, Y., Zheng, P., Wang, Q., Bjornstad, O. N., Yang, R., Grenfell, B. T., Pybus, O. G., & Dye, C.
- Affiliations
- Beijing Normal University (CN)
- University of Southampton (GB)
- Department of Land, Air and Water Resources, University of California Davis, Davis, CA, USA.
- Boston Children's Hospital (US)
- Tsinghua University (CN)
- Beijing Center for Disease Prevention and Control (CN)
- Beijing Institute of Microbiology and Epidemiology (CN)
- University of Hong Kong (HK)
- Peking University (CN)
- Center for Infectious Disease Dynamics, Department of Biology, Pennsylvania State University, University Park, PA, USA.
- National Institutes of Health (US)
- University of Oxford (GB)
- Corresponding author
- Tian, Huaiyu
- Yang, Ruifu
- Grenfell, Bryan T.
- Pybus, Oliver G.
- Dye, Christopher
- ORCID
- Venue
- Science
- Published
- 2020-05-08
- Volume
- 368
- Issue
- 6491
- Pages
- 638-642
- ISSN
- 0036-8075 (ISSN-L)
- 1095-9203
- PMC
- PMC7164389
- OpenAlex
- W3013188135
- Cited by
- 2,010
- References
- 32
- Citations by year
- 2026: 45 · 2025: 75 · 2024: 129 · 2023: 214 · 2022: 386 · 2021: 627 · 2020: 532
- FWCI
- 70.26
- Type
- journal article
- Language
- en
- Open access
- hybrid
- doi.org
- Licence
- Locations
- Science (publishedVersion, cc-by)
- medRxiv (acceptedVersion, cc-by)
- PubMed Central (publishedVersion, cc-by)
- PubMed (publishedVersion)
- The HKU Scholars Hub (University of Hong Kong) (publishedVersion)
- ePrints Soton (University of Southampton) (acceptedVersion)
- Greater South Information System
- Funders
- National Natural Science Foundation of China (81673234)
- Young Elite Scientist Sponsorship Program by CAST (2018QNRC001)
- Beijing Natural Science Foundation (JQ18025)
- Beijing Advanced Innovation Program for Land Surface Science (None)
- Topics
- Physical Sciences › Mathematics › Modeling and Simulation › COVID-19 epidemiological studies
- Social Sciences › Sociology and Political Science › COVID-19 Prevention and Impact
- Health Sciences › Medicine › Infectious Diseases › SARS-CoV-2 and COVID-19 Research
- Keywords
- COVID-19 pandemic, Wuhan lockdown, public health interventions, epidemic spread, human mobility
- MeSH terms
- Betacoronavirus, COVID-19, SARS-CoV-2, China, Communicable Disease Control, Humans, Pneumonia, Viral, Regression Analysis, Travel, Models, Statistical, Public Health Practice, Incidence, Coronavirus Infections, Epidemics, Pandemics
About these checks
Registry, retraction, Cites and statistics results are computed, not judged, with one exception: a printed reference that no index lists is read once by a model before it counts as a citation error. Claims are extracted by a model and kept only when their quote appears verbatim in the text; each cited source is then checked, with a model’s help, for whether it says what the claim relies on. Those verdicts can be wrong — read the claim’s quote and the cited source before relying on one.
Statistics and arithmetic are recomputed, not judged.
Confidence bands are shown only for fields calibrated on our annotated test set. None is calibrated yet, so no band is shown.
What counts as a claim ›How we measure confidence ›How we check this ›
Are you an author, or do you see a problem with this page? Request a review
