

The DOI matches its Crossref record; 88 of the 88 references it cites were found in a registry or an index.
Biotic Interactions Shape the Ecological Distributions of Staphylococcus Species
Open accessAbstract
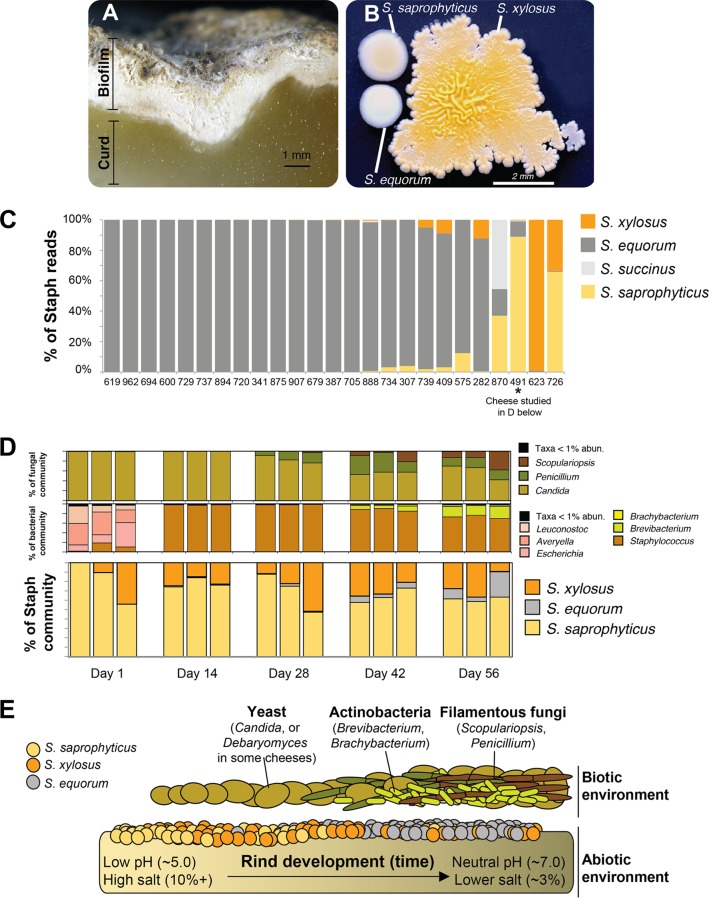
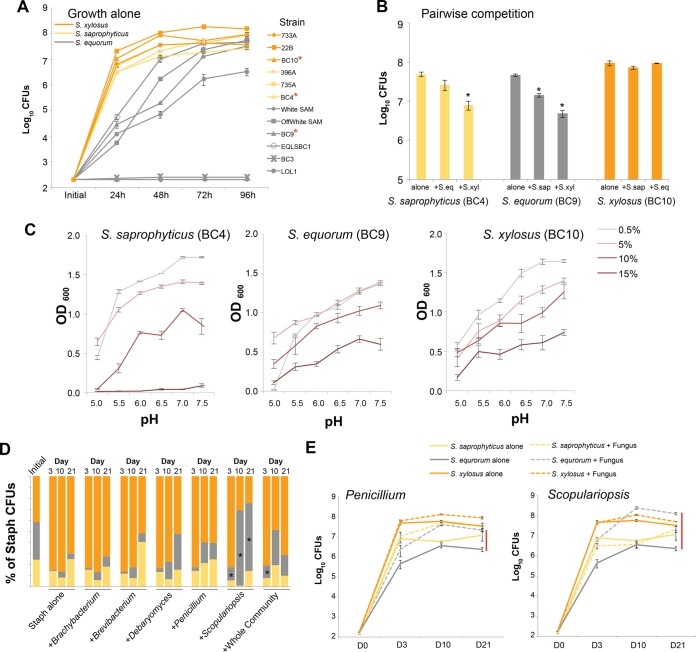
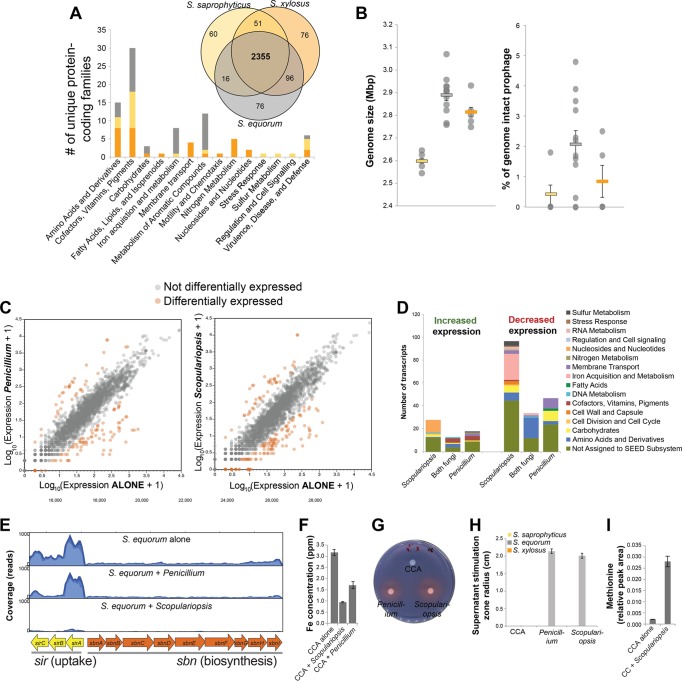
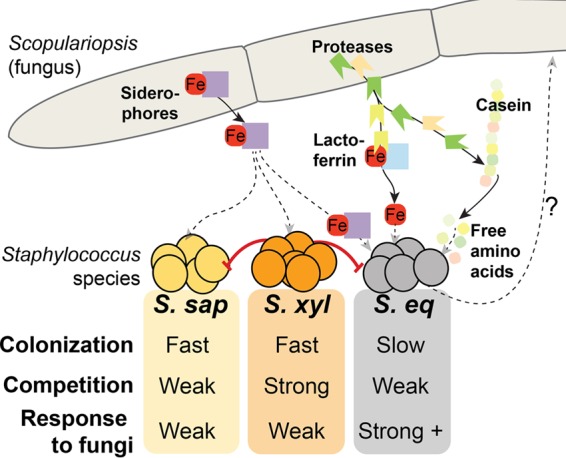
Many metagenomic sequencing studies have observed the presence of closely related bacterial species or genotypes in the same microbiome. Previous attempts to explain these patterns of microdiversity have focused on the abiotic environment, but few have considered how biotic interactions could drive patterns of microbiome diversity. We dissected the patterns, processes, and mechanisms shaping the ecological distributions of three closely related Staphylococcus species in cheese rind biofilms. Paradoxically, the most abundant species (S. equorum) is the slowest colonizer and weakest competitor based on growth and competition assays in the laboratory. Through in vitro community reconstructions, we determined that biotic interactions with neighboring fungi help resolve this paradox. Species-specific stimulation of the poor competitor by fungi of the genus Scopulariopsis allows S. equorum to dominate communities in vitro as it does in situ Results of comparative genomic and transcriptomic experiments indicate that iron utilization pathways, including a homolog of the S. aureus staphyloferrin B siderophore operon pathway, are potential molecular mechanisms underlying Staphylococcus-Scopulariopsis interactions. Our integrated approach demonstrates that fungi can structure the ecological distributions of closely related bacterial species, and the data highlight the importance of bacterium-fungus interactions in attempts to design and manipulate microbiomes. IMPORTANCE: Decades of culture-based studies and more recent metagenomic studies have demonstrated that bacterial species in agriculture, medicine, industry, and nature are unevenly distributed across time and space. The ecological processes and molecular mechanisms that shape these distributions are not well understood because it is challenging to connect in situ patterns of diversity with mechanistic in vitro studies in the laboratory. Using tractable cheese rind biofilms and a focus on coagulase-negative staphylococcus (CNS) species, we demonstrate that fungi can mediate the ecological distributions of closely related bacterial species. One of the Staphylococcus species studied, S. saprophyticus, is a common cause of urinary tract infections. By identifying processes that control the abundance of undesirable CNS species, cheese producers will have more precise control on the safety and quality of their products. More generally, Staphylococcus species frequently co-occur with fungi in mammalian microbiomes, and similar bacterium-fungus interactions may structure bacterial diversity in these systems.
Overview
The claims and statistics of this paper haven’t been checked yet.
Run the check — free, no account needed. It reads the open-access text and checks the sources it cites.
Integrity signals
Registry
Cites
Statistics
Figures
Verification
Claims the paper makes
The claims and statistics of this paper haven’t been checked yet.
Run the check — free, no account needed. It reads the open-access text and checks the sources it cites.
Claims other papers make about this one
Each is checked against this paper’s own text: does it say what the citing paper says it does?
The check wasn’t confident either way, so it gives no verdict — never disputed.
In the citing paper
“fermented meat, for instance, was characterized by L. sakei (typically present during ripening, aging, and fermentation), S. equorum , and Latilactobacillus curvatus .”
From Unexplored microbial diversity from 2,500 food metagenomes and links with the human microbiome. (2024) · cites this paper as [58]
Experimental — accuracy not yet measured
Self-check
Percentages, sums and reported differences re-computed from the paper’s own numbers.
The self-check needs the paper’s full text.
Citations
Cites
The RAST Server: Rapid Annotations using Subsystems Technology
Aziz, R. K., Bartels, D., Best, A. A., DeJongh, M., Disz, T. L., Edwards, R. A., Formsma, K., Gerdes, S., Glass, E. M., Kubal, M., et al. (2008) · BMC Genomics · doi:10.1186/1471-2164-9-75 · Cited by 11,893
Diet rapidly and reproducibly alters the human gut microbiome
David, L. A., Maurice, C. F., Carmody, R. N., Gootenberg, D. B., Button, J. E., Wolfe, B. E., Ling, A. V., Devlin, A. S., Varma, Y., Fischbach, M. A., et al. (2014) · Nature · doi:10.1038/nature12820 · Cited by 10,100
Self-citationChanges of Intestinal Functions in Liver Cirrhosis
Fukui, H., & Wiest, R. (2016) · Inflammatory Intestinal Diseases · doi:10.1159/000444436 · Cited by 6,820
Universal chemical assay for the detection and determination of siderophores
Schwyn, B., & Neilands, J. B. (1987) · Analytical Biochemistry · doi:10.1016/0003-2697(87)90612-9 · Cited by 6,581
Host-Bacterial Mutualism in the Human Intestine
Bäckhed, F., Ley, R. E., Sonnenburg, J. L., Peterson, D. A., & Gordon, J. I. (2005) · Science · doi:10.1126/science.1104816 · Cited by 5,277
Urinary tract infections: epidemiology, mechanisms of infection and treatment options
Flores‐Mireles, A. L., Walker, J. N., Caparon, M. G., & Hultgren, S. J. (2015) · Nature Reviews Microbiology · doi:10.1038/nrmicro3432 · Cited by 4,343
Microbial interactions: from networks to models
Faust, K., & Raes, J. (2012) · Nature Reviews Microbiology · doi:10.1038/nrmicro2832 · Cited by 4,268
Using network analysis to explore co-occurrence patterns in soil microbial communities
Barberán, A., Bates, S. T., Casamayor, E. O., & Fierer, N. (2012) · The ISME Journal · doi:10.1038/ismej.2011.119 · Cited by 3,044
Bacterial competition: surviving and thriving in the microbial jungle
Hibbing, M. E., Fuqua, C., Parsek, M. R., & Peterson, S. B. (2009) · Nature Reviews Microbiology · doi:10.1038/nrmicro2259 · Cited by 2,765
Competition and Biodiversity in Spatially Structured Habitats
Tilman, D. (1994) · Ecology · doi:10.2307/1939377 · Cited by 2,758
Patterns and Processes of Microbial Community Assembly
Nemergut, D. R., Schmidt, S. K., Fukami, T., O’Neill, S., Bilinski, T. M., Stanish, L. F., Knelman, J. E., Darcy, J. L., Lynch, R. C., Wickey, P., et al. (2013) · Microbiology and Molecular Biology Reviews · doi:10.1128/mmbr.00051-12 · Cited by 2,087
Biogeography and individuality shape function in the human skin metagenome
Program, N. C. S., Oh, J., Byrd, A. L., Deming, C., Conlan, S., Kong, H. H., & Segre, J. A. (2014) · Nature · doi:10.1038/nature13786 · Cited by 1,148
General Theory of Competitive Coexistence in Spatially-Varying Environments
Chesson, P. (2000) · Theoretical Population Biology · doi:10.1006/tpbi.2000.1486 · Cited by 988
Niche breadth predicts geographical range size: a general ecological pattern
Slatyer, R., Hirst, M. J., & Sexton, J. P. (2013) · Ecology Letters · doi:10.1111/ele.12140 · Cited by 938
Frey‐Klett, P., Burlinson, P., Deveau, A., Barret, M., Tarkka, M. T., & Sarniguet, A. (2011) · Microbiology and Molecular Biology Reviews · doi:10.1128/mmbr.00020-11 · Cited by 930
Microbes on mountainsides: Contrasting elevational patterns of bacterial and plant diversity
Bryant, J. A., Lamanna, C. A., Morlon, H., Kerkhoff, A. J., Enquist, B. J., & Green, J. L. (2008) · Proceedings of the National Academy of Sciences · doi:10.1073/pnas.0801920105 · Cited by 891
The winnowing: establishing the squid–vibrio symbiosis.
Nyholm, S. V., & McFall-Ngai, M. (2004) · Nature Reviews Microbiology · doi:10.1038/nrmicro957 · Cited by 803
Regional Coexistence of Species and Competition between Rare Species.
Levins, R., & Culver, D. (1971) · Proceedings of the National Academy of Sciences of the United States of America · doi:10.1073/pnas.68.6.1246 · Cited by 783
Stefanie Widder, A., Allen, R. J., Pfeiffer, T., Curtis, T. P., Wiuf, C., Sloan, W. T., Cordero, O. X., Brown, S. P., Momeni, B., Shou, W., et al. (2016) · The ISME Journal · doi:10.1038/ismej.2016.45 · Cited by 742
Interspecific Interactions in Phytophagous Insects: Competition Reexamined and Resurrected
Denno, R. F., McClure, M. S., & Ott, J. R. (1995) · Annual Review of Entomology · doi:10.1146/annurev.en.40.010195.001501 · Cited by 732
Wolfe, B. E., Button, J. E., Santarelli, M., & Dutton, R. J. (2014) · Cell · doi:10.1016/j.cell.2014.05.041 · Cited by 648
Self-citationInParanoid 7: new algorithms and tools for eukaryotic orthology analysis
Ostlund, G., Schmitt, T., Forslund, K., Kostler, T., Messina, D. N., Roopra, S., Frings, O., & Sonnhammer, E. L. L. (2010) · Nucleic Acids Research · doi:10.1093/nar/gkp931 · Cited by 623
Medically important bacterial-fungal interactions
Peleg, A. Y., Hogan, D. A., & Mylonakis, E. (2010) · Nature Reviews Microbiology · doi:10.1038/nrmicro2313 · Cited by 619
Interspecies Interactions within Oral Microbial Communities
Kuramitsu, H. K., He, X., Lux, R., Anderson, M. H., & Shi, W. (2007) · Microbiology and Molecular Biology Reviews · doi:10.1128/mmbr.00024-07 · Cited by 602
Computational analysis of bacterial RNA-Seq data
McClure, R., Balasubramanian, D., Sun, Y., Bobrovskyy, M., Sumby, P., Genco, C. A., Vanderpool, C. K., & Tjaden, B. C. (2013) · Nucleic Acids Research · doi:10.1093/nar/gkt444 · Cited by 584
Interactions in multispecies biofilms: do they actually matter?
Burmølle, M., Ren, D., Bjarnsholt, T., & Sørensen, S. J. (2014) · Trends in Microbiology · doi:10.1016/j.tim.2013.12.004 · Cited by 580
PGAP: pan-genomes analysis pipeline
Zhao, Y., Wu, J., Yang, J., Sun, S., Xiao, J., & Yu, J. M. (2011) · Bioinformatics · doi:10.1093/bioinformatics/btr655 · Cited by 518
Phylogenetic limiting similarity and competitive exclusion
Violle, C., Nemergut, D. R., Pu, Z., & Jiang, L. (2011) · Ecology Letters · doi:10.1111/j.1461-0248.2011.01644.x · Cited by 516
Fine-scale phylogenetic architecture of a complex bacterial community
Acinas, S. G., Klepac‐Ceraj, V., Hunt, D. E., Pharino, C., Ceraj, I., Distel, D. L., & Polz, M. F. (2004) · Nature · doi:10.1038/nature02649 · Cited by 514
Resource Partitioning and Sympatric Differentiation Among Closely Related Bacterioplankton
Hunt, D. E., David, L. A., Gevers, D., Preheim, S. P., Alm, E. J., & Polz, M. F. (2008) · Science · doi:10.1126/science.1157890 · Cited by 501
Soga, T., Ueno, Y., Naraoka, H., Ohashi, Y., Tomita, M., & Nishioka, T. (2002) · Analytical Chemistry · doi:10.1021/ac020064n · Cited by 473
Kreth, J., Merritt, J. L., Shi, W., & Qi, F. (2005) · Journal of Bacteriology · doi:10.1128/jb.187.21.7193-7203.2005 · Cited by 454
Kreth, J., Zhang, Y., & Herzberg, M. C. (2008) · Journal of Bacteriology · doi:10.1128/jb.00276-08 · Cited by 450
Antimicrobial peptide resistance mediates resilience of prominent gut commensals during inflammation
Cullen, T. W., Schofield, W. B., Barry, N. A., Putnam, E. E., Rundell, E. A., Trent, M. S., Degnan, P. H., Booth, C. J., Yu, H., & Goodman, A. L. (2015) · Science · doi:10.1126/science.1260580 · Cited by 395
Fermented Foods as Experimentally Tractable Microbial Ecosystems
Wolfe, B. E., & Dutton, R. J. (2015) · Cell · doi:10.1016/j.cell.2015.02.034 · Cited by 386
Self-citationMolecular Mechanisms of Staphylococcus aureus Iron Acquisition
Hammer, N. D., & Skaar, E. P. (2011) · Annual Review of Microbiology · doi:10.1146/annurev-micro-090110-102851 · Cited by 379
Genotypic Diversity Within a Natural Coastal Bacterioplankton Population
Thompson, J. R., Preheim, S. P., Pharino, C., Klepac‐Ceraj, V., Hunt, D. E., Benoit, J., Sarma-Rupavtarm, R. B., Distel, D. L., & Polz, M. F. (2005) · Science · doi:10.1126/science.1106028 · Cited by 360
Dynamics in microbial communities: unraveling mechanisms to identify principles
Konopka, A. E., Lindemann, S. R., & Fredrickson, J. K. (2014) · The ISME Journal · doi:10.1038/ismej.2014.251 · Cited by 347
Diversity and Dynamics of a North Atlantic Coastal Vibrio Community
Thompson, J. R., Randa, M. A., Marcelino, L. A., Tomita‐Mitchell, A., Lim, E. L., & Polz, M. F. (2004) · Applied and Environmental Microbiology · doi:10.1128/aem.70.7.4103-4110.2004 · Cited by 347
PHYLOGENETIC CLUSTERING AND OVERDISPERSION IN BACTERIAL COMMUNITIES
Horner‐Devine, M. C., & Bohannan, B. J. M. (2006) · Ecology · doi:10.1890/0012-9658(2006)87[100:pcaoib]2.0.co;2 · Cited by 336
Metabolomic Profiling of Anionic Metabolites by Capillary Electrophoresis Mass Spectrometry
Soga, T., Igarashi, K., Ito, C., Mizobuchi, K., Zimmermann, H.-P., & Tomita, M. (2009) · Analytical Chemistry · doi:10.1021/ac900675k · Cited by 331
Fungal—bacterial interactions: a mixed bag of mingling microbes
Wargo, M. J., & Hogan, D. A. (2006) · Current Opinion in Microbiology · doi:10.1016/j.mib.2006.06.001 · Cited by 286
Cordero, O. X., Wildschutte, H., Kirkup, B. C., Proehl, S., Ngo, L., Hussain, F. A., Roux, F. L., Mincer, T. J., & Polz, M. F. (2012) · Science · doi:10.1126/science.1219385 · Cited by 281
The lung mycobiome: an emerging field of the human respiratory microbiome
Nguyen, L. D. N., Viscogliosi, E., & Delhaes, L. (2015) · Frontiers in Microbiology · doi:10.3389/fmicb.2015.00089 · Cited by 260
Ghebremedhin, B., Layer, F., König, W., & König, B. (2008) · Journal of Clinical Microbiology · doi:10.1128/jcm.02058-07 · Cited by 249
Cross-biome comparison of microbial association networks
Faust, K., Lima‐Mendez, G., Lerat, J., Sathirapongsasuti, J. F., Knight, R. D., Huttenhower, C., Lenaerts, T., & Raes, J. (2015) · Frontiers in Microbiology · doi:10.3389/fmicb.2015.01200 · Cited by 210
Patterns and mechanisms of genetic and phenotypic differentiation in marine microbes
Polz, M. F., Hunt, D. E., Preheim, S. P., & Weinreich, D. M. (2006) · Philosophical Transactions of the Royal Society B Biological Sciences · doi:10.1098/rstb.2006.1928 · Cited by 200
Staphylococcus saprophyticus as a Common Cause of Urinary Tract Infections
Hovelius, B., & Mårdh, P. A. (1984) · Clinical Infectious Diseases · doi:10.1093/clinids/6.3.328 · Cited by 193
Who Are You--Staphylococcus saprophyticus?
Raz, R., Colodner, R., & Kunin, C. M. (2005) · Clinical Infectious Diseases · doi:10.1086/428353 · Cited by 178
Vanderhaeghen, W., Piepers, S., Leroy, F., Coillie, E. V., Haesebrouck, F., & Vliegher, S. D. (2014) · The Veterinary Journal · doi:10.1016/j.tvjl.2014.11.001 · Cited by 173
A comprehensive review of the nasal microbiome in chronic rhinosinusitis (CRS)
Mahdavinia, M., Keshavarzian, A., Tobin, M. C., LANDAY, A. L., & Schleimer, R. P. (2015) · Clinical & Experimental Allergy · doi:10.1111/cea.12666 · Cited by 167
Cow Teat Skin, a Potential Source of Diverse Microbial Populations for Cheese Production
Verdier‐Metz, I., Gagné, G., Bornes, S., Monsallier, F., Veisseire, P., Delbès, C., & Montel, M. (2011) · Applied and Environmental Microbiology · doi:10.1128/aem.06229-11 · Cited by 166
Urinary Tract Infections in Young Adult Women Caused by Staphylococcus saprophyticus
Latham, R. H. (1983) · JAMA · doi:10.1001/jama.1983.03340220031028 · Cited by 160
Britigan, B. E., Hayek, M. B., Doebbeling, B. N., & Fick, R. B. (1993) · Infection and Immunity · doi:10.1128/iai.61.12.5049-5055.1993 · Cited by 156
Cai, H., Rodriguez, B. T., Zhang, W., Broadbent, J. R., & Steele, J. L. (2007) · Microbiology · doi:10.1099/mic.0.2007/006452-0 · Cited by 149
Addis, E. P. H., Fleet, G. H., Cox, J. M., Kolak, D. M., & Leung, T. (2001) · International Journal of Food Microbiology · doi:10.1016/s0168-1605(01)00569-4 · Cited by 144
Jeong, B. C., Hawes, C. R., Bonthrone, K. M., & Macaskie, L. E. (1997) · Microbiology · doi:10.1099/00221287-143-7-2509 · Cited by 144
Molecular mechanisms underlying the close association between soil Burkholderia and fungi
Stopnišek, N., Zühlke, D., Carlier, A. L., Barberán, A., Fierer, N., Becher, D., Riedel, K., Eberl, L., & Weisskopf, L. (2015) · The ISME Journal · doi:10.1038/ismej.2015.73 · Cited by 137
Gripon, J. C. (1999) · Springer eBooks · doi:10.1007/978-1-4615-2800-5_4 · Cited by 136
Tremblay, Y. D. N., Lamarche, D., Chever, P., Haine, D., Messier, S. J., & Jacques, M. (2012) · Journal of Dairy Science · doi:10.3168/jds.2012-5795 · Cited by 136
Coton, E., Desmonts, M.-H., Léroy, S., Coton, M., Jamet, E., Christieans, S., Donnio, P.-Y., Lebert, I., & Talòn, R. (2009) · International Journal of Food Microbiology · doi:10.1016/j.ijfoodmicro.2009.11.023 · Cited by 131
Shah, M. M., Iihara, H., Noda, M., Song, S. X., Nhung, P. H., Ohkusu, K., Kawamura, Y., & Ezaki, T. (2007) · INTERNATIONAL JOURNAL OF SYSTEMATIC AND EVOLUTIONARY MICROBIOLOGY · doi:10.1099/ijs.0.64205-0 · Cited by 131
Lamers, R. P., Muthukrishnan, G., Castoe, T. A., Tafur, S., Cole, A. M., & Parkinson, C. L. (2012) · BMC Evolutionary Biology · doi:10.1186/1471-2148-12-171 · Cited by 126
Kinkel, L. L., Schlatter, D., Xiao, K., & Baines, A. D. (2013) · The ISME Journal · doi:10.1038/ismej.2013.175 · Cited by 121
Place, R. B., Hiestand, D., Gallmann, H. R., & Teuber, M. (2003) · Systematic and Applied Microbiology · doi:10.1078/072320203322337281 · Cited by 116
Population Fitness and the Regulation of Escherichia coli Genes by Bacterial Viruses
Chen, Y., Golding, I., Sawai, S., Guo, L., & Cox, E. C. (2005) · PLoS Biology · doi:10.1371/journal.pbio.0030229 · Cited by 110
Pérez-Gutiérrez, R.-A., López-Ramírez, V., Islas-Robles, Á., Alcaraz, L. D., Hernández-González, I., Luna, B., Santillán, M., Eguiarte, L. E., Souza, V., Travisano, M., et al. (2012) · The ISME Journal · doi:10.1038/ismej.2012.119 · Cited by 101
Deveau, A., Brulé, C., Palin, B., Champmartin, D., Rubini, P., Garbaye, J., Sarniguet, A., & Frey‐Klett, P. (2010) · Environmental Microbiology Reports · doi:10.1111/j.1758-2229.2010.00145.x · Cited by 101
Colonization of the female genital tract with Staphylococcus saprophyticus
Rupp, M. E., Soper, D. E., & Archer, G. L. (1992) · Journal of Clinical Microbiology · doi:10.1128/jcm.30.11.2975-2979.1992 · Cited by 100
Carnio, M. C., Höltzel, A., Rudolf, M., Henle, T., Jung, G., & Scherer, S. (2000) · Applied and Environmental Microbiology · doi:10.1128/aem.66.6.2378-2384.2000 · Cited by 98
Rosenthal, A. Z., Matson, E. G., Eldar, A., & Leadbetter, J. R. (2011) · The ISME Journal · doi:10.1038/ismej.2011.3 · Cited by 96
Visscher, A. D., Supré, K., Haesebrouck, F., Zadoks, R. N., Piessens, V., Coillie, E. V., Piepers, S., & Vliegher, S. D. (2014) · Veterinary Microbiology · doi:10.1016/j.vetmic.2014.06.011 · Cited by 94
Growth and adaptation of microorganisms on the cheese surface
Monnet, C., Landaud, S., Bonnarme, P., & Swennen, D. (2015) · FEMS Microbiology Letters · doi:10.1093/femsle/fnu025 · Cited by 87
Xu, J., Tan, X., Zhang, X., Xia, X., & Sun, H. (2015) · Microbial Pathogenesis · doi:10.1016/j.micpath.2015.08.004 · Cited by 83
Braem, G., Vliegher, S. D., Verbist, B., Piessens, V., Coillie, E. V., Vuyst, L. D., & Leroy, F. (2013) · Journal of Dairy Science · doi:10.3168/jds.2012-5493 · Cited by 81
Temperature Affects Species Distribution in Symbiotic Populations of Vibrio spp
Nishiguchi, M. K. (2000) · Applied and Environmental Microbiology · doi:10.1128/aem.66.8.3550-3555.2000 · Cited by 81
Döring, G., Pfestorf, M., Botzenhart, K., & Abdallah, M. A. (1988) · Infection and Immunity · doi:10.1128/iai.56.1.291-293.1988 · Cited by 80
Martínez‐García, E., Jatsenko, T., Kivisaar, M., & de Lorenzo, V. (2014) · Environmental Microbiology · doi:10.1111/1462-2920.12492 · Cited by 75
Fritschie, K. J., Cardinale, B. J., Alexandrou, M. A., & Oakley, T. H. (2013) · Ecology · doi:10.1890/13-0986.1 · Cited by 61
Sugimoto, M., Kaneko, M., Onuma, H., Sakaguchi, Y., Mori, M., Abe, S., Soga, T., & Tomita, M. (2012) · Journal of Agricultural and Food Chemistry · doi:10.1021/jf2048993 · Cited by 60
Growth of Aerobic Ripening Bacteria at the Cheese Surface Is Limited by the Availability of Iron
Monnet, C., Back, A., & Irlinger, F. (2012) · Applied and Environmental Microbiology · doi:10.1128/aem.00085-12 · Cited by 59
Flórez, A. B., & Mayo, B. (2006) · International Dairy Journal · doi:10.1016/j.idairyj.2005.11.008 · Cited by 56
Candida albicans: Molecular interactions with Pseudomonas aeruginosa and Staphylococcus aureus
Lindsay, A. K., & Hogan, D. A. (2014) · Fungal Biology Reviews · doi:10.1016/j.fbr.2014.10.002 · Cited by 45
Allergic fungal rhinosinusitis—more than a fungal disease?
Dutré, T., Dousary, S. H. A., Zhang, N., & Bachert, C. (2013) · Journal of Allergy and Clinical Immunology · doi:10.1016/j.jaci.2013.02.040 · Cited by 37
Button, J. E., & Dutton, R. J. (2012) · Current Biology · doi:10.1016/j.cub.2012.06.014 · Cited by 35
Self-citationDutilh, B. E., Thompson, C. C., Vicente, A. C. P., Marin, M. F. A., Lee, C. C., Silva, G. G., Schmieder, R., Andrade, B. G., Chimetto, L. A., Cuevas, D., et al. (2014) · BMC Genomics · doi:10.1186/1471-2164-15-654 · Cited by 25
Neupane, S., Finlay, R. D., Alström, S., Elfstrand, M., & Högberg, N. O. S. (2014) · Environmental Microbiology Reports · doi:10.1111/1758-2229.12203 · Cited by 20
Quesada, J. M., Soriano, M. I., & Espinosa‐Urgel, M. (2012) · Applied and Environmental Microbiology · doi:10.1128/aem.00901-12 · Cited by 18
Cited by
Sorted by citations
Bacterial–fungal interactions: ecology, mechanisms and challenges
Deveau, A., Bonito, G. M., Uehling, J., Paoletti, M., Becker, M., Bindschedler, S., Hacquard, S., Hervé, V., Labbé, J., Lastovetsky, O. A., et al. (2018) · FEMS Microbiology Reviews · doi:10.1093/femsre/fuy008 · Cited by 823
Effect of Pichia on shaping the fermentation microbial community of sauce-flavor Baijiu
Zhang, H., Wang, L., Tan, Y., Wang, H., Yang, F., Chen, L., Hao, F., Lv, X., Du, H., & Xu, Y. (2020) · International Journal of Food Microbiology · doi:10.1016/j.ijfoodmicro.2020.108898 · Cited by 210
Zhang, Y., Kastman, E. K., Guasto, J., & Wolfe, B. E. (2018) · Nature Communications · doi:10.1038/s41467-017-02522-z · Cited by 149
Self-citationMayo, B., Rodríguez, J., Vázquez, L., & Flórez, A. B. (2021) · Foods · doi:10.3390/foods10030602 · Cited by 169
Unexplored microbial diversity from 2,500 food metagenomes and links with the human microbiome.
Carlino, N., Blanco-Míguez, A., Punčochář, M., Mengoni, C., Pinto, F., Tatti, A., Manghi, P., Armanini, F., Avagliano, M., Barcenilla, C., et al. (2024) · Cell · doi:10.1016/j.cell.2024.07.039 · Cited by 146
Metadata
- Authors
- Kastman, E. K., Kamelamela, N., Norville, J. W., Cosetta, C. M., Dutton, R. J., & Wolfe, B. E.
- Affiliations
- Tufts University (US)
- University of California San Diego (US)
- Corresponding author
- Wolfe, Benjamin E.
- Venue
- mBio
- Publisher
- American Society for Microbiology
- Published
- 2016-11-02
- Volume
- 7
- Issue
- 5
- ISSN
- 2150-7511 (ISSN-L)
- 2161-2129
- PMC
- PMC5082897
- OpenAlex
- W2538439703
- Cited by
- 127
- References
- 88
- Citations by year
- 2026: 7 · 2025: 14 · 2024: 14 · 2023: 18 · 2022: 4 · 2021: 15 · 2020: 13 · 2019: 14 · 2018: 18 · 2017: 9 · 2016: 1
- FWCI
- 12.24
- Type
- journal article
- Language
- en
- Update notices
- correction (2017-03-21)
- Open access
- gold
- doi.org
- Licence
- Locations
- mBio (publishedVersion, cc-by)
- PubMed Central (publishedVersion, cc-by)
- PubMed (publishedVersion)
- eScholarship (California Digital Library) (submittedVersion, cc-by)
- DOAJ (DOAJ: Directory of Open Access Journals) (submittedVersion, cc-by-sa)
- DOAJ (DOAJ: Directory of Open Access Journals) (submittedVersion)
- eScholarship (California Digital Library) (submittedVersion)
- Funders
- HHS | National Institutes of Health (P50 GM068763)
- Tufts University
- UC | University of California, San Diego
- Topics
- Physical Sciences › Environmental Science › Ecology › Microbial Community Ecology and Physiology
- Life Sciences › Biochemistry, Genetics and Molecular Biology › Molecular Biology › Bacterial biofilms and quorum sensing
- Health Sciences › Medicine › Infectious Diseases › Antimicrobial Resistance in Staphylococcus
- Keywords
- Staphylococcus, Staphylococcus equorum, Staphylococcus saprophyticus, Scopulariopsis, coagulase-negative staphylococci, ecological distribution, bacterial competition, colonization, iron utilization, siderophores, microbiota composition, urinary tract infection
- MeSH terms
- Food Microbiology, Iron, Staphylococcus, Gene Expression Profiling, Genomics, Microbial Interactions, Biota, Scopulariopsis
About these checks
Registry, retraction, Cites and statistics results are computed, not judged, with one exception: a printed reference that no index lists is read once by a model before it counts as a citation error. Claims are extracted by a model and kept only when their quote appears verbatim in the text; each cited source is then checked, with a model’s help, for whether it says what the claim relies on. Those verdicts can be wrong — read the claim’s quote and the cited source before relying on one.
Statistics and arithmetic are recomputed, not judged.
Confidence bands are shown only for fields calibrated on our annotated test set. None is calibrated yet, so no band is shown.
What counts as a claim ›How we measure confidence ›How we check this ›
Are you an author, or do you see a problem with this page? Request a review
