

The DOI matches its Crossref record; 62 of the 62 references it cites were found in a registry or an index.
Impact of Dietary Resistant Starch on the Human Gut Microbiome, Metaproteome, and Metabolome
Open accessAbstract
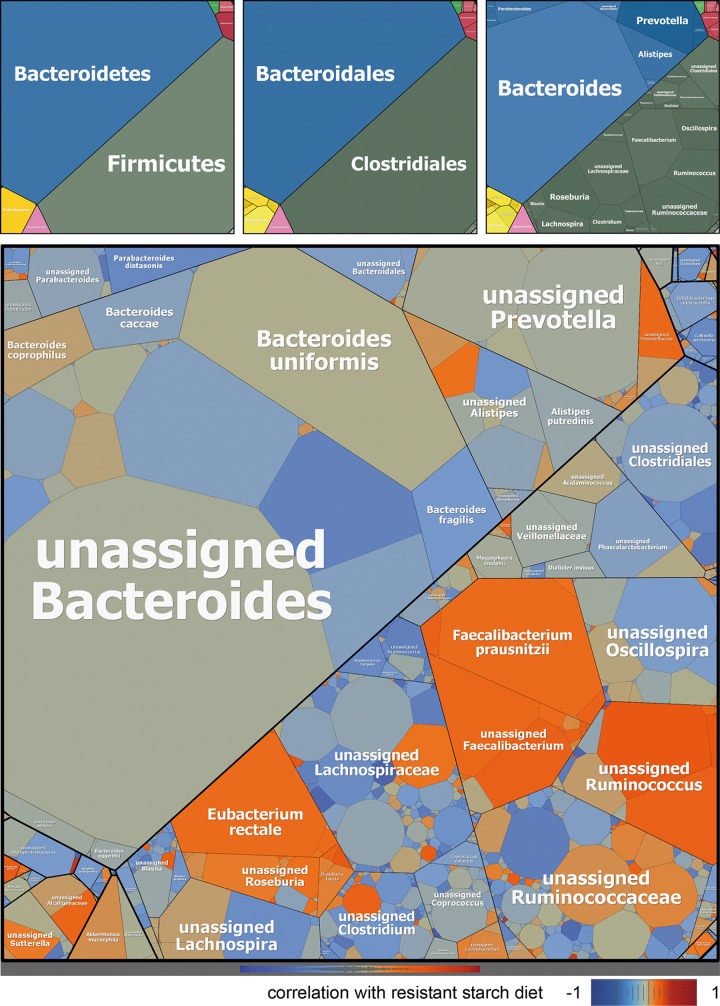
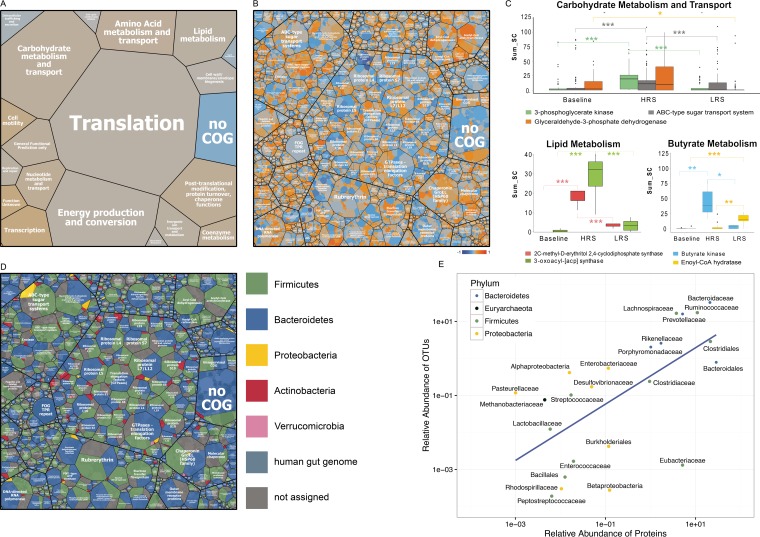
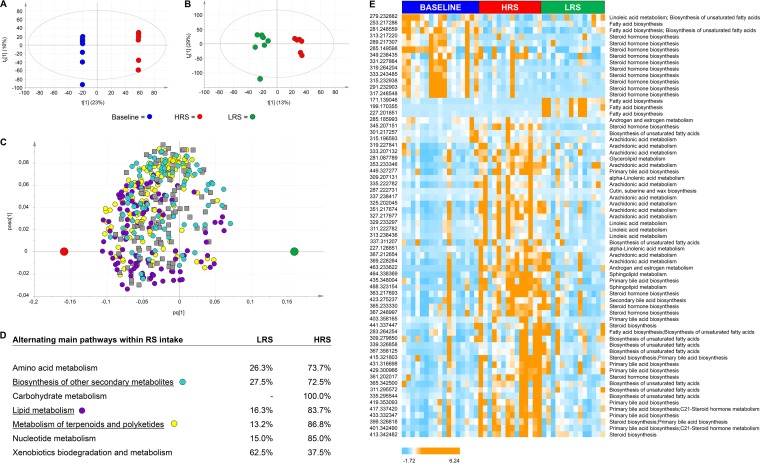
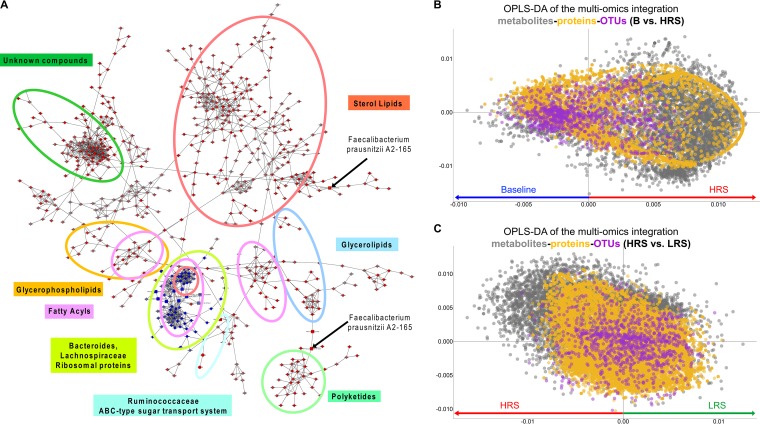
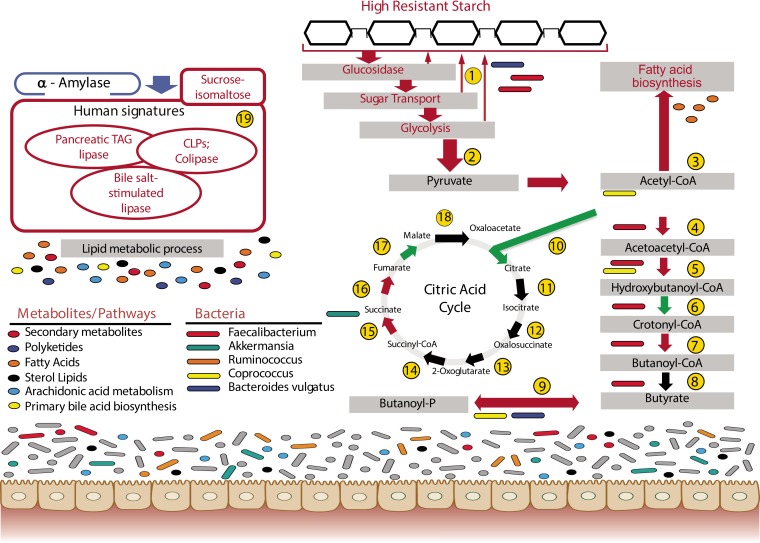
Diet can influence the composition of the human microbiome, and yet relatively few dietary ingredients have been systematically investigated with respect to their impact on the functional potential of the microbiome. Dietary resistant starch (RS) has been shown to have health benefits, but we lack a mechanistic understanding of the metabolic processes that occur in the gut during digestion of RS. Here, we collected samples during a dietary crossover study with diets containing large or small amounts of RS. We determined the impact of RS on the gut microbiome and metabolic pathways in the gut, using a combination of “omics” approaches, including 16S rRNA gene sequencing, metaproteomics, and metabolomics. This multiomics approach captured changes in the abundance of specific bacterial species, proteins, and metabolites after a diet high in resistant starch (HRS), providing key insights into the influence of dietary interventions on the gut microbiome. The combined data showed that a high-RS diet caused an increase in the ratio of Firmicutes to Bacteroidetes, including increases in relative abundances of some specific members of the Firmicutes and concurrent increases in enzymatic pathways and metabolites involved in lipid metabolism in the gut. IMPORTANCE This work was undertaken to obtain a mechanistic understanding of the complex interplay between diet and the microorganisms residing in the intestine. Although it is known that gut microbes play a key role in digestion of the food that we consume, the specific contributions of different microorganisms are not well understood. In addition, the metabolic pathways and resultant products of metabolism during digestion are highly complex. To address these knowledge gaps, we used a combination of molecular approaches to determine the identities of the microorganisms in the gut during digestion of dietary starch as well as the metabolic pathways that they carry out. Together, these data provide a more complete picture of the function of the gut microbiome in digestion, including links between an RS diet and lipid metabolism and novel linkages between specific gut microbes and their metabolites and proteins produced in the gut.
Overview
The claims and statistics of this paper haven’t been checked yet.
Run the check — free, no account needed. It reads the open-access text and checks the sources it cites.
Integrity signals
Registry
Cites
Statistics
Figures
Verification
Claims the paper makes
The claims and statistics of this paper haven’t been checked yet.
Run the check — free, no account needed. It reads the open-access text and checks the sources it cites.
Claims other papers make about this one
Each is checked against this paper’s own text: does it say what the citing paper says it does?
The source backs part of the claim, not all of it — or backs it for a different population, condition or comparison.
In the citing paper
“The sympathetic and parasympathetic systems can influence ENS neurocircuitry, resulting in changes in motility which can affect the rate of delivery of pre and pro-biotics to the small intestine and colon, including resistant starches and dietary fibers, and other critical microbial nutrients (Maier et al., 2017).”
From The Microbiota-Gut-Brain Axis (2019) · cites this paper as Maier et al., 2017
Experimental — accuracy not yet measuredThe source backs part of the claim, not all of it — or backs it for a different population, condition or comparison.
In the citing paper
“A randomized study of 39 individuals found that a high resistant starch diet resulted in a significant increase in the Firmicutes:Bacteroidetes, along with an increase in the overall relative abundance of Firmicutes, alongside an increase in enzymatic pathways and metabolites associated with lipid metabolism in the gut (Maier et al., 2017).”
From The Microbiota-Gut-Brain Axis (2019) · cites this paper as Maier et al., 2017
Experimental — accuracy not yet measuredIn the citing paper
“Diets high in MACs alter microbiota composition in humans within days or weeks (10, 11).”
From The gut microbiota at the intersection of diet and human health (2018) · cites this paper as [11]
In the citing paper
“Different resistant starches have been shown to induce different changes in the gut microbiota composition in animal models (Lyte et al., 2016;Maier et al., 2017).”
From The Microbiota-Gut-Brain Axis (2019) · cites this paper as Maier et al., 2017
Self-check
Percentages, sums and reported differences re-computed from the paper’s own numbers.
The self-check needs the paper’s full text.
Citations
Cites
R: A Language and Environment for Statistical Computing
R Core Team (2000) · doi:10.32614/r.manuals · Cited by 355,893
Moderated estimation of fold change and dispersion for RNA-seq data with DESeq2
Love, M. I., Huber, W., & Anders, S. (2014) · Genome Biology · doi:10.1186/s13059-014-0550-8 · Cited by 95,106
Cytoscape: A software Environment for integrated models of biomolecular interaction networks
Shannon, P., Markiel, A., Ozier, O., Baliga, N. S., Wang, J. T., Ramage, D., Amin, N., Schwikowski, B., & Ideker, T. (2003) · Genome Research · doi:10.1101/gr.1239303 · Cited by 51,888
KEGG: Kyoto Encyclopedia of Genes and Genomes
Kanehisa, M. (2000) · Nucleic Acids Research · doi:10.1093/nar/28.1.27 · Cited by 37,077
QIIME allows analysis of high-throughput community sequencing data
Caporaso, J. G., Kuczynski, J., Stombaugh, J., Bittinger, K., Bushman, F. D., Costello, E. K., Fierer, N., Peña, A. G., Goodrich, J. K., Gordon, J. I., et al. (2010) · Nature Methods · doi:10.1038/nmeth.f.303 · Cited by 34,887
Self-citationKEGG: Kyoto Encyclopedia of Genes and Genomes
Ogata, H., Goto, S., Sato, K., Fujibuchi, W., Bono, H., & Kanehisa, M. (1999) · Nucleic Acids Research · doi:10.1093/nar/27.1.29 · Cited by 31,232
phyloseq: An R Package for Reproducible Interactive Analysis and Graphics of Microbiome Census Data
McMurdie, P. J., & Holmes, S. (2013) · PLoS ONE · doi:10.1371/journal.pone.0061217 · Cited by 21,942
Structure, function and diversity of the healthy human microbiome
The Human Microbiome Project Consortium (2012) · Nature · doi:10.1038/nature11234 · Cited by 11,726
Global patterns of 16S rRNA diversity at a depth of millions of sequences per sample
Caporaso, J. G., Lauber, C. L., Walters, W. A., Berg-Lyons, D., Lozupone, C., Turnbaugh, P. J., Fierer, N., & Knight, R. D. (2010) · Proceedings of the National Academy of Sciences · doi:10.1073/pnas.1000080107 · Cited by 9,944
Self-citationKEGG: new perspectives on genomes, pathways, diseases and drugs
Kanehisa, M., Furumichi, M., Tanabe, M., Sato, Y., & Morishima, K. (2017) · Nucleic Acids Research · doi:10.1093/nar/gkw1092 · Cited by 8,865
Research works printed but not linked: 1
- R Team . 2015. RStudio: integrated development for R, v0.99.489. RStudio, Inc, Boston, MA. http://www.rstudio.com/ .
Cited by
Sorted by citations
Cryan, J. F., O'Riordan, K. J., Cowan, C. S. M., Sandhu, K. V., Bastiaanssen, T. F. S., Boehme, M., Codagnone, M. G., Cussotto, S., Fulling, C., Golubeva, A. V., et al. (2019) · Physiological Reviews · doi:10.1152/physrev.00018.2018 · Cited by 5,286
Microbiota in health and diseases
Hou, K., Wu, Z.-X., Chen, X.-Y., Wang, J.-Q., Zhang, D., Xiao, C., Zhu, D., Koya, J. B., Wei, L., Li, J., et al. (2022) · Signal Transduction and Targeted Therapy · doi:10.1038/s41392-022-00974-4 · Cited by 3,171
Current understanding of the human microbiome
Gilbert, J. A., Blaser, M. J., Caporaso, J. G., Jansson, J. K., Lynch, S. V., & Knight, R. (2018) · Nature Medicine · doi:10.1038/nm.4517 · Cited by 2,609
Self-citationThe gut microbiota at the intersection of diet and human health
Gentile, C. L., & Weir, T. L. (2018) · Science · doi:10.1126/science.aau5812 · Cited by 1,049
Daily sampling reveals personalized diet-microbiome associations in humans
Johnson, A. J., Vangay, P., Al-Ghalith, G. A., Hillmann, B. M., Ward, T. L., Shields-Cutler, R. R., Kim, A. D., Shmagel, A. K., Syed, A. N., Walter, J., et al. (2019) · Cell Host & Microbe · doi:10.1016/j.chom.2019.05.005 · Cited by 742
Metadata
- Authors
- Maier, T. V., Lucio, M., Lee, L. H., VerBerkmoes, N. C., Brislawn, C. J., Bernhardt, J., Lamendella, R., McDermott, J. E., Bergeron, N., Heinzmann, S. S., Morton, J. T., González, A., Ackermann, G., Knight, R., Riedel, K., Krauss, R. M., Schmitt-Kopplin, P., & Jansson, J. K.
- Affiliations
- Helmholtz Munich (DE)
- Brigham and Women's Hospital (US)
- The University of Texas at El Paso (US)
- Pacific Northwest National Laboratory (US)
- Universität Greifswald (DE)
- Juniata College (US)
- Touro University California (US)
- University of California San Diego (US)
- Children’s Hospital Oakland Research Institute, Oakland, California, USA
- Research Unit Analytical BioGeoChemistry, Helmholtz Zentrum München, Neuherberg, Germany
- Corresponding author
- Jansson, Janet K.
- ORCID
- Venue
- mBio
- Publisher
- American Society for Microbiology
- Published
- 2017-11-08
- Volume
- 8
- Issue
- 5
- ISSN
- 2150-7511 (ISSN-L)
- 2161-2129
- PMC
- PMC5646248
- OpenAlex
- W2765206455
- Cited by
- 316
- References
- 61
- Citations by year
- 2026: 18 · 2025: 32 · 2024: 32 · 2023: 33 · 2022: 45 · 2021: 57 · 2020: 39 · 2019: 38 · 2018: 20 · 2017: 1
- FWCI
- 10.94
- Type
- journal article
- Language
- en
- Open access
- gold
- doi.org
- Licence
- Locations
- mBio (publishedVersion, cc-by)
- Europe PMC (PubMed Central) (publishedVersion, cc-by)
- PubMed Central (publishedVersion, cc-by)
- PubMed (publishedVersion)
- PuSH - Publication Server of Helmholtz Zentrum München (submittedVersion, cc-by)
- Digital Access to Scholarship at Harvard (DASH) (Harvard University) (submittedVersion, cc-by)
- Touro Scholar (Touro College) (submittedVersion, cc-by)
- DOAJ (DOAJ: Directory of Open Access Journals) (submittedVersion, cc-by-sa)
- DOAJ (DOAJ: Directory of Open Access Journals) (submittedVersion)
- eScholarship (California Digital Library) (submittedVersion)
- Site cant be reached (submittedVersion, cc-by)
- OSTI OAI (U.S. Department of Energy Office of Scientific and Technical Information) (submittedVersion)
- Funders
- Ingredion Incorporated
- HHS | National Institutes of Health (DK086472)
- DOE | Laboratory Directed Research and Development
- General Mills
- Topics
- Life Sciences › Biochemistry, Genetics and Molecular Biology › Molecular Biology › Gut microbiota and health
- Health Sciences › Nursing › Nutrition and Dietetics › Food composition and properties
- Health Sciences › Nursing › Nutrition and Dietetics › Microbial Metabolites in Food Biotechnology
- Keywords
- resistant starch, gut microbiota, metaproteomics, metabolomics, Firmicutes, Bacteroidetes, lipid metabolism, microbial metabolic pathways, diet-microbiome interactions, gut microbiota metabolites
- MeSH terms
- Gastrointestinal Microbiome, Bacteria, Diet, DNA, Bacterial, DNA, Ribosomal, Humans, RNA, Ribosomal, 16S, Starch, Sequence Analysis, DNA, Proteome, Proteomics, Metabolomics, Metabolome, Microbiota
About these checks
Registry, retraction, Cites and statistics results are computed, not judged, with one exception: a printed reference that no index lists is read once by a model before it counts as a citation error. Claims are extracted by a model and kept only when their quote appears verbatim in the text; each cited source is then checked, with a model’s help, for whether it says what the claim relies on. Those verdicts can be wrong — read the claim’s quote and the cited source before relying on one.
Statistics and arithmetic are recomputed, not judged.
Confidence bands are shown only for fields calibrated on our annotated test set. None is calibrated yet, so no band is shown.
What counts as a claim ›How we measure confidence ›How we check this ›
Are you an author, or do you see a problem with this page? Request a review
