

The DOI matches its Crossref record; 7 of the 7 references it cites were found in a registry or an index.
A More Robust Gut Microbiota in Calorie-Restricted Mice Is Associated with Attenuated Intestinal Injury Caused by the Chemotherapy Drug Cyclophosphamide
Abstract
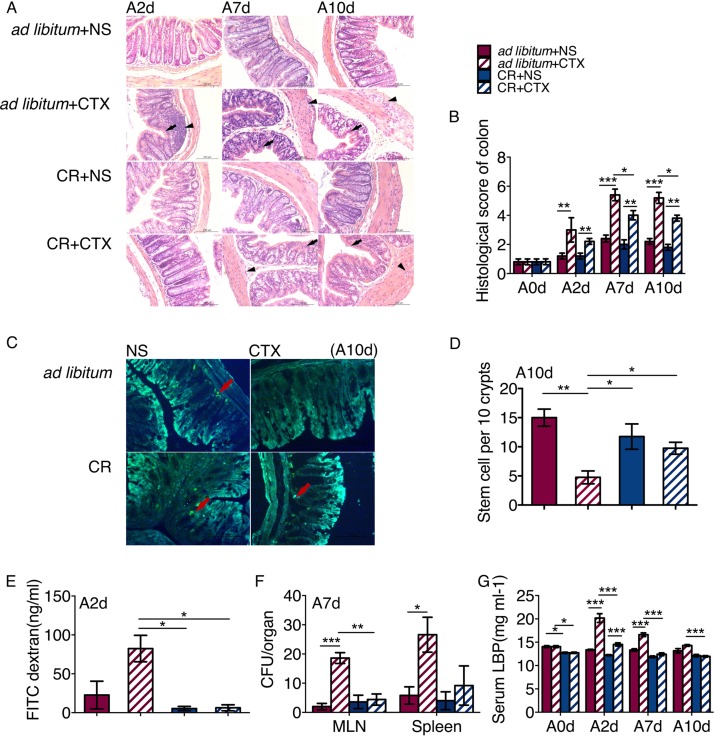
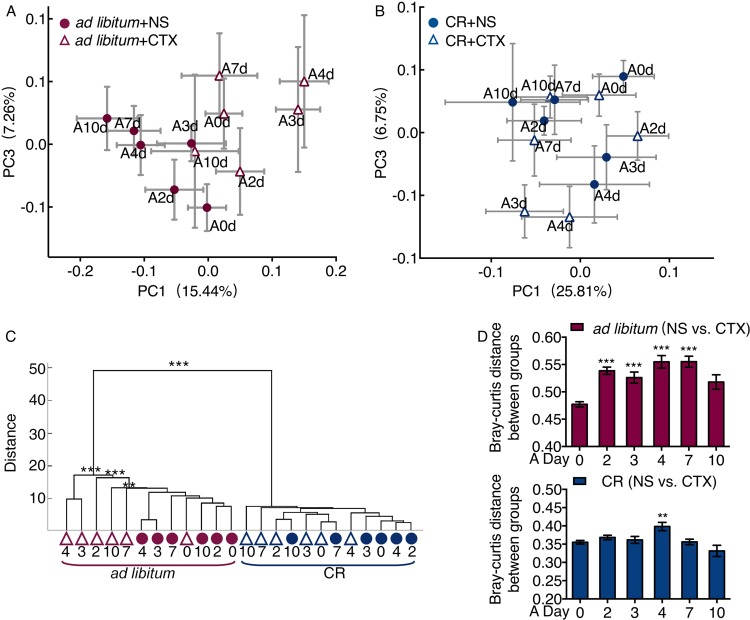
Improving the gut microbiota via calorie restriction is beneficial for human health. Our findings showed differential responses between calorie-restricted mice and ad libitum -fed mice. Compared with the ad libitum -fed mice, the calorie-restricted mice were less susceptible to cyclophosphamide side effects otherwise observed on the gut integrity and its microbiota. These results show the potential benefits of manipulating the gut microbiota with CR prior to cancer chemotherapy.
Overview
The claims and statistics of this paper haven’t been checked yet.
Run the check — free, no account needed. It reads the open-access text and checks the sources it cites.
Integrity signals
Registry
Cites
Statistics
Figures
Verification
Claims the paper makes
The claims and statistics of this paper haven’t been checked yet.
Run the check — free, no account needed. It reads the open-access text and checks the sources it cites.
Claims other papers make about this one
Each is checked against this paper’s own text: does it say what the citing paper says it does?
In the citing paper
“SCXN promoted the growth of various SCFAs producers, among which Roseburia (Lachnospiraceae) and Ruminococcaceae belong to the main butyrate-producing taxa, Clostridia, and Bifidobacterium and Bacteroides are the main acetate and propionate producers52–54.”
From Combining gut microbiota modulation and chemotherapy by capecitabine-loaded prebiotic nanoparticle improves colorectal cancer therapy (2023) · cites this paper as [54]
Self-check
Percentages, sums and reported differences re-computed from the paper’s own numbers.
The self-check needs the paper’s full text.
Citations
Cites
The human microbiome: at the interface of health and disease
Cho, I., & Blaser, M. J. (2012) · Nature Reviews Genetics · doi:10.1038/nrg3182 · Cited by 3,449
Gut bacteria selectively promoted by dietary fibers alleviate type 2 diabetes
Zhao, L., Zhang, F., Ding, X., Wu, G., Lam, Y. Y., Wang, X., Fu, H., Xue, X., Lu, C., Ma, J., et al. (2018) · Science · doi:10.1126/science.aao5774 · Cited by 2,304
Self-citationAutophagy and aging: The importance of maintaining "clean" cells
Cuervo, A. M., Bergamini, E., Brunk, U. T., Dröge, W., Ffrench, M., & Terman, A. (2005) · Autophagy · doi:10.4161/auto.1.3.2017 · Cited by 792
Raffaghello, L., Lee, C., Safdie, F. M., Wei, M., Madia, F., Bianchi, G., & Longo, V. D. (2008) · Proceedings of the National Academy of Sciences · doi:10.1073/pnas.0708100105 · Cited by 587
Anderson, R. C., Cookson, A. L., McNabb, W. C., Park, Z., McCann, M. J., Kelly, W. J., & Roy, N. C. (2010) · BMC Microbiology · doi:10.1186/1471-2180-10-316 · Cited by 510
Calorie restriction and prevention of age‐associated chronic disease
Omodei, D., & Fontana, L. (2011) · FEBS Letters · doi:10.1016/j.febslet.2011.03.015 · Cited by 293
Eutamene, H., Lamine, F., Chabo, C., Theodorou, V., Rochat, F., Bergonzelli, G. E., Corthésy-Theulaz, I., Fioramonti, J., & Bueno, L. (2007) · The Journal of Nutrition · doi:10.1093/jn/137.8.1901 · Cited by 169
Research works printed but not linked: 54
- 10.1158/0008-5472.CAN-10-2788 · DOI · Paper page
- 10.1093/annonc/mdf013 · DOI
- 10.1002/cncr.11713 · DOI
- 10.1038/nrclinonc.2009.146 · DOI
- 10.1042/cs0920385 · DOI
- Parrilli G, Iaffaioli RV, Martorano M, Cuomo R, Tafuto S, Zampino MG, Budillon G, Bianco AR. 1989. Effects of anthracycline therapy on intestinal absorption in patients with advanced breast cancer. Cancer Res 49:3689–3691.
- 10.1158/0008-5472.CAN-04-0580 · DOI
- 10.1152/ajpgi.1997.273.2.G253 · DOI
- 10.1136/gut.47.5.632 · DOI
- 10.1186/1471-2407-13-56 · DOI
- 10.1007/s00520-006-0040-y · DOI
- 10.1080/08035320510043853 · DOI
- 10.1038/sj.ejcn.1602792 · DOI
- 10.1128/JCM.38.2.931-934.2000 · DOI
- Weglarz L, Dzierzewicz Z, Skop B, Orchel A, Parfiniewicz B, Wiśniowska B, Swiatkowska L, Wilczok T. 2003. Desulfovibrio desulfuricans lipopolysaccharides induce endothelial cell IL-6 and IL-8 secretion and E-selectin and VCAM-1 expression. Cell Mol Biol Lett 8:991–1003.
- 10.1016/j.earlhumdev.2006.12.002 · DOI
- 10.1152/ajpgi.1999.276.4.G941 · DOI
- 10.1016/S0168-8278(02)00142-3 · DOI
- 10.1053/gast.2001.27224 · DOI
- 10.1136/gut.52.7.988 · DOI · Paper page
- 10.1126/science.1240537 · DOI · Paper page
- 10.1086/599346 · DOI
- 10.1073/pnas.1005963107 · DOI · Paper page
- 10.1111/j.1753-4887.2004.tb00045.x · DOI
- 10.1038/ismej.2012.27 · DOI
- 10.1038/ncomms3163 · DOI · Paper page
- 10.1186/s40168-018-0440-5 · DOI
- 10.4161/cc.9.4.10766 · DOI
- 10.1158/0008-5472.CAN-09-3228 · DOI
- 10.2337/db07-1403 · DOI · Paper page
- 10.1111/j.1574-6968.2009.01514.x · DOI · Paper page
- 10.1038/nature11319 · DOI · Paper page
- 10.1002/1097-0142(19890201)63:3<604::AID-CNCR2820630334>3.0.CO;2-2 · DOI
- 10.1126/science.1240527 · DOI · Paper page
- 10.4161/cbt.6.9.4622 · DOI
- 10.1126/scitranslmed.3003293 · DOI
- 10.1038/nature11550 · DOI · Paper page
- 10.1128/IAI.00319-08 · DOI
- 10.1111/j.1574-6968.2010.02038.x · DOI
- 10.1016/j.alcohol.2008.12.009 · DOI
- 10.1111/j.1462-2920.2009.02066.x · DOI
- 10.1177/0148607104028004210 · DOI
- 10.1093/ajcn/68.1.118 · DOI
- 10.1667/RR13352.1 · DOI
- 10.1053/j.gastro.2006.06.015 · DOI
- 10.1126/science.1213214 · DOI · Paper page
- 10.1038/nature08530 · DOI · Paper page
- 10.1128/aem.63.7.2802-2813.1997 · DOI
- Illumina Inc. 2013. 16S metagenomic sequencing library preparation. Preparing 16S ribosomal RNA gene amplicons for the Illumina MiSeq system. Part 15044223. Rev. B. Illumina Inc, San Diego, CA.
- 10.1093/bioinformatics/btq461 · DOI
- 10.1038/nmeth.2604 · DOI
- 10.1093/nar/gkn879 · DOI
- 10.1038/nmeth.f.303 · DOI · Paper page
- 10.1016/S0166-4328(01)00297-2 · DOI · Paper page
Cited by
Sorted by citations
Guild-based analysis for understanding gut microbiome in human health and diseases
Wu, G., Zhao, N., Zhang, C., Lam, Y. Y., & Zhao, L. (2021) · Genome Medicine · doi:10.1186/s13073-021-00840-y · Cited by 203
Self-citationLang, T., Zhu, R., Zhu, X., Yan, W., Li, Y., Zhai, Y., Wu, T., Huang, X., Yin, Q., & Li, Y. (2023) · Nature Communications · doi:10.1038/s41467-023-40439-y · Cited by 133
Metadata
- Authors
- Liu, T., Wu, Y., Wang, L., Pang, X., Zhao, L., Yuan, H., & Zhang, C.
- Affiliations
- State Key Laboratory of Microbial Metabolism, Joint International Research Laboratory of Metabolic and Developmental Sciences, and School of Life Sciences and Biotechnology, Shanghai Jiao Tong University, Shanghai, China
- Henan Provincial People’s Hospital, Zhengzhou, Henan Province, China
- Venue
- mBio
- Publisher
- American Society for Microbiology
- Published
- 2019-04-30
- Volume
- 10
- Issue
- 2
- ISSN
- 2161-2129
- 2150-7511
- PMC
- PMC6414708
- Cited by
- 56
- References
- 7
- Language
- en
- Funders
- National Natural Science Foundation of China (81871091, 31330005, 81401141)
- Science and Technology Commission of Shanghai Municipality (14YF1402200)
About these checks
Registry, retraction, Cites and statistics results are computed, not judged, with one exception: a printed reference that no index lists is read once by a model before it counts as a citation error. Claims are extracted by a model and kept only when their quote appears verbatim in the text; each cited source is then checked, with a model’s help, for whether it says what the claim relies on. Those verdicts can be wrong — read the claim’s quote and the cited source before relying on one.
Statistics and arithmetic are recomputed, not judged.
Confidence bands are shown only for fields calibrated on our annotated test set. None is calibrated yet, so no band is shown.
What counts as a claim ›How we measure confidence ›How we check this ›
Are you an author, or do you see a problem with this page? Request a review
