

The DOI matches its Crossref record; 9 of the 9 references it cites were found in a registry or an index.
Assessing the Variation within the Oral Microbiome of Healthy Adults
Published version of a preprint
Abstract
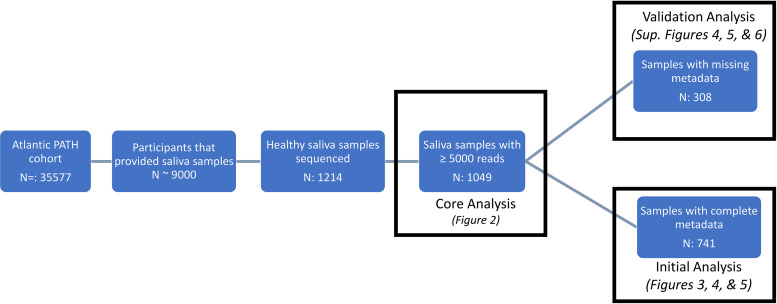
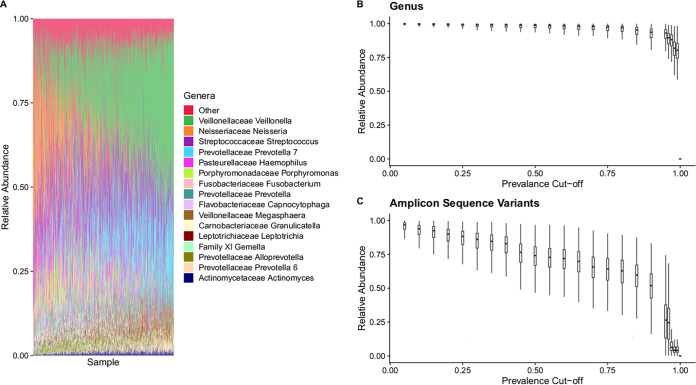
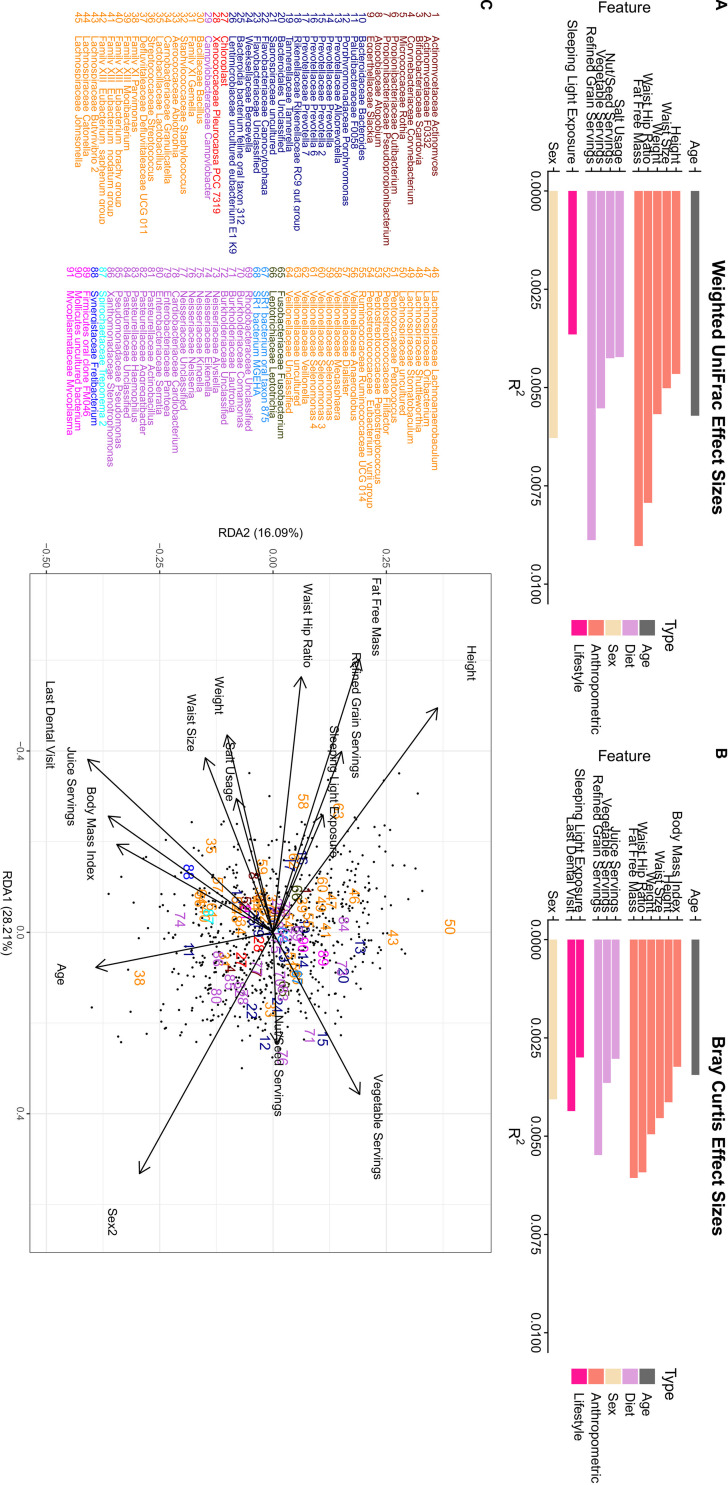
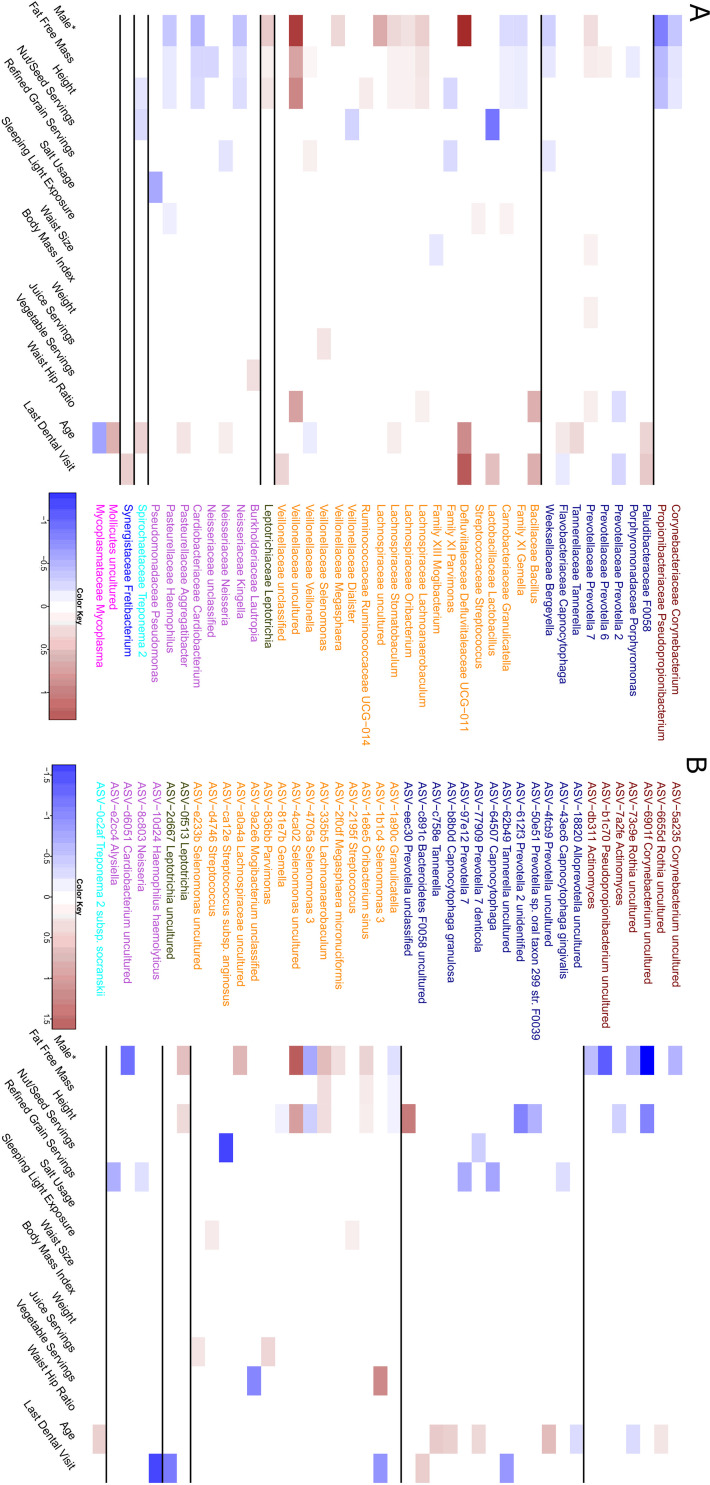
The human oral cavity is inhabited by a diverse community of microbes, known as the human oral microbiome. These microbes play a role in maintaining both oral and systemic health and, as such, have been proposed to be useful biomarkers of disease. However, to identify these biomarkers, we first need to determine the composition and variation of the healthy oral microbiome. In this report, we investigate the oral microbiome of 1,049 healthy individuals to determine which genera and amplicon sequence variants are commonly found between individual oral microbiomes. We then further investigate how lifestyle, anthropometric, and dietary choices impact overall microbiome composition. Interestingly, the results from this investigation showed that while many features were significantly associated with oral microbiome composition, no single biological factor explained a variation larger than 2%. These results indicate that future work on biomarker detection may be encouraged by the lack of strong confounding factors.
Overview
The claims and statistics of this paper haven’t been checked yet.
Run the check — free, no account needed. It reads the open-access text and checks the sources it cites.
Integrity signals
Registry
Cites
Statistics
Figures
Verification
Claims the paper makes
The claims and statistics of this paper haven’t been checked yet.
Run the check — free, no account needed. It reads the open-access text and checks the sources it cites.
Claims other papers make about this one
Each is checked against this paper’s own text: does it say what the citing paper says it does?
In the citing paper
“Many studies have explored the association between gender and salivary microbiome, and reported that there was gender-specific difference in the salivary microbiome [56,57].”
From Saliva microbiome alterations in dental fluorosis population (2023) · cites this paper as [57]
In the citing paper
“However, at present, research on the dental plaque microbiota of school-aged children with dental fluorosis remains limited.”
From Severity-dependent alterations in oral microbiota and antibiotic resistance in children with dental fluorosis (2026) · cites this paper as [18]
Self-check
Percentages, sums and reported differences re-computed from the paper’s own numbers.
The self-check needs the paper’s full text.
Citations
Cites
Reproducible, interactive, scalable and extensible microbiome data science using QIIME 2
Bolyen, E., Rideout, J. R., Dillon, M. R., Bokulich, N. A., Abnet, C. C., Al-Ghalith, G. A., Alexander, H., Alm, E. J., Arumugam, M., Asnicar, F., et al. (2019) · Nature Biotechnology · doi:10.1038/s41587-019-0209-9 · Cited by 23,742
Self-citationMicrobial complexes in subgingival plaque
Socransky, S. S., Haffajee, A. D., Cugini, M. A., Smith, C., & Kent, R. L. (1998) · Journal of Clinical Periodontology · doi:10.1111/j.1600-051x.1998.tb02419.x · Cited by 5,050
Dewhirst, F. E., Chen, T., Izard, J., Paster, B. J., Tanner, A. C. R., Yu, W.-H., Lakshmanan, A., & Wade, W. G. (2010) · Journal of Bacteriology · doi:10.1128/jb.00542-10 · Cited by 3,352
Deblur Rapidly Resolves Single-Nucleotide Community Sequence Patterns
Amir, A., McDonald, D., Navas-Molina, J. A., Kopylova, E., Morton, J. T., Zech Xu, Z., Kightley, E. P., Thompson, L. R., Hyde, E. R., Gonzalez, A., et al. (2017) · mSystems · doi:10.1128/msystems.00191-16 · Cited by 1,881
Defining the healthy “core microbiome” of oral microbial communities
Zaura, E., Keijser, B. J., Huse, S. M., & Crielaard, W. (2009) · BMC Microbiology · doi:10.1186/1471-2180-9-259 · Cited by 1,323
The Microbiome Quality Control Project Consortium, Sinha, R., Abu-Ali, G., Vogtmann, E., Fodor, A. A., Ren, B., Amir, A., Schwager, E., Crabtree, J., Ma, S., et al. (2017) · Nature Biotechnology · doi:10.1038/nbt.3981 · Cited by 587
Cigarette smoking and the oral microbiome in a large study of American adults
Wu, J., Peters, B. A., Dominianni, C., Zhang, Y., Pei, Z., Yang, L., Ma, Y., Purdue, M. P., Jacobs, E. J., Gapstur, S. M., et al. (2016) · The ISME Journal · doi:10.1038/ismej.2016.37 · Cited by 572 · cited 1×
“Various studies have focused on individual factors that may cause shifts in the oral microbiome, such as ethnicity (1, 23), alcohol consumption (24), smoking (25), obesity (26, 27), and dietary patterns (28).”
BackgroundSEPP: SATé-Enabled Phylogenetic Placement
MIRARAB, S., NGUYEN, N., & WARNOW, T. (2011) · Biocomputing 2012 · doi:10.1142/9789814366496_0024 · Cited by 251
De Filippis, F., Vannini, L., La Storia, A., Laghi, L., Piombino, P., Stellato, G., Serrazanetti, D. I., Gozzi, G., Turroni, S., Ferrocino, I., et al. (2014) · PLoS ONE · doi:10.1371/journal.pone.0112373 · Cited by 146
Research works printed but not linked: 45
- 10.1038/nature11234 · DOI · Paper page
- 10.1016/j.phrs.2012.11.006 · DOI · Paper page
- 10.1177/0022034510379602 · DOI
- 10.3390/microorganisms7010020 · DOI
- 10.1177/154405910308200503 · DOI
- 10.1128/IAI.60.1.31-38.1992 · DOI
- 10.1111/j.1600-0757.2006.00187.x · DOI · Paper page
- 10.1038/s41467-019-10630-1 · DOI
- 10.1136/gutjnl-2016-312580 · DOI · Paper page
- 10.1136/gutjnl-2017-314814 · DOI · Paper page
- 10.1038/s41391-018-0041-1 · DOI
- 10.1093/dnares/dst037 · DOI
- 10.1101/gr.084616.108 · DOI
- 10.1038/srep22164 · DOI · Paper page
- 10.1186/s12866-014-0316-1 · DOI
- 10.3402/jom.v6.23609 · DOI
- 10.1016/j.annepidem.2019.03.006 · DOI
- 10.1158/1055-9965.EPI-18-0184 · DOI
- 10.1371/journal.pone.0077287 · DOI
- 10.1186/s40168-018-0448-x · DOI
- 10.7717/peerj.4458 · DOI
- 10.1080/20002297.2019.1650597 · DOI
- 10.1038/s41598-018-24207-3 · DOI
- 10.1128/AEM.02627-17 · DOI · Paper page
- 10.1038/s41587-020-0548-6 · DOI · Paper page
- 10.3389/fmicb.2019.00767 · DOI
- 10.1038/s41467-019-10656-5 · DOI · Paper page
- 10.1371/journal.pone.0200580 · DOI
- 10.3389/fmicb.2018.01136 · DOI
- 10.1111/j.1600-051X.2011.01784.x · DOI · Paper page
- 10.1093/ije/dyx124 · DOI
- 10.1128/mSystems.00127-16 · DOI
- 10.14806/ej.17.1.200 · DOI · Paper page
- 10.7717/peerj.2584 · DOI
- 10.1093/nar/gkn491 · DOI
- 10.1128/mSystems.00021-18 · DOI · Paper page
- 10.1186/s40168-018-0470-z · DOI
- 10.1093/nar/gkm864 · DOI
- 10.1007/978-0-387-98141-3 · DOI · Paper page
- Benjamini Y, Hochberg Y. 1995. Controlling the false discovery rate: a practical and powerful approach to multiple testing. J R Stat Soc Ser B 57:289–300. · DOI · Paper page
- 10.1111/j.1654-1103.2003.tb02228.x · DOI
- Martin BD Witten D Willis AD. 2019 Modeling microbial abundances and dysbiosis with beta-binomial regression. arXiv 1902.02776 [stat.ME]. https://arxiv.org/abs/1902.02776. · arXiv
- 10.1371/journal.pone.0061217 · DOI
- 10.18637/jss.v028.i05 · DOI · Paper page
- 10.1093/bioinformatics/btv153 · DOI
Cited by
Sorted by citations
Di Stefano, M., Polizzi, A., Santonocito, S., Romano, A., Lombardi, T., & Isola, G. (2022) · International Journal of Molecular Sciences · doi:10.3390/ijms23095142 · Cited by 292
Identifying biases and their potential solutions in human microbiome studies
Nearing, J. T., Comeau, A. M., & Langille, M. G. I. (2021) · Microbiome · doi:10.1186/s40168-021-01059-0 · Cited by 240
Self-citationSaliva microbiome alterations in dental fluorosis population
Liu, S., Song, Q., Zhang, C., Li, M., Li, Z., Liu, Y., Xu, L., Xie, X., Zhao, L., Zhang, R., et al. (2023) · Journal of Oral Microbiology · doi:10.1080/20002297.2023.2180927 · Cited by 24
Xia, Y., Peng, S., Yu, J., Wang, Y., Ye, Y., Liu, M., Shang, L., Cui, X., Wang, P., & Ding, Z. (2026) · Journal of Oral Microbiology · doi:10.1080/20002297.2026.2714622
Metadata
- Authors
- Nearing, J. T., DeClercq, V., Van Limbergen, J., & Langille, M. G. I.
- Affiliations
- Department of Microbiology and Immunology, Dalhousie University, Halifax, Nova Scotia, Canada
- Population Cancer Research Program, Dalhousie University, Halifax, Nova Scotia, Canada
- Division of Pediatric Gastroenterology & Nutrition, Emma Children’s Hospital, Amsterdam University Medical Centers, Amsterdam, The Netherlands
- ORCID
- Nearing, Jacob T.
- Venue
- mSphere
- Publisher
- American Society for Microbiology
- Published
- 2020-10-28
- Volume
- 5
- Issue
- 5
- ISSN
- 2379-5042
- PMC
- PMC7529435
- Cited by
- 117
- References
- 9
- Language
- en
- Funders
- Canadian Foundation of Innovation John R. Evans Leadership fund
- Nova Scotia Health Research Foundation
- Gouvernement du Canada | Natural Sciences and Engineering Research Council of Canada (2016-05039)
- Gouvernement du Canada | Canadian Institutes of Health Research
About these checks
Registry, retraction, Cites and statistics results are computed, not judged, with one exception: a printed reference that no index lists is read once by a model before it counts as a citation error. Claims are extracted by a model and kept only when their quote appears verbatim in the text; each cited source is then checked, with a model’s help, for whether it says what the claim relies on. Those verdicts can be wrong — read the claim’s quote and the cited source before relying on one.
Statistics and arithmetic are recomputed, not judged.
Confidence bands are shown only for fields calibrated on our annotated test set. None is calibrated yet, so no band is shown.
What counts as a claim ›How we measure confidence ›How we check this ›
Are you an author, or do you see a problem with this page? Request a review
