

The DOI matches its Crossref record; 74 of the 75 references it cites were found in a registry or an index.
A Prospective Metagenomic and Metabolomic Analysis of the Impact of Exercise and/or Whey Protein Supplementation on the Gut Microbiome of Sedentary Adults
Open accessAbstract
The gut microbiota of humans is a critical component of functional development and subsequent health. It is important to understand the lifestyle and dietary factors that affect the gut microbiome and what impact these factors may have. Animal studies suggest that exercise can directly affect the gut microbiota, and elite athletes demonstrate unique beneficial and diverse gut microbiome characteristics. These characteristics are associated with levels of protein consumption and levels of physical activity. The results of this study show that increasing the fitness levels of physically inactive humans leads to modest but detectable changes in gut microbiota characteristics. For the first time, we show that regular whey protein intake leads to significant alterations to the composition of the gut virome.
Overview
The claims and statistics of this paper haven’t been checked yet.
Run the check — free, no account needed. It reads the open-access text and checks the sources it cites.
Integrity signals
Registry
Cites
Statistics
Figures
Verification
Claims the paper makes
The claims and statistics of this paper haven’t been checked yet.
Run the check — free, no account needed. It reads the open-access text and checks the sources it cites.
Claims other papers make about this one
Each is checked against this paper’s own text: does it say what the citing paper says it does?
The cited source says what the claim attributes to it.
In the citing paper
“A combined aerobic and resistance training exercise regime led to modest alterations in the composition and activity of the gut microbiota of the sedentary individuals.”
From The Microbiota-Gut-Brain Axis (2019) · cites this paper as Cronin et al., 2018
In the citing paper
“Another study reported that combined eight-weeks aerobic and resistance exercise induced modest shifts in gut metagenomes despite no changes in the diversity of taxa or metabolic pathways (Cronin et al., 2018).”
From Six-Week Endurance Exercise Alters Gut Metagenome That Is not Reflected in Systemic Metabolism in Over-weight Women (2018) · cites this paper as Cronin et al., 2018
In the citing paper
“In contrast to our study, after eight-weeks of non-guided, combined aerobic and resistance exercise, Cronin et al. failed to detect significant changes in the gut microbiota composition or functions.”
From Six-Week Endurance Exercise Alters Gut Metagenome That Is not Reflected in Systemic Metabolism in Over-weight Women (2018) · cites this paper as Cronin et al., 2018
In the citing paper
“Nevertheless, a prolonged protein supplementation did not affect the gut microbiome (Cronin et al., 2018) and therefore the real effect of reduced protein intake can be questioned.”
From Six-Week Endurance Exercise Alters Gut Metagenome That Is not Reflected in Systemic Metabolism in Over-weight Women (2018) · cites this paper as Cronin et al., 2018
In the citing paper
“But interestingly, contradictory findings from the human exercise interventions have been recently presented (Allen et al., 2017; Cronin et al., 2018).”
From Six-Week Endurance Exercise Alters Gut Metagenome That Is not Reflected in Systemic Metabolism in Over-weight Women (2018) · cites this paper as Cronin et al., 2018
In the citing paper
“Nevertheless, a prolonged protein supplementation did not affect the gut microbiome (Cronin et al., 2018)”
From Six-Week Endurance Exercise Alters Gut Metagenome That Is not Reflected in Systemic Metabolism in Over-weight Women (2018) · cites this paper as Cronin et al., 2018
In the citing paper
“Interestingly, exercise was associated with reduced levels of phenylacetylglycine and trimethylamine N-oxide (TMAO) in urine.”
From Influence of the Gut Microbiome, Diet, and Environment on Risk of Colorectal Cancer (2020) · cites this paper as [114]
In the citing paper
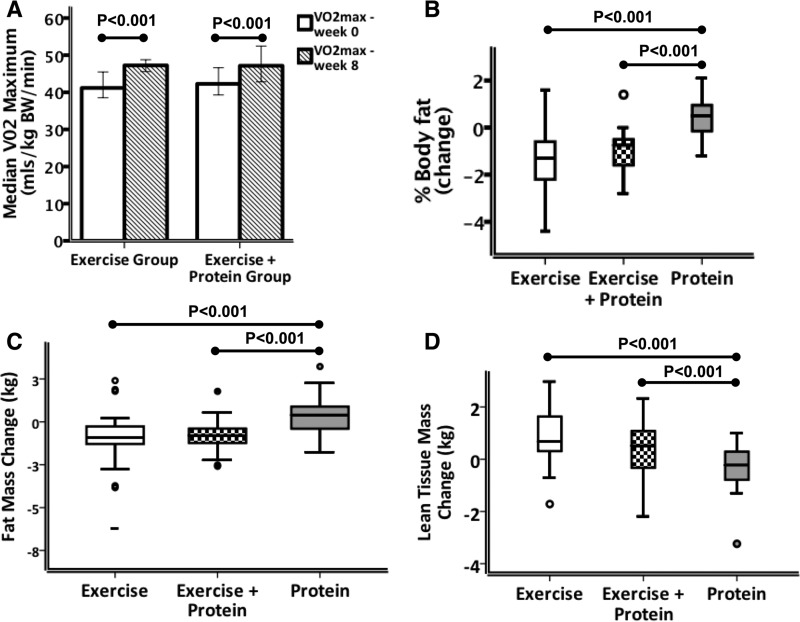
“In the second study, 8 weeks of mixed aerobic and resistance exercise training improved cardiorespiratory fitness and body composition, but did not produce significant changes in the fecal microbiome114 or metabolites.”
From Influence of the Gut Microbiome, Diet, and Environment on Risk of Colorectal Cancer (2020) · cites this paper as [114]
In the citing paper
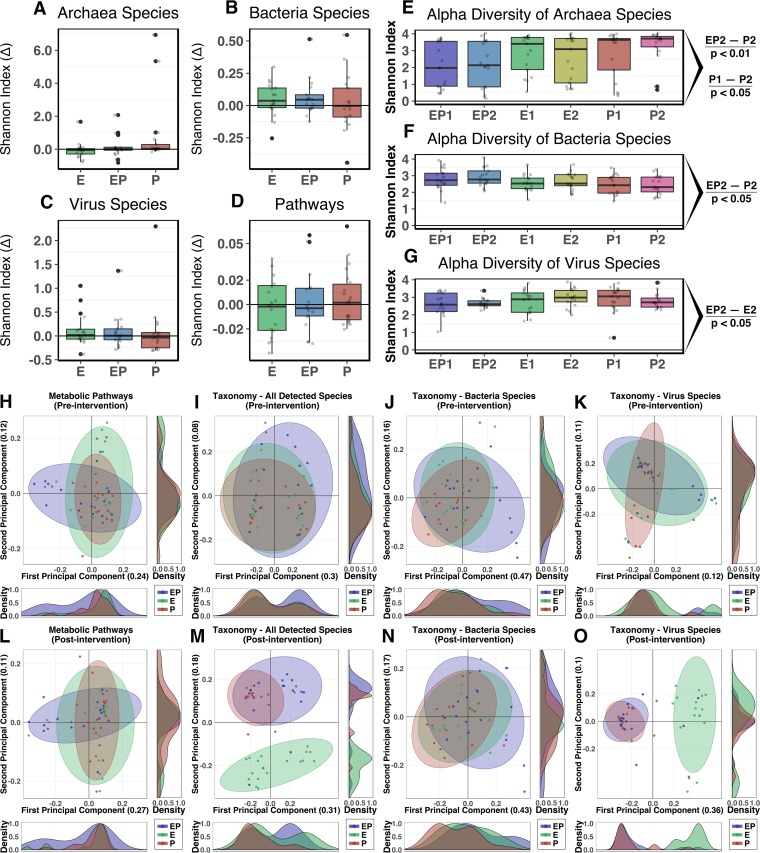
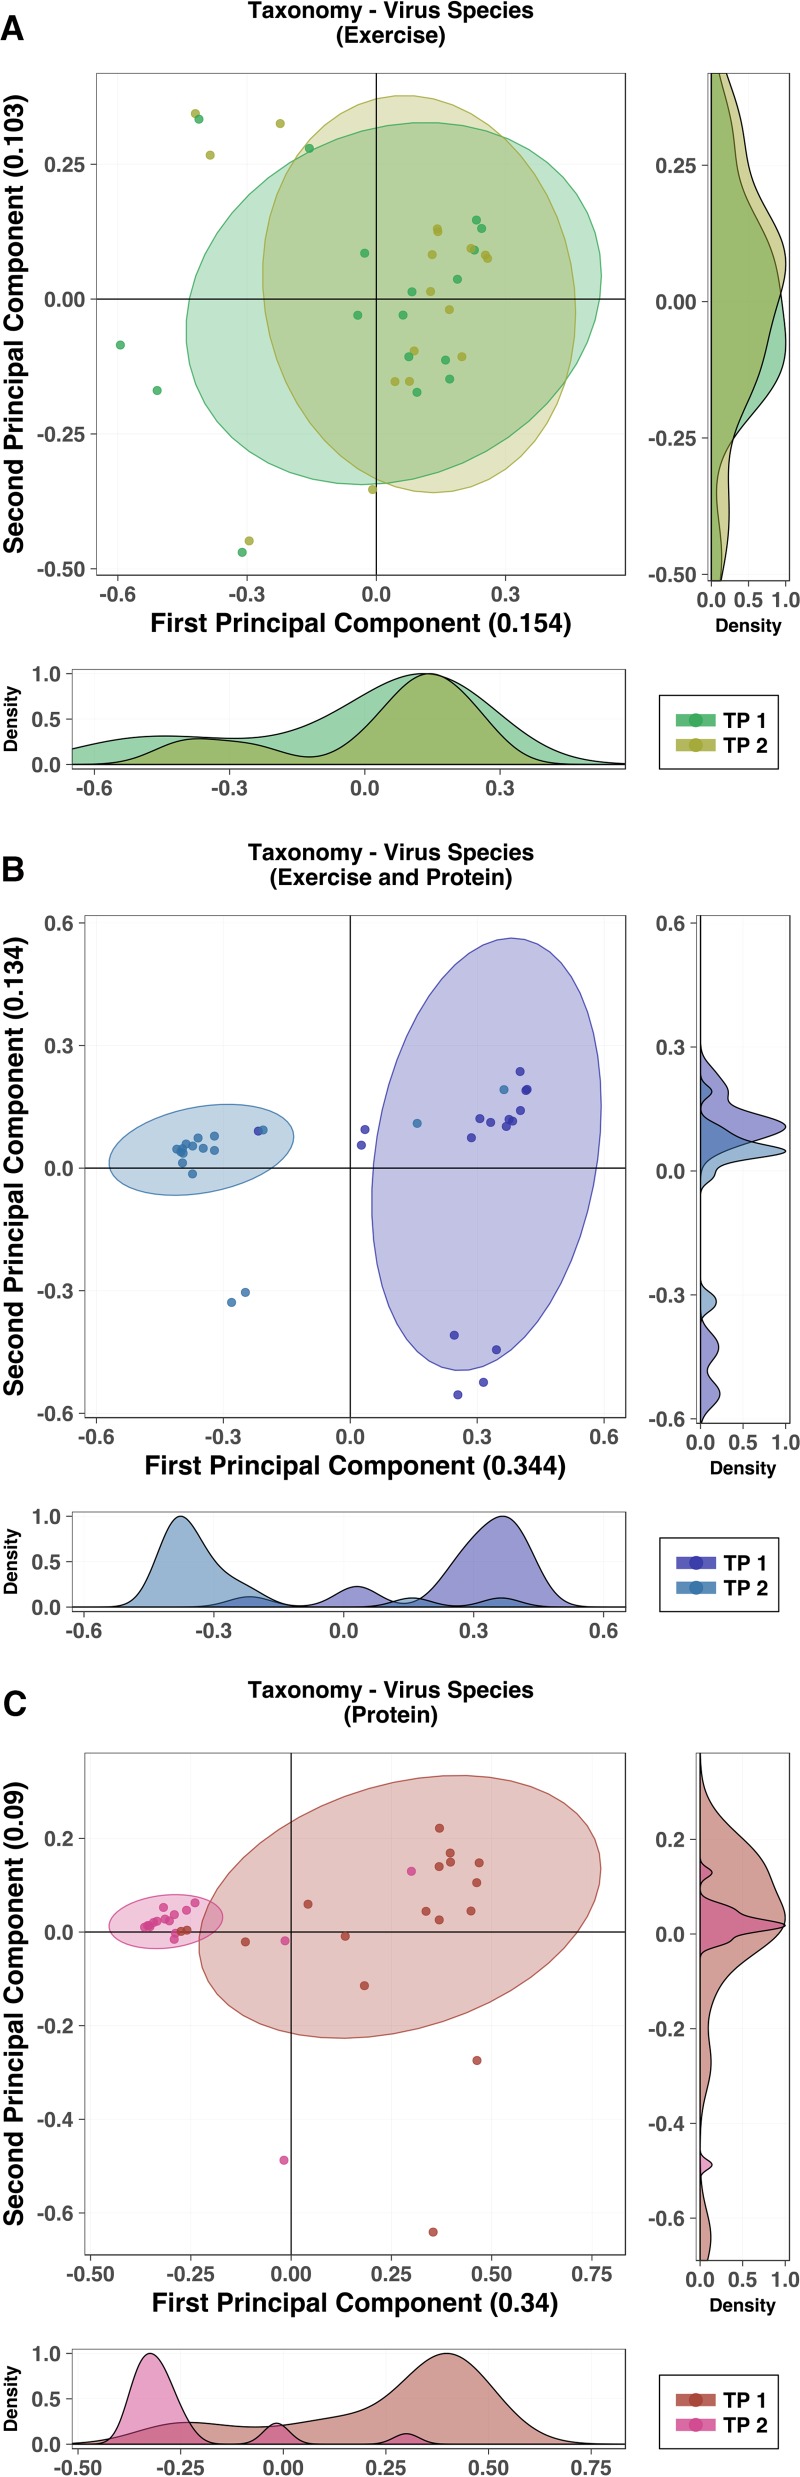
“Individuals in the whey protein supplementation-only group experienced a significant increase in the beta diversity of the gut virome.”
From The athletic gut microbiota (2020) · cites this paper as [199]
In the citing paper
“all bacteriophages (bacteria-targeting viruses) increased in the groups receiving whey protein were present in high relative abundance within the whey protein supplement.”
From The athletic gut microbiota (2020) · cites this paper as [199]
In the citing paper
“this change was mirrored in the combined exercise and protein supplementation group, suggesting a robust positive effect of whey protein on the taxonomic richness of the gut virome.”
From The athletic gut microbiota (2020) · cites this paper as [199]
Self-check
Percentages, sums and reported differences re-computed from the paper’s own numbers.
The self-check needs the paper’s full text.
Citations
Cites
Controlling the False Discovery Rate: A Practical and Powerful Approach to Multiple Testing
Benjamini, Y., & Hochberg, Y. (1995) · Journal of the Royal Statistical Society Series B: Statistical Methodology · doi:10.1111/j.2517-6161.1995.tb02031.x · Cited by 109,482
vegan: Community Ecology Package
Oksanen, J., Simpson, G. L., Blanchet, F. G., Kindt, R., Legendre, P., Minchin, P. R., O’Hara, R. B., Sólymos, P., Stevens, M. H. H., Szöcs, E., et al. (2001) · doi:10.32614/cran.package.vegan · Cited by 27,099
International physical activity questionnaire: 12-country reliability and validity
CRAIG, C. L., MARSHALL, A. L., SJ??STR??M, M., BAUMAN, A. E., BOOTH, M. L., AINSWORTH, B. E., PRATT, M., EKELUND, U., YNGVE, A., SALLIS, J. F., et al. (2003) · Medicine & Science in Sports & Exercise · doi:10.1249/01.mss.0000078924.61453.fb · Cited by 21,619
(2014) · Medical Entomology and Zoology · Cited by 9,400
The ade4 Package: Implementing the Duality Diagram for Ecologists
Dray, S., & Dufour, A. (2007) · Journal of Statistical Software · doi:10.18637/jss.v022.i04 · Cited by 6,740
2011 Compendium of Physical Activities: A Second Update of Codes and MET Values
AINSWORTH, B. E., HASKELL, W. L., HERRMANN, S. D., MECKES, N., BASSETT, D. R., TUDOR-LOCKE, C., GREER, J. L., VEZINA, J., WHITT-GLOVER, M. C., & LEON, A. S. (2011) · Medicine & Science in Sports & Exercise · doi:10.1249/mss.0b013e31821ece12 · Cited by 6,317
Gut flora metabolism of phosphatidylcholine promotes cardiovascular disease
Wang, Z., Klipfell, E., Bennett, B. J., Koeth, R., Levison, B. S., DuGar, B., Feldstein, A. E., Britt, E. B., Fu, X., Chung, Y.-M., et al. (2011) · Nature · doi:10.1038/nature09922 · Cited by 5,597
Kraken: ultrafast metagenomic sequence classification using exact alignments
Wood, D. E., & Salzberg, S. L. (2014) · Genome Biology · doi:10.1186/gb-2014-15-3-r46 · Cited by 4,521
Intestinal microbiota metabolism of l-carnitine, a nutrient in red meat, promotes atherosclerosis
Koeth, R. A., Wang, Z., Levison, B. S., Buffa, J. A., Org, E., Sheehy, B. T., Britt, E. B., Fu, X., Wu, Y., Li, L., et al. (2013) · Nature Medicine · doi:10.1038/nm.3145 · Cited by 4,386
Reproducibility and validity of a semiquantitative food frequency questionnaire
WILLETT, W. C., SAMPSON, L., STAMPFER, M. J., ROSNER, B., BAIN, C., WITSCHI, J., HENNEKENS, C. H., & SPEIZER, F. E. (1985) · American Journal of Epidemiology · doi:10.1093/oxfordjournals.aje.a114086 · Cited by 4,274
Cited by
Sorted by citations
Cryan, J. F., O'Riordan, K. J., Cowan, C. S. M., Sandhu, K. V., Bastiaanssen, T. F. S., Boehme, M., Codagnone, M. G., Cussotto, S., Fulling, C., Golubeva, A. V., et al. (2019) · Physiological Reviews · doi:10.1152/physrev.00018.2018 · Cited by 5,286
Influence of the Gut Microbiome, Diet, and Environment on Risk of Colorectal Cancer
Song, M., Chan, A. T., & Sun, J. (2020) · Gastroenterology · doi:10.1053/j.gastro.2019.06.048 · Cited by 752
Mailing, L. J., Allen, J. M., Buford, T. W., Fields, C. J., & Woods, J. A. (2019) · Exercise and Sport Sciences Reviews · doi:10.1249/jes.0000000000000183 · Cited by 521
Mohr, A. E., Jäger, R., Carpenter, K. C., Kerksick, C. M., Purpura, M., Townsend, J. R., West, N. P., Black, K., Gleeson, M., Pyne, D. B., et al. (2020) · Journal of the International Society of Sports Nutrition · doi:10.1186/s12970-020-00353-w · Cited by 378
“Cronin et al., 2018, Ireland [199] Sedentary overweight/obese males and females, n = 90, 18–40 years Randomized controlled trial, parallel group design Metagenomic whole genome shotgun Groups: • Protein-only; 30 g protein (24 g whey) • Exercise-only; Combined aerobic and resistance 8 weeks •…”
BackgroundInterplay Between Exercise and Gut Microbiome in the Context of Human Health and Performance
Clauss, M., Gérard, P., Mosca, A., & Leclerc, M. (2021) · Frontiers in Nutrition · doi:10.3389/fnut.2021.637010 · Cited by 308
Exercise influence on the microbiome–gut–brain axis
Dalton, A., Mermier, C. M., & Zuhl, M. (2019) · Gut Microbes · doi:10.1080/19490976.2018.1562268 · Cited by 273
Munukka, E., Ahtiainen, J. P., Puigbó, P., Jalkanen, S., Pahkala, K., Keskitalo, A., Kujala, U. M., Pietilä, S., Hollmén, M., Elo, L., et al. (2018) · Frontiers in Microbiology · doi:10.3389/fmicb.2018.02323 · Cited by 237
Martinez, J. E., Kahana, D. D., Ghuman, S., Wilson, H. P., Wilson, J. B., Kim, S. C. J., Lagishetty, V., Jacobs, J. P., Sinha‐Hikim, A. P., & Friedman, T. C. (2021) · Frontiers in Endocrinology · doi:10.3389/fendo.2021.667066 · Cited by 243
Roberts, M. D., McCarthy, J. J., Hornberger, T. A., Phillips, S. M., Mackey, A. L., Nader, G. A., Boppart, M. D., Kavazis, A. N., Reidy, P. T., Ogasawara, R., et al. (2023) · Physiological Reviews · doi:10.1152/physrev.00039.2022 · Cited by 214
Fecal microbiota transplantation in human metabolic diseases: From a murky past to a bright future?
Hanssen, N. M. J., de Vos, W. M., & Nieuwdorp, M. (2021) · Cell Metabolism · doi:10.1016/j.cmet.2021.05.005 · Cited by 202
Microbiota and Lifestyle: A Special Focus on Diet
Redondo-Useros, N., Nova, E., González-Zancada, N., Díaz, L. E., Gómez-Martínez, S., & Marcos, A. (2020) · Nutrients · doi:10.3390/nu12061776 · Cited by 189
Hughes, R., & Holscher, H. D. (2021) · Advances in Nutrition · doi:10.1093/advances/nmab077 · Cited by 212
Metabolomics and Multi-Omics Integration: A Survey of Computational Methods and Resources
Eicher, T., Kinnebrew, G. H., Patt, A. C., Spencer, K., Ying, K. L., Ma, Q., Machiraju, R., & Mathé, E. A. (2020) · Metabolites · doi:10.3390/metabo10050202 · Cited by 191
Carbajo‐Pescador, S., Porras, D., García‐Mediavilla, M. V., Martínez‐Flórez, S., Juárez‐Fernández, M., Cuevas, M. J., Mauriz, J. L., González‐Gallego, J., Nistal, E., & Sánchez‐Campos, S. (2019) · Disease Models & Mechanisms · doi:10.1242/dmm.039206 · Cited by 179
Strasser, B., Wolters, M., Weyh, C., Krüger, K., & Ticinesi, A. (2021) · Nutrients · doi:10.3390/nu13062045 · Cited by 192
Aya, V., Flórez, A., Perez, L., & Ramírez, J. D. (2021) · PLoS ONE · doi:10.1371/journal.pone.0247039 · Cited by 165
Varghese, S., Rao, S., Khattak, A., Zamir, F., & Chaari, A. (2024) · Nutrients · doi:10.3390/nu16213663 · Cited by 152
Exercise Induces Tissue-Specific Adaptations to Enhance Cardiometabolic Health
Ashcroft, S. P., Stocks, B., Egan, B., & Zierath, J. R. (2024) · Cell Metabolism · doi:10.1016/j.cmet.2023.12.008 · Cited by 149
Exercise immunology: Future directions
Nieman, D. C., & Pence, B. D. (2019) · Journal of sport and health science/Journal of Sport and Health Science · doi:10.1016/j.jshs.2019.12.003 · Cited by 154
Physical activity induced alterations of gut microbiota in humans: a systematic review
Dziewiecka, H., Buttar, H. S., Kasperska, A., Ostapiuk–Karolczuk, J., Domagalska, M., Cichoń-Woźniak, J., & Skarpańska-Stejnborn, A. (2022) · BMC Sports Science Medicine and Rehabilitation · doi:10.1186/s13102-022-00513-2 · Cited by 155
Influence of Exercise on the Human Gut Microbiota of Healthy Adults: A Systematic Review
Ortiz-Alvarez, L., Xu, H., & Martínez‐Téllez, B. (2020) · Clinical and Translational Gastroenterology · doi:10.14309/ctg.0000000000000126 · Cited by 154
Kern, T., Blond, M. B., Hansen, T. H., Rosenkilde, M., Quist, J. S., Gram, A. S., Ekstrøm, C. T., Hansen, T., & Stallknecht, B. (2020) · International Journal of Obesity · doi:10.1038/s41366-019-0440-y · Cited by 130
A Review of the Role of the Gut Microbiome in Personalized Sports Nutrition
Hughes, R. (2020) · Frontiers in Nutrition · doi:10.3389/fnut.2019.00191 · Cited by 143
Distinct microbiome composition and metabolome exists across subgroups of elite Irish athletes
O’Donovan, C. M., Madigan, S. M., Garcia-Perez, I., Rankin, A., O’ Sullivan, O., & Cotter, P. D. (2020) · Journal of Science and Medicine in Sport · doi:10.1016/j.jsams.2019.08.290 · Cited by 133
Self-citationToward an improved definition of a healthy microbiome for healthy aging
Ghosh, T. S., Shanahan, F., & O’Toole, P. W. (2022) · Nature Aging · doi:10.1038/s43587-022-00306-9 · Cited by 133
Self-citationMutual Interactions among Exercise, Sport Supplements and Microbiota
Zeppa, S. D., Agostini, D., Gervasi, M., Annibalini, G., Amatori, S., Ferrini, F., Sisti, D., Piccoli, G., Barbieri, E., Sestili, P., et al. (2019) · Nutrients · doi:10.3390/nu12010017 · Cited by 128
Intestinal Microbiota: A Novel Target to Improve Anti-Tumor Treatment?
Villéger, R., Lopès, A., Carrier, G., Véziant, J., Billard, E., Barnich, N., Gagnière, J., Vazeille, E., & Bonnet, M. (2019) · International Journal of Molecular Sciences · doi:10.3390/ijms20184584 · Cited by 125
Planetary Health: From the Wellspring of Holistic Medicine to Personal and Public Health Imperative
Prescott, S. L., & Logan, A. C. (2019) · EXPLORE · doi:10.1016/j.explore.2018.09.002 · Cited by 118
Metabolomics in Exercise and Sports: A Systematic Review
Khoramipour, K., Sandbakk, Ø. B., Keshteli, A. H., Gaeini, A. A., Wishart, D. S., & Chamari, K. (2021) · Sports Medicine · doi:10.1007/s40279-021-01582-y · Cited by 125
Impact of Different Exercise Modalities on the Human Gut Microbiome
Bycura, D. K., Santos, A. C., Shiffer, A., Kyman, S., Winfree, K. N., Sutliffe, J. T., Pearson, T., Sonderegger, D. L., Cope, E. K., & Caporaso, J. G. (2021) · Sports · doi:10.3390/sports9020014 · Cited by 111
Kulecka, M., Frączek, B., Mikuła, M., Żeber‐Lubecka, N., Karczmarski, J., Paziewska, A., Ambrożkiewicz, F., Jagusztyn-Krynicka, E. K., Cięszczyk, P., & Ostrowski, J. (2020) · Gut Microbes · doi:10.1080/19490976.2020.1758009 · Cited by 107
Roles of the gut microbiome in weight management
Carmody, R. N., & Bisanz, J. E. (2023) · Nature Reviews Microbiology · doi:10.1038/s41579-023-00888-0 · Cited by 113
Metabolome–Microbiome Crosstalk and Human Disease
Lee‐Sarwar, K. A., Lasky-Su, J. A., Kelly, R. S., Litonjua, A. A., & Weiss, S. T. (2020) · Metabolites · doi:10.3390/metabo10050181 · Cited by 98
Sales, K. M., & Reimer, R. A. (2022) · Journal of sport and health science/Journal of Sport and Health Science · doi:10.1016/j.jshs.2022.09.002 · Cited by 106
Interventions on Gut Microbiota for Healthy Aging
Zeppa, S. D., Agostini, D., Ferrini, F., Gervasi, M., Barbieri, E., Bartolacci, A., Piccoli, G., Saltarelli, R., Sestili, P., & Stocchi, V. (2022) · Cells · doi:10.3390/cells12010034 · Cited by 98
The Microbiota–Gut–Brain Axis and Neurological Disorders: A Comprehensive Review
Nakhal, M. M., Yassin, L. K., Alyaqoubi, R., Saeed, S., Alderei, A., Alhammadi, A., Alshehhi, M., Almehairbi, A., Houqani, S. A., BaniYas, S., et al. (2024) · Life · doi:10.3390/life14101234 · Cited by 136
Microbiome and health implications for ethnic minorities after enforced lifestyle changes
Keohane, D. M., Ghosh, T. S., Jeffery, I. B., Molloy, M. G., O’Toole, P. W., & Shanahan, F. (2020) · Nature Medicine · doi:10.1038/s41591-020-0963-8 · Cited by 89
Self-citationThe Potential Impact of Probiotics on the Gut Microbiome of Athletes
Wosinska, L., Cotter, P. D., O’Sullivan, Ó., & Guinane, C. M. (2019) · Nutrients · doi:10.3390/nu11102270 · Cited by 88
Self-citationImpact of Exercise on Gut Microbiota in Obesity
Aragón‐Vela, J., Solis‐Urra, P., Ruiz‐Ojeda, F. J., Álvarez‐Mercado, A. I., Arancibia, J. E. O., & Plaza‐Díaz, J. (2021) · Nutrients · doi:10.3390/nu13113999 · Cited by 91
Torquati, L., Gajanand, T., Cox, E. R., Willis, C. R. G., Zaugg, J., Keating, S. E., & Coombes, J. S. (2022) · European Journal of Sport Science · doi:10.1080/17461391.2022.2035436 · Cited by 84
Effects of exercise frequency on the gut microbiota in elderly individuals
Zhu, Q., Jiang, S., & Du, G. (2020) · MicrobiologyOpen · doi:10.1002/mbo3.1053 · Cited by 84
Cronin, O., Barton, W., Moran, C. P., Sheehan, D., Whiston, R., Nugent, H., McCarthy, Y., Molloy, C. B., O’Sullivan, Ó., Cotter, P. D., et al. (2019) · BMC Gastroenterology · doi:10.1186/s12876-019-0952-x · Cited by 82
Self-citationKiernan, M. G., Coffey, J. C., McDermott, K. W. G., Cotter, P. D., Cabrera‐Rubio, R., Kiely, P. A., & Dunne, C. P. (2018) · Journal of Crohn s and Colitis · doi:10.1093/ecco-jcc/jjy136 · Cited by 74
Self-citationBoytar, A. N., Skinner, T. L., Wallen, R. E., Jenkins, D. G., & Nitert, M. D. (2023) · Nutrients · doi:10.3390/nu15061534 · Cited by 75
Cullen, J. M. A., Shahzad, S., & Dhillon, J. (2023) · Frontiers in Physiology · doi:10.3389/fphys.2023.1292673 · Cited by 76
Effect of an 8-week Exercise Training on Gut Microbiota in Physically Inactive Older Women
Zhong, F., Xu, W., Yang, M., Lai, H., Momma, H., Cheng, L., Sun, X., Nagatomi, R., & Huang, C. X. (2020) · International Journal of Sports Medicine · doi:10.1055/a-1301-7011 · Cited by 71
Kentner, A. C., Cryan, J. F., & Brummelte, S. (2019) · Developmental Psychobiology · doi:10.1002/dev.21775 · Cited by 64
The human gut microbiome of athletes: metagenomic and metabolic insights
Fontana, F., Longhi, G., Tarracchini, C., Mancabelli, L., Lugli, G. A., Alessandri, G., Turroni, F., Milani, C., & Ventura, M. (2023) · Microbiome · doi:10.1186/s40168-023-01470-9 · Cited by 74
Dorelli, B., Gallé, F., Vito, C. D., Duranti, G., Iachini, M., Zaccarin, M., Standoli, J. P., Ceci, R., Romano, F., Liguori, G., et al. (2021) · Nutrients · doi:10.3390/nu13061890 · Cited by 65
Gut microbiota and physical activity: Is there an evidence-based link?
Pedersini, P., Turroni, S., & Villafañe, J. H. (2020) · The Science of The Total Environment · doi:10.1016/j.scitotenv.2020.138648 · Cited by 60
Rettedal, E. A., Cree, J. M. E., Adams, S. E., MacRae, C. L., Skidmore, P. M. L., Cameron‐Smith, D., Gant, N., Blenkiron, C., & Merry, T. L. (2020) · Experimental Physiology · doi:10.1113/ep088744 · Cited by 67
Verheggen, R. J. H. M., Konstanti, P., Smidt, H., Hermus, A. R., Thijssen, D. H. J., & Hopman, M. T. E. (2021) · Obesity · doi:10.1002/oby.23252 · Cited by 56
Physical activity, sedentary behavior and microbiome: A systematic review and meta-analysis
Pérez‐Prieto, I., Plaza‐Florido, A., Ubago‐Guisado, E., Ortega, F. B., & Altmäe, S. (2024) · Journal of science and medicine in sport · doi:10.1016/j.jsams.2024.07.003 · Cited by 63
Boscaini, S., Skuse, P., Nilaweera, K. N., Cryan, J. F., & Cotter, P. D. (2023) · Trends in Food Science & Technology · doi:10.1016/j.tifs.2022.12.009 · Cited by 59
Self-citationLiang, R., Zhang, S., Peng, X., Yang, W., Xu, Y., Wu, P., Chen, J., Cai, Y., & Zhou, J. (2019) · PLoS ONE · doi:10.1371/journal.pone.0226240 · Cited by 53
Wang, R., Cai, Y., Lu, W., Zhang, R., Shao, R., Yau, S., Stubbs, B., McIntyre, R. S., Su, K., Xu, G., et al. (2022) · Psychiatry Research · doi:10.1016/j.psychres.2022.115005 · Cited by 51
An exercise intervention alters stool microbiota and metabolites among older, sedentary adults
Erlandson, K. M., Liu, J., Johnson, R. L., Dillon, S. M., Jankowski, C. M., Kroehl, M., Robertson, C. E., Frank, D. N., Tunçil, Y. E., HIGGINS, J. A., et al. (2021) · Therapeutic Advances in Infectious Disease · doi:10.1177/20499361211027067 · Cited by 53
Cella, V., Bimonte, V. M., Sabato, C., Paoli, A., Baldari, C., Campanella, M., Lenzi, A., Ferretti, E., & Migliaccio, S. (2021) · Foods · doi:10.3390/foods10123075 · Cited by 49
Cheatham, C. L., Nieman, D. C., Neilson, A. P., & Lila, M. A. (2022) · Frontiers in Neuroscience · doi:10.3389/fnins.2022.833202 · Cited by 45
Resende, A. D. S., Leite, G. S., & Lancha, A. H. (2021) · Nutrients · doi:10.3390/nu13082839 · Cited by 44
Hartono, F. A., Martin-Arrowsmith, P. W., Peeters, W., & Churchward‐Venne, T. A. (2022) · Sports Medicine · doi:10.1007/s40279-021-01620-9 · Cited by 50
Attributes of Physical Activity and Gut Microbiome in Adults: A Systematic Review
Tzemah-Shahar, R., Koren, O., Greenfeld, S. M., Shochat, T., Magzal, F., & Agmon, M. (2020) · International Journal of Sports Medicine · doi:10.1055/a-1157-9257 · Cited by 43
Furber, M., Young, G. R., Holt, G. S., Pyle, S., Davison, G., Roberts, M. G., Roberts, J., Howatson, G., & Smith, D. (2022) · mSystems · doi:10.1128/msystems.00129-22 · Cited by 43
Barton, W., Cronin, O., García‐Pérez, I., Whiston, R., Holmes, E. C., Woods, T., Molloy, C. B., Molloy, M. G., Shanahan, F., Cotter, P. D., et al. (2020) · Translational Sports Medicine · doi:10.1002/tsm2.215 · Cited by 40
Self-citationToward a health-associated core keystone index for the human gut microbiome
Goel, A., Shete, O., Goswami, S., Samal, A., C.B., L., Kedia, S., Ahuja, V., O’Toole, P. W., Shanahan, F., & Ghosh, T. S. (2025) · Cell Reports · doi:10.1016/j.celrep.2025.115378 · Cited by 37
Self-citationGut microbiota and its roles in the pathogenesis and therapy of endocrine system diseases
Wu, Z., Tian, E., Chen, Y., Dong, Z., & Peng, Q. (2022) · Microbiological Research · doi:10.1016/j.micres.2022.127291 · Cited by 40
The contribution of the gut-liver axis to the immune signaling pathway of NAFLD
Liu, J., Wu, A., Cai, J., She, Z., & Li, H. (2022) · Frontiers in Immunology · doi:10.3389/fimmu.2022.968799 · Cited by 42
Metabolic networks of the human gut microbiota
Selber‐Hnatiw, S., Sultana, T., Tse, W., Abdollahi, N., Abdullah, S., Rahbani, J. A., Alazar, D., Alrumhein, N. J., Aprikian, S., Arshad, R., et al. (2019) · Microbiology · doi:10.1099/mic.0.000853 · Cited by 38
Clark, J. S., Simpson, B. S., & Murphy, K. J. (2021) · British Journal Of Nutrition · doi:10.1017/s0007114521003251 · Cited by 34
Zeppa, S. D., Amatori, S., Sisti, D., Gervasi, M., Agostini, D., Piccoli, G., Pazienza, V., Gobbi, P., Rocchi, M., Sestili, P., et al. (2021) · Journal of the International Society of Sports Nutrition · doi:10.1186/s12970-021-00471-z · Cited by 35
Morella, I., Negro, M., Dossena, M., Brambilla, R., & D’Antona, G. (2023) · Neuropharmacology · doi:10.1016/j.neuropharm.2023.109718 · Cited by 36
Mohr, A. E., Mach, N., Pugh, J. N., Grosicki, G. J., Allen, J. M., Karl, J. P., & Whisner, C. M. (2025) · FEMS Microbiology Reviews · doi:10.1093/femsre/fuaf037 · Cited by 37
Gerdes, V. E. A., Gueimonde, M., Pajunen, L., Nieuwdorp, M., & Laitinen, K. (2020) · Atherosclerosis · doi:10.1016/j.atherosclerosis.2020.08.028 · Cited by 34
Craven, J., Cox, A. J., Bellinger, P., Desbrow, B., Irwin, C. G., Buchan, J., McCartney, D., & Sabapathy, S. (2021) · European Journal of Sport Science · doi:10.1080/17461391.2021.1933199 · Cited by 33
Soares, N. L., Dorand, V. A. M., Cavalcante, H. C., Batista, K. S., de Souza, D. M., Lima, M. D. S., Salvadori, M. G. D. S. S., Magnani, M., Alves, A. F., & Aquino, J. D. S. (2021) · Journal of Affective Disorders · doi:10.1016/j.jad.2021.06.028 · Cited by 34
Type, Intensity, and Duration of Exercise as Regulator of Gut Microbiome Profile
Suryani, D., Alfaqih, M. S., Gunadi, J. W., Sylviana, N., Goenawan, H., Megantara, I., & Lesmana, R. (2022) · Current Sports Medicine Reports · doi:10.1249/jsr.0000000000000940 · Cited by 34
Brooks, C. N., Wight, M. E., Azeez, O. E., Bleich, R. M., & Zwetsloot, K. A. (2023) · Frontiers in Sports and Active Living · doi:10.3389/fspor.2023.1168731 · Cited by 35
Alterations in intestinal microbiota in ultramarathon runners
Sato, M., & Suzuki, Y. (2022) · Scientific Reports · doi:10.1038/s41598-022-10791-y · Cited by 30
Muscle aging amelioration by yeast protein supplementation was associated with gut microbiota
Liao, Y., Zhou, X., Peng, Z., Li, D., Meng, Z., Xu, S., Yang, X., Liu, L., & Yang, W. Q. (2022) · Journal of Functional Foods · doi:10.1016/j.jff.2022.104948 · Cited by 30
Research advances in the application of metabolomics in exercise science
Qi, S., Li, X., Yu, J., & Yin, L. (2024) · Frontiers in Physiology · doi:10.3389/fphys.2023.1332104 · Cited by 30
Exercise and physical activity in cirrhosis: opportunities or perils
Bellar, A., Welch, N., & Dasarathy, S. (2020) · Journal of Applied Physiology · doi:10.1152/japplphysiol.00798.2019 · Cited by 33
Gut Microbiota, Microbial Metabolites and Human Physical Performance
Lensu, S., & Pekkala, S. (2021) · Metabolites · doi:10.3390/metabo11110716 · Cited by 32
Potential Prebiotic Properties of Whey Protein and Glycomacropeptide in Gut Microbiome
Rackerby, B., Le, H. N. M., Haymowicz, A., Dallas, D. C., & Park, S. H. (2024) · Food Science of Animal Resources · doi:10.5851/kosfa.2024.e12 · Cited by 30
Zhong, F., Xu, Y., Lai, H.-Y., Yang, M., Cheng, L., Liu, X., Sun, X., Yang, Y., Wang, J., Lv, W., et al. (2022) · Frontiers in Physiology · doi:10.3389/fphys.2022.1004863 · Cited by 26
Cullen, J. M. A., Shahzad, S., Kanaley, J. A., Ericsson, A. C., & Dhillon, J. (2023) · Journal of Applied Physiology · doi:10.1152/japplphysiol.00350.2023 · Cited by 33
Ghaffar, T., Ubaldi, F., Volpini, V., Valeriani, F., & Spica, V. R. (2024) · Sports · doi:10.3390/sports12080221 · Cited by 31
Boscaini, S., Cabrera‐Rubio, R., Speakman, J. R., Cotter, P. D., Cryan, J. F., & Nilaweera, K. N. (2019) · British Journal Of Nutrition · doi:10.1017/s0007114519000461 · Cited by 27
Self-citationWei, S., Brejnrod, A., Trivedi, U., Mortensen, M. S., Johansen, M. Y., Karstoft, K., Vaag, A. A., Ried‐Larsen, M., & Sørensen, S. J. (2021) · Gut Microbes · doi:10.1080/19490976.2021.2005407 · Cited by 27
Gut check: Unveiling the influence of acute exercise on the gut microbiota
Grosicki, G. J., Langan, S. P., Bagley, J. R., Galpin, A. J., Garner, D., Hampton‐Marcell, J., Allen, J. M., & Robinson, A. T. (2023) · Experimental Physiology · doi:10.1113/ep091446 · Cited by 27
Prevotella copri—a potential next‐generation probiotic
Zang, X., Xiao, M., Yu, L., Chen, Y., Duan, H., Zhang, C., Zhao, J., Narbad, A., Chen, W., Tian, F., et al. (2024) · Food Frontiers · doi:10.1002/fft2.417 · Cited by 28
The role of exercise in rehabilitation of discharged COVID-19 patients
Bo, W., Xi, Y., & Tian, Z. (2021) · Sports Medicine and Health Science · doi:10.1016/j.smhs.2021.09.001 · Cited by 28
Bagheri, R., Kargarfard, M., Sadeghi, R., Scott, D. S., & CAMERA, D. M. (2023) · Journal of the International Society of Sports Nutrition · doi:10.1080/15502783.2023.2236053 · Cited by 35
Gong, T., He, X., Gao, S., & Wu, Q. (2021) · Journal of Cancer · doi:10.7150/jca.46621 · Cited by 23
Akazawa, N., Nakamura, M., Eda, N., Murakami, H., Nakagata, T., Nanri, H., Park, J., Hosomi, K., Mizuguchi, K., Kunisawa, J., et al. (2023) · Frontiers in Sports and Active Living · doi:10.3389/fspor.2023.1219345 · Cited by 24
Humińska‐Lisowska, K., Zielińska, K., Mieszkowski, J., Michałowska‐Sawczyn, M., Cięszczyk, P., Łabaj, P. P., Wasąg, B., Frączek, B., Grzywacz, A., Kochanowicz, A., et al. (2024) · PLoS ONE · doi:10.1371/journal.pone.0297858 · Cited by 23
The effect of exercise on depression and gut microbiota: Possible mechanisms
Yao, M., Qu, Y., Zheng, Y., & Guo, H. (2024) · Brain Research Bulletin · doi:10.1016/j.brainresbull.2024.111130 · Cited by 26
Progress and prospects of the healthy human gut virome
Stockdale, S. R., & Hill, C. (2021) · Current Opinion in Virology · doi:10.1016/j.coviro.2021.10.001 · Cited by 21
Characterization of goat whey proteins and their bioactivity and toxicity assay
Campos, M. I. F., Barbosa, P. P. D. S., de Camargo, L. J., Pinto, L. D. S., Mataribu, B., Serrão, C., Marques‐Santos, L. F., Lopes, J. H., de Oliveira, J. M. C., Gadelha, C. A. D. A., et al. (2022) · Food Bioscience · doi:10.1016/j.fbio.2022.101591 · Cited by 20
Patel, D., Evanchuk, J. L., Wang, R., Dunbar, C. L., Munhoz, J., & Field, C. J. (2023) · Applied Physiology, Nutrition, and Metabolism · doi:10.1139/apnm-2022-0456 · Cited by 20
Grosicki, G. J., Pugh, J. N., Wosinska, L., Quilter, K., Mattimoe, D., Allen, J. M., Joyce, S. A., O’Sullivan, Ó., & Close, G. L. (2023) · Journal of Applied Physiology · doi:10.1152/japplphysiol.00024.2023 · Cited by 20
Metadata
- Authors
- Cronin, O., Barton, W., Skuse, P., Penney, N. C., Garcia-Perez, I., Murphy, E. F., Woods, T., Nugent, H., Fanning, A., Melgar, S., Falvey, E. C., Holmes, E., Cotter, P. D., O’Sullivan, O., Molloy, M. G., & Shanahan, F.
- Affiliations
- National University of Ireland (IE)
- Teagasc - The Irish Agriculture and Food Development Authority (IE)
- Imperial College London (GB)
- Section of Biomolecular Medicine, Division of Computational Systems Medicine, Department of Surgery and Cancer, Imperial College London, London, United Kingdom
- Alimentary Health (Ireland) (IE)
- Department of Medicine, National University of Ireland, Cork, Ireland
- APC Microbiome Ireland, National University of Ireland, Cork, Ireland
- Corresponding author
- Cronin, Owen
- ORCID
- Venue
- mSystems
- Publisher
- American Society for Microbiology
- Published
- 2018-06-26
- Volume
- 3
- Issue
- 3
- ISSN
- 2379-5077 (ISSN-L)
- PMC
- PMC5915698
- OpenAlex
- W2802946611
- Cited by
- 232
- References
- 75
- Citations by year
- 2026: 24 · 2025: 24 · 2024: 36 · 2023: 33 · 2022: 35 · 2021: 31 · 2020: 23 · 2019: 22 · 2018: 4
- FWCI
- 7.12
- Type
- journal article
- Language
- en
- Open access
- gold
- doi.org
- Licence
- Locations
- mSystems (publishedVersion, cc-by)
- Europe PMC (PubMed Central) (publishedVersion, cc-by)
- PubMed Central (publishedVersion, cc-by)
- PubMed (publishedVersion)
- Cork Open Research Archive (University College Cork, Ireland) (submittedVersion, cc-by)
- DOAJ (DOAJ: Directory of Open Access Journals) (submittedVersion, cc-by-sa)
- DOAJ (DOAJ: Directory of Open Access Journals) (submittedVersion)
- Spiral (Imperial College London) (submittedVersion, other-oa)
- T-Stór (Teagasc) (submittedVersion, cc-by-nc-sa)
- Funders
- Irish Centre for Arthritis Research and Education (N/A)
- Science Foundation Ireland (SFI/12/RC/2273, SFI/11/PI/1137, SFI/13/SIRG/2160)
- Diabetes Research & Wellness Foundation (Sutherland-Earl Clinical Research Fellowship 2015)
- Topics
- Life Sciences › Biochemistry, Genetics and Molecular Biology › Molecular Biology › Gut microbiota and health
- Life Sciences › Agricultural and Biological Sciences › Food Science › Probiotics and Fermented Foods
- Health Sciences › Medicine › Gastroenterology › Gastrointestinal motility and disorders
- Keywords
- gut microbiota, physical activity, whey protein supplementation, gut virome, sedentary adults, physical inactivity, microbiota composition, metabolomics
About these checks
Registry, retraction, Cites and statistics results are computed, not judged, with one exception: a printed reference that no index lists is read once by a model before it counts as a citation error. Claims are extracted by a model and kept only when their quote appears verbatim in the text; each cited source is then checked, with a model’s help, for whether it says what the claim relies on. Those verdicts can be wrong — read the claim’s quote and the cited source before relying on one.
Statistics and arithmetic are recomputed, not judged.
Confidence bands are shown only for fields calibrated on our annotated test set. None is calibrated yet, so no band is shown.
What counts as a claim ›How we measure confidence ›How we check this ›
Are you an author, or do you see a problem with this page? Request a review
