Cited by 19Gut microbiota and healthGastrointestinal motility and disordersMicrobial Metabolites in Food Biotechnology

The DOI matches its Crossref record; 7 of the 7 references it cites were found in a registry or an index.

In vitro microbiota model recapitulates and predicts individualised sensitivity to dietary emulsifier

Open access
Rytter, Héloïse, Naimi, Sabrine, Wu, Gary, Lewis, Jim, Duquesnoy, Maeva, Vigué, Lucile, Tenaillon, Olivier, Belda, Eugeni, Vazquez-Gomez, Marta, Touly, Nina, Arnone, Djésia, Hao, Fuhua, Ley, Ruth E, Clément, Karine, Peyrin-Biroulet, Laurent, Patterson, Andrew D, Gewirtz, Andrew T, Chassaing, Benoit·2025·Gut

Abstract

Background: Non-absorbed dietary emulsifiers, including carboxymethylcellulose (CMC), directly disturb intestinal microbiota, thereby promoting chronic intestinal inflammation in mice. A randomised controlled-feeding study (Functional Research on Emulsifiers in Humans, FRESH) found that CMC also detrimentally impacts intestinal microbiota in some, but not all, healthy individuals. Objectives: This study aimed to establish an approach for predicting an individual’s sensitivity to dietary emulsifiers via their baseline microbiota. Design: We evaluated the ability of an in vitro microbiota model (MiniBioReactor Arrray, MBRA) to reproduce and predict an individual donor’s sensitivity to emulsifiers. Metagenomes were analysed to identify signatures of emulsifier sensitivity. Results: Exposure of human microbiotas, maintained in the MBRA, to CMC recapitulated the differential CMC sensitivity previously observed in FRESH subjects. Furthermore, select FRESH control subjects (ie, not fed CMC) had microbiotas that were highly perturbed by CMC exposure in the MBRA model. CMC-induced microbiota perturbability was associated with a baseline metagenomic signature, suggesting the possibility of using one’s metagenome to predict sensitivity to dietary emulsifiers. Transplant of human microbiotas that the MBRA model deemed CMC-sensitive, but not those deemed insensitive, into IL-10 −/− germfree mice resulted in overt colitis following CMC feeding. Conclusion: These results suggest that an individual’s sensitivity to emulsifier is a consequence of, and can thus be predicted by, examining their baseline microbiota, paving the way to microbiota-based personalised nutrition.

Overview

The claims and statistics of this paper haven’t been checked yet.

Run the check — free, no account needed. It reads the open-access text and checks the sources it cites.

A few free checks a day · papers already verified open instantly · results are public

Integrity signals

Registry

Crossref · 10.1136/gutjnl-2024-333925

Cites

7 of 7 references verified0 citation errors · 0 not checkable

Statistics

Figures

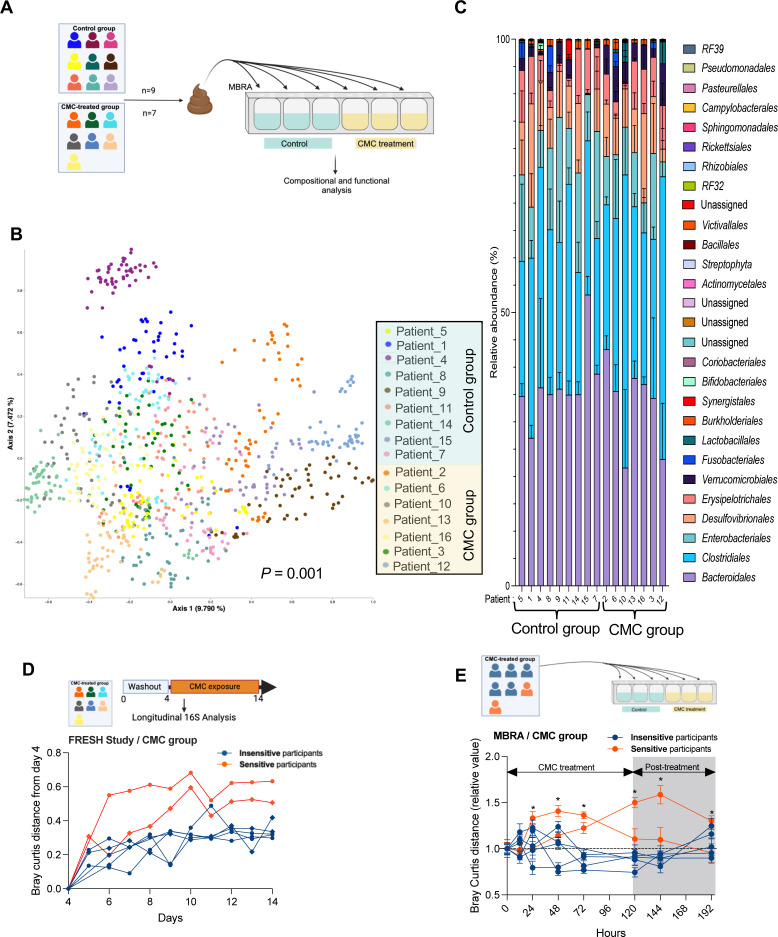
Figure 1 MBRA-based microbiota modelling accurately replicates interindividual variations in microbiota composition and captures the CMC-induced microbiota perturbations. (A) Schematic outline of the experimental plan used. Faecal samples from the 16 FRESH subjects (9 participants from the control group and 7 participants from the CMC-exposed groups) were used to inoculate triplicates MBRA chambers. Microbiota were then allowed to equilibrate for 24 hours prior flow initiation. After a 3-day microbiota stabilisation phase, chambers were treated from 0 hour to 120 hours, in triplicates for each donor, with BRM medium containing CMC at 0.1% or control sterile BRM medium. At the 120 hours time point, post-treatment phase was initiated, with CMC treatment discontinued by connecting all chambers to emulsifier-free BRM sterile medium. Samples were collected longitudinally. (B) Microbiota composition was analysed by 16S rRNA gene sequencing and principal coordinates analysis (PCoA) of the Jaccard matrix combining MBRA samples at all time points was plotted, with dots coloured by patient. (C) Taxonomic analyses were computed through QIIME2 pipeline at the order level. Data are the means±SEM, with individual data points being represented (N=3). Significance was determined using Permanova analysis. (D) Longitudinal analysis of the Bray-Curtis distance in faecal sample from CMC arm of the FRESH study. Data were normalised based on day 4 distance. (E) Longitudinal analysis of the Bray-Curtis distance in MBRA samples generated with CMC participants of the FRESH study. Data were normalised with the untreated condition and time point 0 hour (poststabilisation), both defined as 1. Grey area indicates the post-treatment phase. p<0.05 determined by a two-way ANOVA corrected for multiple comparisons or mixed-effect analysis. (D) Data from Chassaing et al.17 ANOVA, analysis of variance; BRM, Bioreactor Medium; CMC, carboxymethylcellulose; FRESH, Functional Research on Emulsifiers in Humans; MBRA, MiniBioReactor Arrray.
Figure 1 MBRA-based microbiota modelling accurately replicates interindividual variations in microbiota composition and captures the CMC-induced microbiota perturbations. (A) Schematic outline of the experimental plan used. Faecal samples from the 16 FRESH subjects (9 participants from the control group and 7 participants from the CMC-exposed groups) were used to inoculate triplicates MBRA chambers. Microbiota were then allowed to equilibrate for 24 hours prior flow initiation. After a 3-day microbiota stabilisation phase, chambers were treated from 0 hour to 120 hours, in triplicates for each donor, with BRM medium containing CMC at 0.1% or control sterile BRM medium. At the 120 hours time point, post-treatment phase was initiated, with CMC treatment discontinued by connecting all chambers to emulsifier-free BRM sterile medium. Samples were collected longitudinally. (B) Microbiota composition was analysed by 16S rRNA gene sequencing and principal coordinates analysis (PCoA) of the Jaccard matrix combining MBRA samples at all time points was plotted, with dots coloured by patient. (C) Taxonomic analyses were computed through QIIME2 pipeline at the order level. Data are the means±SEM, with individual data points being represented (N=3). Significance was determined using Permanova analysis. (D) Longitudinal analysis of the Bray-Curtis distance in faecal sample from CMC arm of the FRESH study. Data were normalised based on day 4 distance. (E) Longitudinal analysis of the Bray-Curtis distance in MBRA samples generated with CMC participants of the FRESH study. Data were normalised with the untreated condition and time point 0 hour (poststabilisation), both defined as 1. Grey area indicates the post-treatment phase. p<0.05 determined by a two-way ANOVA corrected for multiple comparisons or mixed-effect analysis. (D) Data from Chassaing et al.17 ANOVA, analysis of variance; BRM, Bioreactor Medium; CMC, carboxymethylcellulose; FRESH, Functional Research on Emulsifiers in Humans; MBRA, MiniBioReactor Arrray.CC BY-NC · PubMed Central
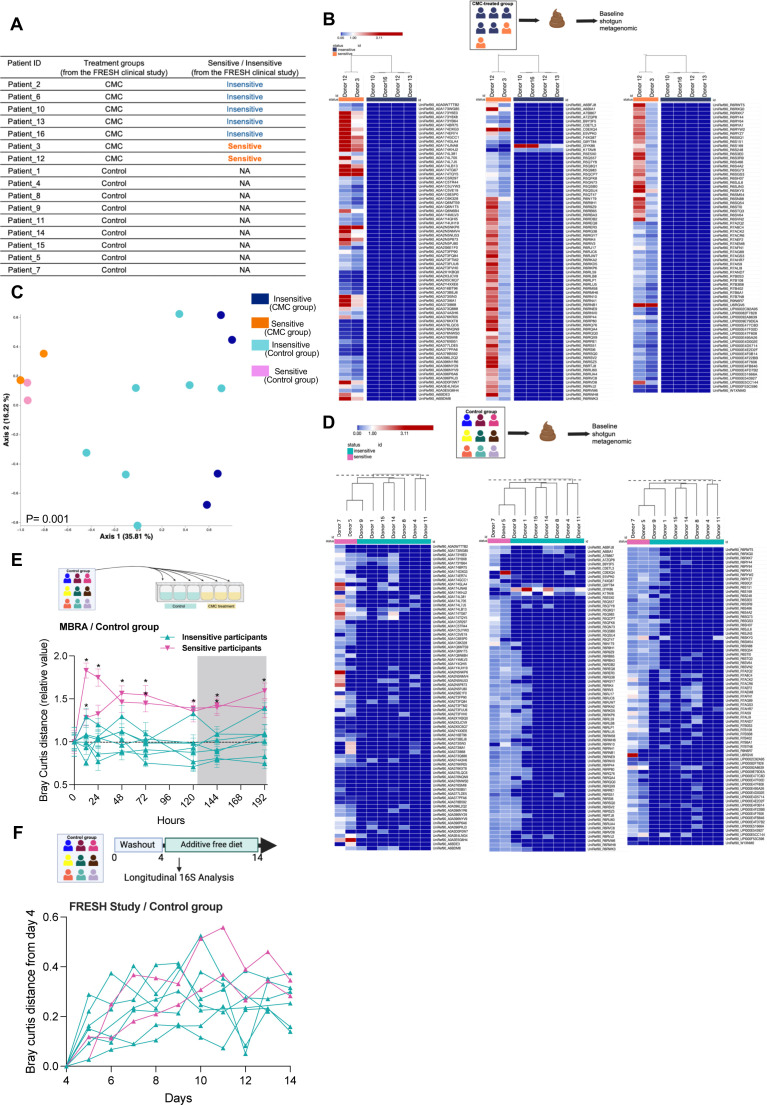
Figure 2 Metagenomic markers exhibited a positive correlation with sensitivity status, facilitating the identification of new CMC-sensitive microbiotas through MBRA. (A) List of the FRESH participants used in the current study and their respective CMC-sensitivity status, identified in clinics. (B) Heatmap visualisation of the MaAsLin2-identified emulsifier sensitivity marker’s abundance in sensitive and insensitive FRESH participants from CMC arm. (C) Heatmap visualisation of the MaAsLin2-identified emulsifier sensitivity marker’s abundance in FRESH participants from control arm. (D) Longitudinal analysis of the Bray-Curtis distance in faecal sample from control arm of the FRESH study. Data were normalised based on day 4 distance. (E) Longitudinal analysis of the Bray-Curtis distance in MBRA samples generated with control participants of the FRESH study. Data were normalised with the untreated condition and time point 0 hour (poststabilisation), both defined as 1. Grey area indicates the post-treatment phase. p<0.05 determined by a two-way ANOVA corrected for multiple comparisons or mixed-effect analysis. (D) Data from Chassaing et al.17 ANOVA, analysis of variance; CMC, carboxymethylcellulose; FRESH, Functional Research on Emulsifiers in Humans; MBRA, MiniBioReactor Arrray.
Figure 2 Metagenomic markers exhibited a positive correlation with sensitivity status, facilitating the identification of new CMC-sensitive microbiotas through MBRA. (A) List of the FRESH participants used in the current study and their respective CMC-sensitivity status, identified in clinics. (B) Heatmap visualisation of the MaAsLin2-identified emulsifier sensitivity marker’s abundance in sensitive and insensitive FRESH participants from CMC arm. (C) Heatmap visualisation of the MaAsLin2-identified emulsifier sensitivity marker’s abundance in FRESH participants from control arm. (D) Longitudinal analysis of the Bray-Curtis distance in faecal sample from control arm of the FRESH study. Data were normalised based on day 4 distance. (E) Longitudinal analysis of the Bray-Curtis distance in MBRA samples generated with control participants of the FRESH study. Data were normalised with the untreated condition and time point 0 hour (poststabilisation), both defined as 1. Grey area indicates the post-treatment phase. p<0.05 determined by a two-way ANOVA corrected for multiple comparisons or mixed-effect analysis. (D) Data from Chassaing et al.17 ANOVA, analysis of variance; CMC, carboxymethylcellulose; FRESH, Functional Research on Emulsifiers in Humans; MBRA, MiniBioReactor Arrray.CC BY-NC · PubMed Central
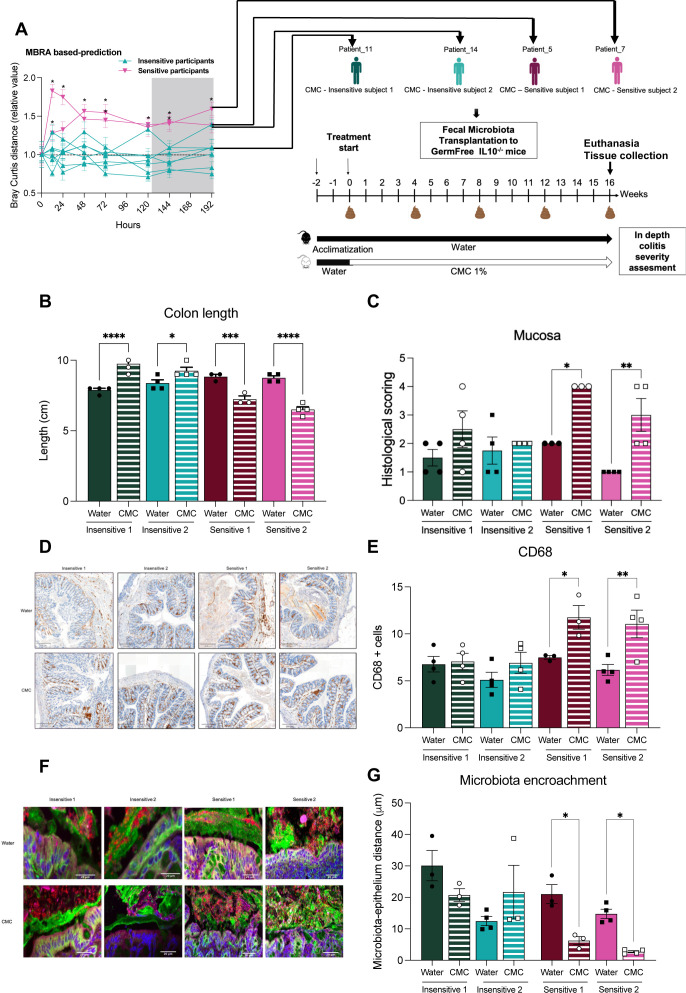
Figure 3 Microbiotas from FRESH participants predicted to be CMC-sensitive conferred severe CMC-induced colitis in germfree IL10−/− recipient mice. (A) Germfree Il-10−/− mice were transplanted with faecal suspension from either CMC-predicted insensitive or CMC-predicted sensitive FRESH participants. Two weeks post microbiota stabilisation, mice were treated with either water or CMC (1% w/v) for 16 weeks. (B) Colon length, (C) histopathological scoring of the colonic mucosa, (D) representative images of colonic sections immune-stained with anti-CD68 antibody, and (E) quantification of colonic CD68+cells. (F, G) Proximal colons were fixed in Carnoy solution and subjected to immunostaining paired with fluorescent in situ hybridisation (FISH), followed by confocal microscopy analysis to determine microbiota localisation. MUC2, green; actin, purple; bacteria, red and DNA, blue. (F) Representative confocal images of microbiota encroachment. (G) Averaged distances separating the microbiota from the intestinal epithelium. Data are represented as the means±SEM. Statistical analyses were performed using a one-way ANOVA or a two-way repeated measures ANOVA or a mixed-effects model (if missing values; assuming sphericity and no correction). ANOVA was followed by a Sidak post hoc test between CMC-treated group and water-treated group for each of the microbiota used for transplantation. Significant differences were recorded as follows: *p<0.05, **p<0.01, ***p<0.001, ****p<0.0001. n=3–4. ANOVA, analysis of variance; CMC, carboxymethylcellulose; FRESH, Functional Research on Emulsifiers in Humans.
Figure 3 Microbiotas from FRESH participants predicted to be CMC-sensitive conferred severe CMC-induced colitis in germfree IL10−/− recipient mice. (A) Germfree Il-10−/− mice were transplanted with faecal suspension from either CMC-predicted insensitive or CMC-predicted sensitive FRESH participants. Two weeks post microbiota stabilisation, mice were treated with either water or CMC (1% w/v) for 16 weeks. (B) Colon length, (C) histopathological scoring of the colonic mucosa, (D) representative images of colonic sections immune-stained with anti-CD68 antibody, and (E) quantification of colonic CD68+cells. (F, G) Proximal colons were fixed in Carnoy solution and subjected to immunostaining paired with fluorescent in situ hybridisation (FISH), followed by confocal microscopy analysis to determine microbiota localisation. MUC2, green; actin, purple; bacteria, red and DNA, blue. (F) Representative confocal images of microbiota encroachment. (G) Averaged distances separating the microbiota from the intestinal epithelium. Data are represented as the means±SEM. Statistical analyses were performed using a one-way ANOVA or a two-way repeated measures ANOVA or a mixed-effects model (if missing values; assuming sphericity and no correction). ANOVA was followed by a Sidak post hoc test between CMC-treated group and water-treated group for each of the microbiota used for transplantation. Significant differences were recorded as follows: *p<0.05, **p<0.01, ***p<0.001, ****p<0.0001. n=3–4. ANOVA, analysis of variance; CMC, carboxymethylcellulose; FRESH, Functional Research on Emulsifiers in Humans.CC BY-NC · PubMed Central
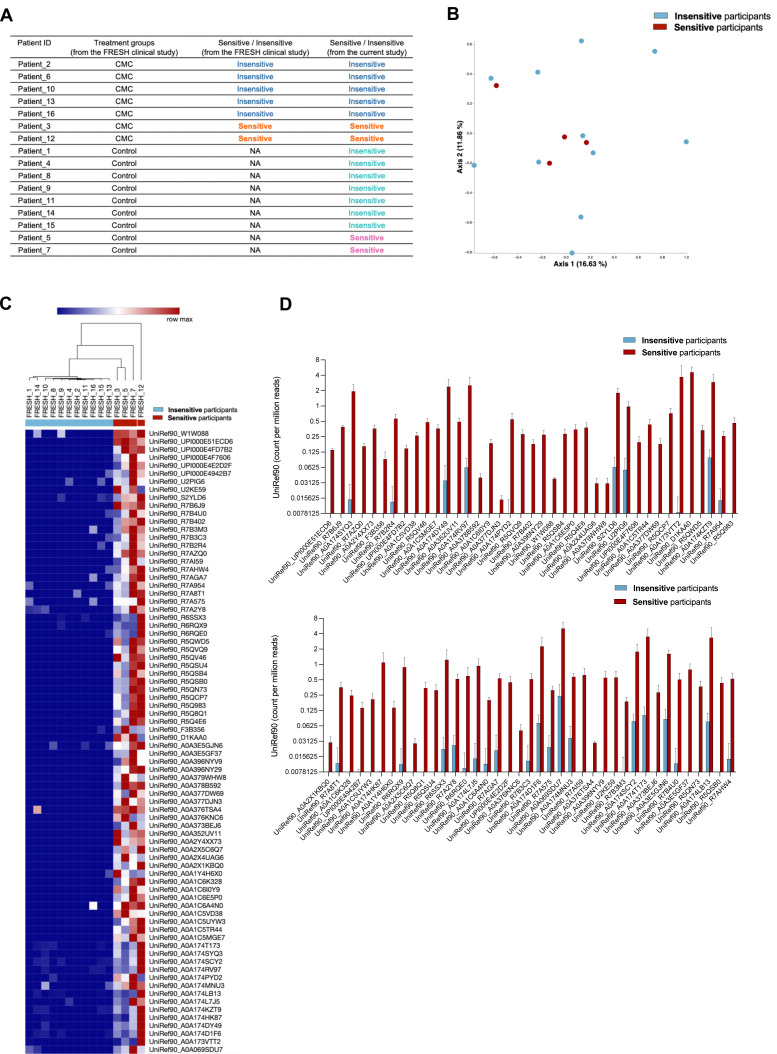
Figure 4 Identification of a metagenomic signature associated with CMC-sensitivity status. (A) List of the FRESH participants used in the current study and their respective CMC-sensitivity status, identified either in clinics or using in vitro microbiota modelisation (B–D) Shotgun metagenomic approach was performed on baseline faecal samples from FRESH participants. (B) PCoA plot of the Bray-Curtis distance matrix generated on metagenomic data from FRESH study participants at the functional level using HUMAnN 3.0 pipeline and the UniRef90 database. (C) Heatmap visualisation of the MaAsLin2-identified emulsifier sensitivity marker’s abundance in sensitive and insensitive FRESH participants. (D) Abundance of the MaAsLin2-identified emulsifier sensitivity marker’s abundance in sensitive and insensitive FRESH participants. CMC, carboxymethylcellulose; FRESH, Functional Research on Emulsifiers in Humans; PCOA, principal coordinates analysis.
Figure 4 Identification of a metagenomic signature associated with CMC-sensitivity status. (A) List of the FRESH participants used in the current study and their respective CMC-sensitivity status, identified either in clinics or using in vitro microbiota modelisation (B–D) Shotgun metagenomic approach was performed on baseline faecal samples from FRESH participants. (B) PCoA plot of the Bray-Curtis distance matrix generated on metagenomic data from FRESH study participants at the functional level using HUMAnN 3.0 pipeline and the UniRef90 database. (C) Heatmap visualisation of the MaAsLin2-identified emulsifier sensitivity marker’s abundance in sensitive and insensitive FRESH participants. (D) Abundance of the MaAsLin2-identified emulsifier sensitivity marker’s abundance in sensitive and insensitive FRESH participants. CMC, carboxymethylcellulose; FRESH, Functional Research on Emulsifiers in Humans; PCOA, principal coordinates analysis.CC BY-NC · PubMed Central
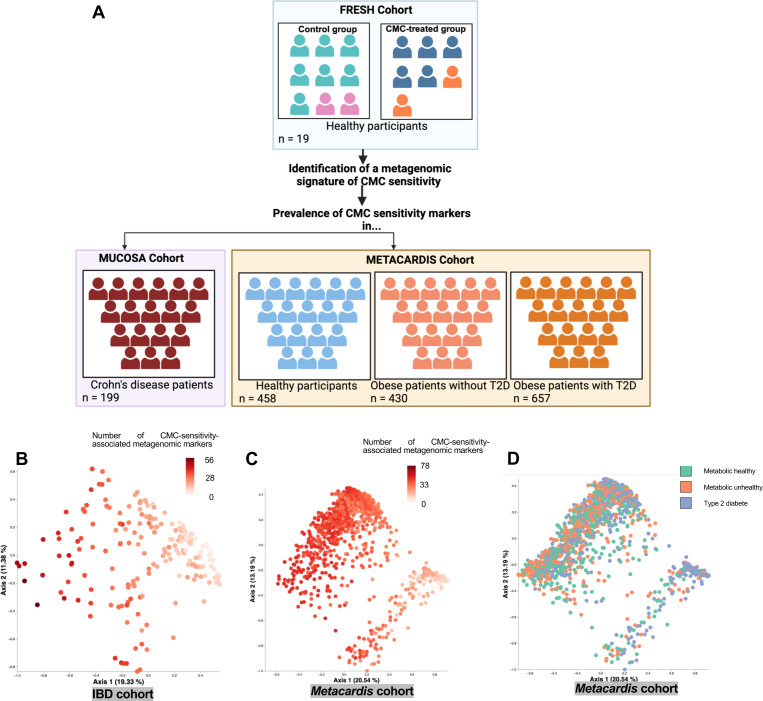
Figure 5 Presence of metagenomic markers associated to CMC-sensitivity status among other cohorts. (A) Overview of the cohorts used in the current study. After use of the FRESH cohort to identify the metagenomic signature of CMC sensitivity, the prevalence of these markers was searched across various cohorts, including healthy participants and patients. (B–D) Shotgun metagenomic approach was performed on faecal samples from Mucosa (IBD patients) and Metacardis (healthy participants and obese±T2D patients) cohorts. Data are represented as PCoA of the Euclidean distance matrix generated using the relative abundance of markers in the Mucosa (B) or (C, D) the Metacardis cohort. Dots are coloured by number of markers present (B, C) or patients health status (D). CMC, carboxymethylcellulose; FRESH, Functional Research on Emulsifiers in Humans; IBD, inflammatory bowel disease; PCoA, principal coordinates analysis; T2D, type 2 diabetes.
Figure 5 Presence of metagenomic markers associated to CMC-sensitivity status among other cohorts. (A) Overview of the cohorts used in the current study. After use of the FRESH cohort to identify the metagenomic signature of CMC sensitivity, the prevalence of these markers was searched across various cohorts, including healthy participants and patients. (B–D) Shotgun metagenomic approach was performed on faecal samples from Mucosa (IBD patients) and Metacardis (healthy participants and obese±T2D patients) cohorts. Data are represented as PCoA of the Euclidean distance matrix generated using the relative abundance of markers in the Mucosa (B) or (C, D) the Metacardis cohort. Dots are coloured by number of markers present (B, C) or patients health status (D). CMC, carboxymethylcellulose; FRESH, Functional Research on Emulsifiers in Humans; IBD, inflammatory bowel disease; PCoA, principal coordinates analysis; T2D, type 2 diabetes.CC BY-NC · PubMed Central

Verification

Claims the paper makes

The claims and statistics of this paper haven’t been checked yet.

Run the check — free, no account needed. It reads the open-access text and checks the sources it cites.

A few free checks a day · papers already verified open instantly · results are public

Self-check

Percentages, sums and reported differences re-computed from the paper’s own numbers.

The self-check needs the paper’s full text.

Citations

Cites

Research works printed but not linked: 51

  1. 10.1038/nri2710 · DOI
  2. 10.1172/JCI72330 · DOI
  3. 10.1111/jgh.16043 · DOI
  4. 10.1016/j.trim.2023.101835 · DOI
  5. 10.1016/S0140-6736(17)32448-0 · DOI · Paper page
  6. 10.1093/ecco-jcc/jjac167 · DOI
  7. 10.1053/j.gastro.2019.06.027 · DOI
  8. 10.1111/apt.15045 · DOI
  9. Marion-Letellier, 2019, Inflammatory Bowel Diseases and Food Additives: To Add Fuel on the Flames!, Nutrients, 11, 10.3390/nu11051111 · DOI
  10. 10.1016/j.ypmed.2019.05.004 · DOI
  11. Naimi, 2021, Direct impact of commonly used dietary emulsifiers on human gut microbiota, Microbiome, 9, 10.1186/s40168-020-00996-6 · DOI
  12. Chassaing, 2017, Colonic Microbiota Encroachment Correlates With Dysglycemia in Humans, Cell Mol Gastroenterol Hepatol, 4, 205, 10.1016/j.jcmgh.2017.04.001 · DOI
  13. 10.1128/IAI.01341-08 · DOI
  14. 10.1053/j.gastro.2021.11.006 · DOI · Paper page
  15. Daniel, 2024, Human Intestinal Microbiome Determines Individualized Inflammatory Response to Dietary Emulsifier Carboxymethylcellulose Consumption, Cell Mol Gastroenterol Hepatol, 17, 315, 10.1016/j.jcmgh.2023.11.001 · DOI · Paper page
  16. Auchtung, 2015, Cultivation of stable, reproducible microbial communities from different fecal donors using minibioreactor arrays (MBRAs), Microbiome, 3, 10.1186/s40168-015-0106-5 · DOI
  17. 10.1007/978-1-4939-6361-4_18 · DOI
  18. Schneeberger, 2015, Akkermansia muciniphila inversely correlates with the onset of inflammation, altered adipose tissue metabolism and metabolic disorders during obesity in mice, Sci Rep, 5, 10.1038/srep16643 · DOI · Paper page
  19. 10.1136/gutjnl-2014-308778 · DOI · Paper page
  20. 10.1038/s41575-022-00631-9 · DOI · Paper page
  21. Cao, 2014, Association between Faecalibacterium prausnitzii Reduction and Inflammatory Bowel Disease: A Meta-Analysis and Systematic Review of the Literature, Gastroenterol Res Pract, 2014, 872725, 10.1155/2014/872725 · DOI
  22. 10.1016/j.mib.2013.06.003 · DOI
  23. 10.1136/gutjnl-2012-303207 · DOI · Paper page
  24. Chassaing, 2018, Mice harboring pathobiont-free microbiota do not develop intestinal inflammation that normally results from an innate immune deficiency, PLoS One, 13, 10.1371/journal.pone.0195310 · DOI
  25. 10.1038/s41586-020-2269-x · DOI
  26. 10.1053/j.gastro.2019.04.021 · DOI
  27. 10.1016/j.cgh.2020.04.006 · DOI
  28. 10.1097/MIB.0000000000000110 · DOI
  29. Hobson, 2022, MiniBioReactor Array (MBRA) in vitro gut model: a reliable system to study microbiota-dependent response to antibiotic treatment, JAC Antimicrob Resist, 4, 10.1093/jacamr/dlac077 · DOI
  30. Hobson, 2022, A Microbiota-Dependent Response to Anticancer Treatment in an In Vitro Human Microbiota Model: A Pilot Study With Hydroxycarbamide and Daunorubicin, Front Cell Infect Microbiol, 12, 10.3389/fcimb.2022.886447 · DOI
  31. Sellem, 2024, Food additive emulsifiers and cancer risk: Results from the French prospective NutriNet-Santé cohort, PLoS Med, 21, 10.1371/journal.pmed.1004338 · DOI
  32. 10.1016/S2213-8587(24)00086-X · DOI
  33. Sellem, 2023, Food additive emulsifiers and risk of cardiovascular disease in the NutriNet-Santé cohort: prospective cohort study, BMJ, 382, 10.1136/bmj-2023-076058 · DOI
  34. Iizuka, 2022, Is the Use of Artificial Sweeteners Beneficial for Patients with Diabetes Mellitus? The Advantages and Disadvantages of Artificial Sweeteners, Nutrients, 14, 10.3390/nu14214446 · DOI
  35. 10.1016/j.bbrc.2024.150798 · DOI
  36. Palmnäs, 2014, Low-dose aspartame consumption differentially affects gut microbiota-host metabolic interactions in the diet-induced obese rat, PLoS One, 9, 10.1371/journal.pone.0109841 · DOI
  37. 10.1016/j.cell.2022.07.016 · DOI · Paper page
  38. Bonazzi, 2024, Individualized microbiotas dictate the impact of dietary fiber on colitis sensitivity, Microbiome, 12, 10.1186/s40168-023-01724-6 · DOI
  39. 10.1038/ismej.2012.8 · DOI · Paper page
  40. 10.4056/aigs.1443528 · DOI
  41. 10.1038/s41587-019-0209-9 · DOI · Paper page
  42. 10.1038/nmeth.3869 · DOI · Paper page
  43. 10.1038/ismej.2011.139 · DOI
  44. 10.1039/c2an35392j · DOI
  45. 10.1021/pr2011507 · DOI
  46. 10.1089/cmb.2017.0096 · DOI
  47. Inam, 2022, Impact of Antibiotics on the Lung Microbiome and Lung Function in Children With Cystic Fibrosis 1 Year After Hospitalization for an Initial Pulmonary Exacerbation, Open Forum Infect Dis, 9, 10.1093/ofid/ofac466 · DOI
  48. 10.1177/0023677214544728 · DOI
  49. 10.1172/JCI200522996 · DOI
  50. Chassaing, 2012, Fecal lipocalin 2, a sensitive and broadly dynamic non-invasive biomarker for intestinal inflammation, PLoS One, 7, 10.1371/journal.pone.0044328 · DOI
  51. 10.1007/978-1-61779-513-8_13 · DOI

Metadata

Authors
Rytter, H., Naimi, S., Wu, G., Lewis, J., Duquesnoy, M., Vigué, L., Tenaillon, O., Belda, E., Vazquez-Gomez, M., Touly, N., Arnone, D., Hao, F., Ley, R. E., Clément, K., Peyrin-Biroulet, L., Patterson, A. D., Gewirtz, A. T., & Chassaing, B.
Affiliations
  • Centre National de la Recherche Scientifique (FR)
  • University of Pennsylvania (US)
  • Microbiome-Host Interactions, INSERM U1306, CNRS UMR6047, Institut Pasteur, Université Paris Cité, Paris, France
  • Inserm (FR)
  • Inserm, Nutrition and Obesities: Systemic Approaches Research Unit, NutriOmics, Sorbonne University, Paris, France
  • Pennsylvania State University (US)
  • Max Planck Institute for Biology (DE)
  • INFINY Institute, Nancy University Hospital, Vandœuvre-lès-Nancy, France
  • Georgia State University (US)
Venue
Gut
Publisher
BMJ
Published
2025-01-27
Volume
74
Issue
5
Pages
761-774
ISSN
  • 0017-5749 (ISSN-L)
  • 1468-3288
OpenAlex
W4406870625
Cited by
19
References
7
Citations by year
2026: 12 · 2025: 7
FWCI
5.71
Type
journal article
Language
en
Open access
Locations
  • Gut (publishedVersion, cc-by-nc)
  • PubMed Central (publishedVersion, cc-by-nc)
  • PubMed (publishedVersion)
  • HAL (submittedVersion, cc-by)
Funders
  • EMULBIONT (ANR-21-CE15-0042-01)
  • Paris Région – DIM One Health-DOH 2.0
  • European Research Council
  • INSERM
  • DREAM (ANR-20-PAMR-0002)
  • the Kenneth Rainin Foundation, ANR (ANR-21-CE15-0042-01)
  • European Union (804135, ERC-2018-StG)
Topics
  • Life Sciences › Biochemistry, Genetics and Molecular Biology › Molecular Biology › Gut microbiota and health
  • Health Sciences › Medicine › Gastroenterology › Gastrointestinal motility and disorders
  • Health Sciences › Nursing › Nutrition and Dietetics › Microbial Metabolites in Food Biotechnology
Keywords
food emulsifiers, carboxymethyl cellulose, gut microbiota, microbiota transplantation, colitis, personalized nutrition, chronic intestinal inflammation
MeSH terms
Gastrointestinal Microbiome, Animals, Carboxymethylcellulose Sodium, Female, Humans, Male, Interleukin-10, Emulsifying Agents, Mice

About these checks

Registry, retraction, Cites and statistics results are computed, not judged, with one exception: a printed reference that no index lists is read once by a model before it counts as a citation error. Claims are extracted by a model and kept only when their quote appears verbatim in the text; each cited source is then checked, with a model’s help, for whether it says what the claim relies on. Those verdicts can be wrong — read the claim’s quote and the cited source before relying on one.

Statistics and arithmetic are recomputed, not judged.

Confidence bands are shown only for fields calibrated on our annotated test set. None is calibrated yet, so no band is shown.

What counts as a claim ›How we measure confidence ›How we check this ›

Are you an author, or do you see a problem with this page? Request a review