

The DOI matches its Crossref record; 4 of the 4 references it cites were found in a registry or an index.
Downregulation of exosomal miR-204-5p and miR-632 as a biomarker for FTD: a GENFI study
Abstract
Objective: To determine whether exosomal microRNAs (miRNAs) in cerebrospinal fluid (CSF) of patients with frontotemporal dementia (FTD) can serve as diagnostic biomarkers, we assessed miRNA expression in the Genetic Frontotemporal Dementia Initiative (GENFI) cohort and in sporadic FTD. Methods: GENFI participants were either carriers of a pathogenic mutation in progranulin, chromosome 9 open reading frame 72 or microtubule-associated protein tau or were at risk of carrying a mutation because a first-degree relative was a known symptomatic mutation carrier. Exosomes were isolated from CSF of 23 presymptomatic and 15 symptomatic mutation carriers and 11 healthy non-mutation carriers. Expression of 752 miRNAs was measured using quantitative PCR (qPCR) arrays and validated by qPCR using individual primers. MiRNAs found differentially expressed in symptomatic compared with presymptomatic mutation carriers were further evaluated in a cohort of 17 patients with sporadic FTD, 13 patients with sporadic Alzheimer’s disease (AD) and 10 healthy controls (HCs) of similar age. Results: In the GENFI cohort, miR-204-5p and miR-632 were significantly decreased in symptomatic compared with presymptomatic mutation carriers. Decrease of miR-204-5p and miR-632 revealed receiver operator characteristics with an area of 0.89 (90% CI 0.79 to 0.98) and 0.81 (90% CI 0.68 to 0.93), respectively, and when combined an area of 0.93 (90% CI 0.87 to 0.99). In sporadic FTD, only miR-632 was significantly decreased compared with AD and HCs. Decrease of miR-632 revealed an area of 0.90 (90% CI 0.81 to 0.98). Conclusions: Exosomal miR-204-5p and miR-632 have potential as diagnostic biomarkers for genetic FTD and miR-632 also for sporadic FTD.
Overview
The claims and statistics of this paper haven’t been checked yet.
Run the check — free, no account needed. It reads the open-access text and checks the sources it cites.
Integrity signals
Registry
Cites
Statistics
Figures
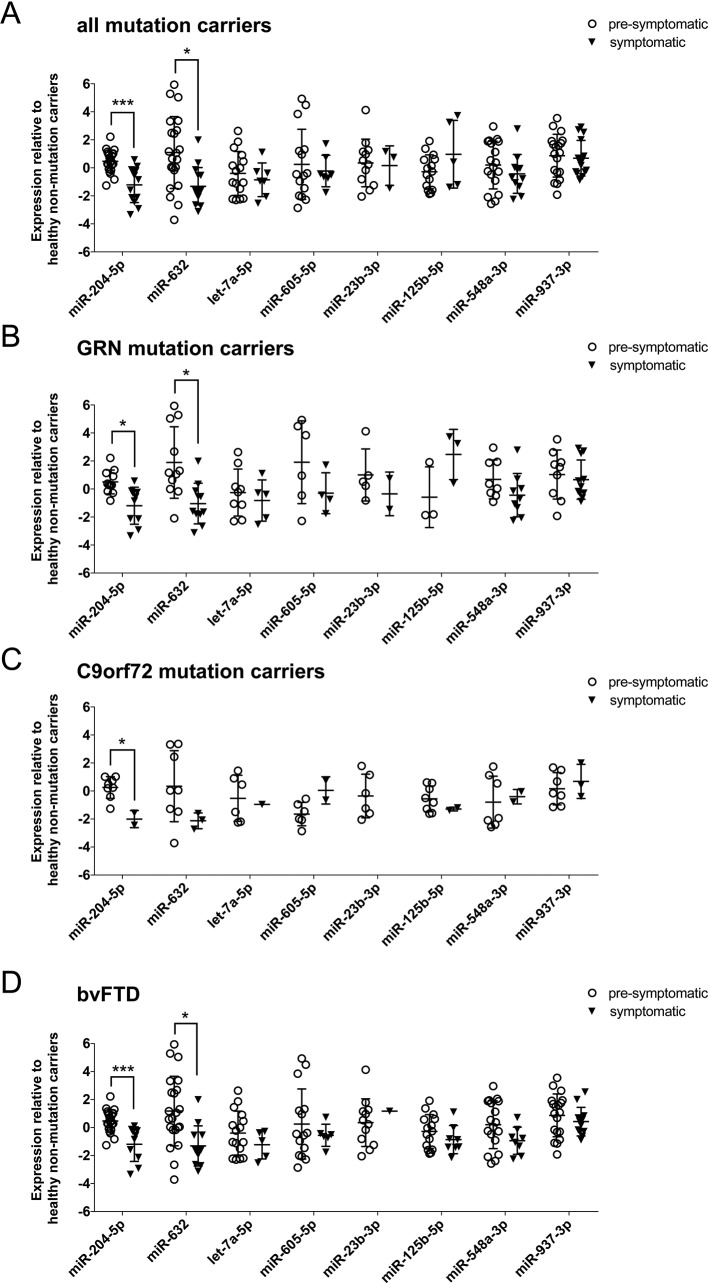
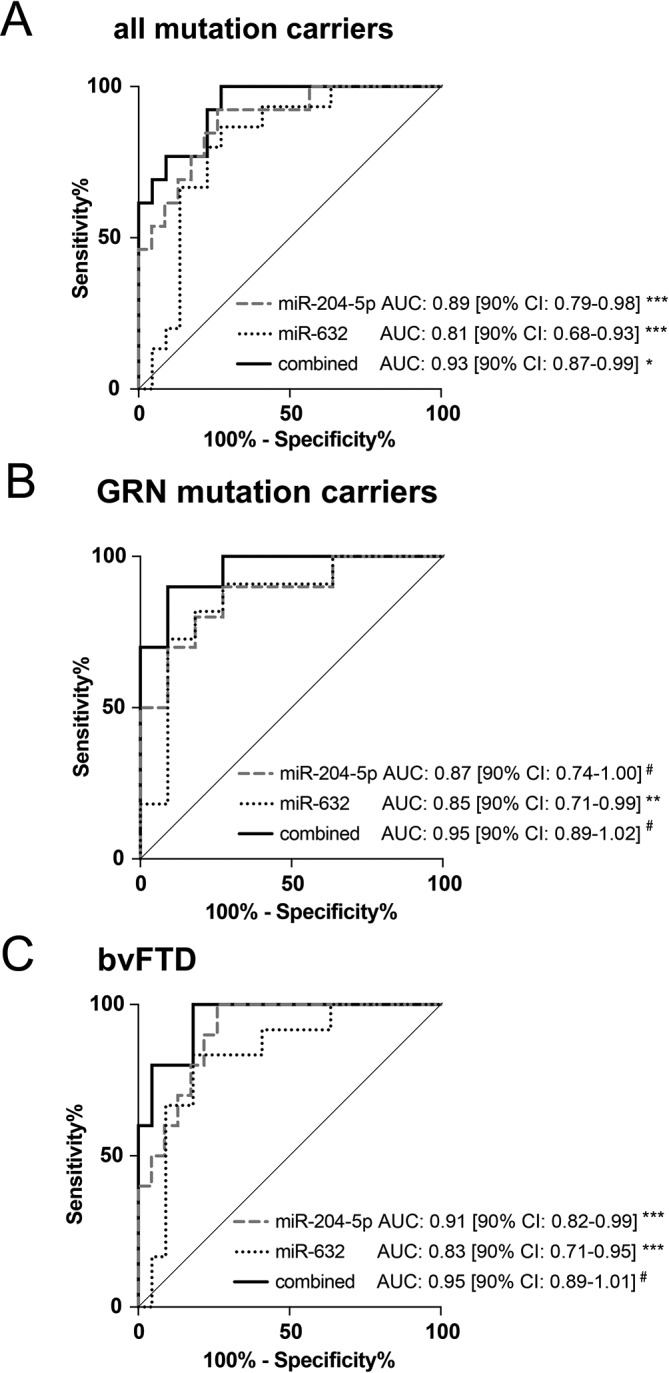
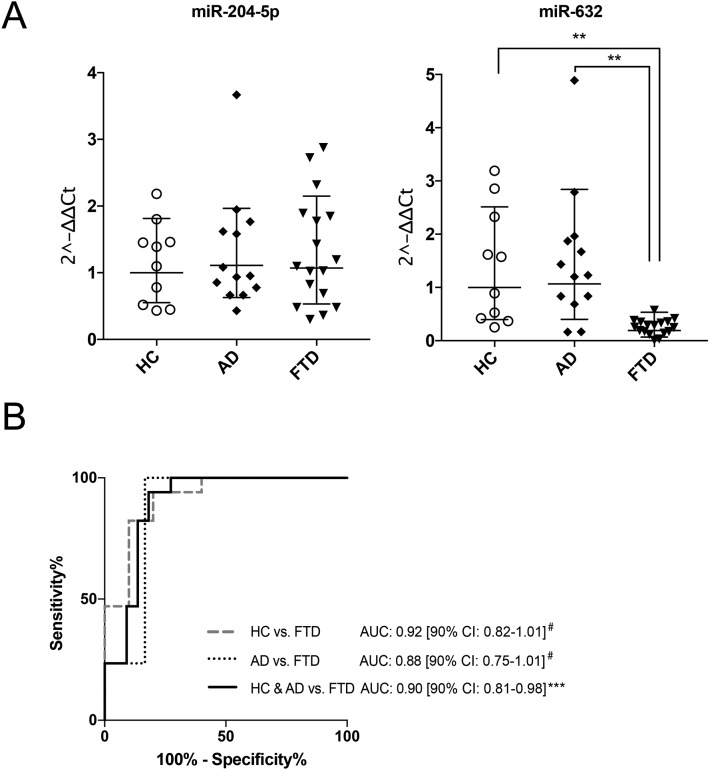
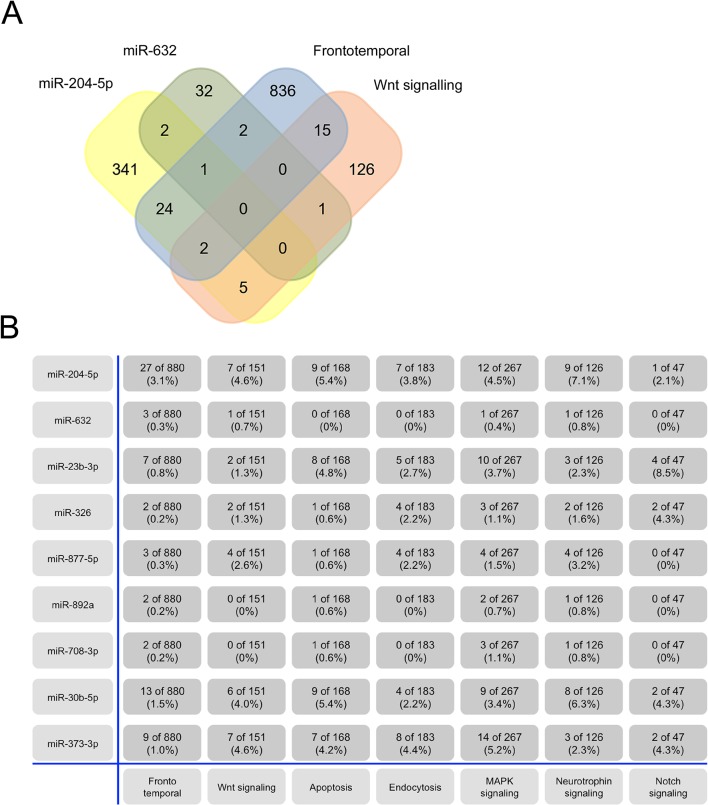
Verification
Claims the paper makes
The claims and statistics of this paper haven’t been checked yet.
Run the check — free, no account needed. It reads the open-access text and checks the sources it cites.
Claims other papers make about this one
Each is checked against this paper’s own text: does it say what the citing paper says it does?
The cited source says what the claim attributes to it.
In the citing paper
“They recognised a good potential for the miR-632 in the diagnosis of the genetic and sporadic form of FTD, while the miR-204-5p appeared to have an interesting diagnostic potential only for the genetic FTD [62].”
From miR-92a-3p and miR-320a are Upregulated in Plasma Neuron-Derived Extracellular Vesicles of Patients with Frontotemporal Dementia (2025) · cites this paper as [62]
In the citing paper
“One interesting study analysed the exosomal miRNAs in CSF of patients from the Genetic FTD Initiative (GENFI) with sporadic FTD, highlighting the downregulation of the miR-632 and the miR-204-5p in patients [62].”
From miR-92a-3p and miR-320a are Upregulated in Plasma Neuron-Derived Extracellular Vesicles of Patients with Frontotemporal Dementia (2025) · cites this paper as [62]
In the citing paper
“These findings align with a previous study where decreased miR-204-5p levels were observed in CSF exosomes from presymptomatic C9ORF72, MAPT, and GRN carriers, suggesting that miR-204-5p could serve as a biomarker for early detection of FTD pathology [43].”
From A role for astrocytic miR-129-5p in frontotemporal dementia (2025) · cites this paper as [43]
In the citing paper
“These findings align with a previous study where decreased miR-204-5p levels were observed in CSF exosomes from presymptomatic C9ORF72, MAPT, and GRN carriers, suggesting that miR-204-5p could serve as a biomarker for early detection of FTD pathology [43].”
From A role for astrocytic miR-129-5p in frontotemporal dementia (2025) · cites this paper as [43]
Self-check
Percentages, sums and reported differences re-computed from the paper’s own numbers.
The self-check needs the paper’s full text.
Citations
Cites
An anatomically comprehensive atlas of the adult human brain transcriptome
Hawrylycz, M. J., Lein, E. S., Guillozet-Bongaarts, A. L., Shen, E. H., Ng, L., Miller, J. A., van de Lagemaat, L. N., Smith, K. A., Ebbert, A., Riley, Z. L., et al. (2012) · Nature · doi:10.1038/nature11405 · Cited by 3,083
Towards a molecular understanding of microRNA-mediated gene silencing
Jonas, S., & Izaurralde, E. (2015) · Nature Reviews Genetics · doi:10.1038/nrg3965 · Cited by 1,872
Circulating miRNAs as Potential Biomarkers in Alzheimer's Disease
Galimberti, D., Villa, C., Fenoglio, C., Serpente, M., Ghezzi, L., Cioffi, S. M. G., Arighi, A., Fumagalli, G., & Scarpini, E. (2014) · Journal of Alzheimer’s Disease · doi:10.3233/jad-140756 · Cited by 222
Self-citationChen-Plotkin, A. S., Geser, F., Plotkin, J. B., Clark, C. M., Kwong, L. K., Yuan, W., Grossman, M., Van Deerlin, V. M., Trojanowski, J. Q., & Lee, V. M.-Y. (2008) · Human Molecular Genetics · doi:10.1093/hmg/ddn023 · Cited by 135
Research works printed but not linked: 38
- 10.1016/S0140-6736(15)00461-4 · DOI · Paper page
- Maloney, 2016, Epigenetics of dementia: understanding the disease as a transformation rather than a state, Lancet Neurol, 15, 760, 10.1016/S1474-4422(16)00065-X · DOI
- 10.1093/brain/awg204 · DOI
- 10.1093/hmg/ddn257 · DOI
- Kocerha, 2011, Altered microRNA expression in frontotemporal lobar degeneration with TDP-43 pathology caused by progranulin mutations, BMC Genomics, 12, 527, 10.1186/1471-2164-12-527 · DOI
- 10.1523/JNEUROSCI.0521-12.2012 · DOI · Paper page
- Bracken, 2016, A network-biology perspective of microRNA function and dysfunction in cancer, Nat Rev Genet, 17, 719, 10.1038/nrg.2016.134 · DOI
- 10.1016/0304-3835(83)90040-X · DOI
- Ratajczak, 2016, Horizontal transfer of RNA and proteins between cells by extracellular microvesicles: 14 years later, Clin Transl Med, 5, 7, 10.1186/s40169-016-0087-4 · DOI
- 10.1073/pnas.0914843107 · DOI
- 10.1523/JNEUROSCI.6476-10.2011 · DOI · Paper page
- 10.1016/j.mcn.2010.11.004 · DOI
- 10.1002/stem.1129 · DOI
- 10.1074/jbc.M112.410944 · DOI · Paper page
- 10.1016/j.ccell.2016.10.009 · DOI · Paper page
- Gallo A , Tandon M , Alevizos I , et al . The majority of microRNAs detectable in serum and saliva is concentrated in exosomes. PLoS One 2012;7:e30679. doi:10.1371/journal.pone.0030679 · DOI · Paper page
- Cheng, 2014, Exosomes provide a protective and enriched source of miRNA for biomarker profiling compared to intracellular and cell-free blood, J Extracell Vesicles, 3, 23743, 10.3402/jev.v3.23743 · DOI · Paper page
- 10.1016/0022-3956(75)90026-6 · DOI · Paper page
- 10.1093/brain/awr179 · DOI · Paper page
- 10.1212/WNL.0b013e31821103e6 · DOI · Paper page
- 10.1016/0022-510X(94)90191-0 · DOI
- 10.1016/j.jalz.2011.03.005 · DOI · Paper page
- 10.1186/2051-5960-1-42 · DOI
- 10.1006/meth.2001.1262 · DOI · Paper page
- 10.1038/nmeth.3485 · DOI
- 10.1093/nar/gkw1092 · DOI · Paper page
- 10.1093/emboj/16.7.1686 · DOI
- 10.1016/j.neuron.2011.07.021 · DOI · Paper page
- Alquézar, 2016, Progranulin deficiency induces overactivation of WNT5A expression via TNF-α/NF-κB pathway in peripheral cells from frontotemporal dementia-linked granulin mutation carriers, J Psychiatry Neurosci, 41, 225, 10.1503/jpn.150131 · DOI
- 10.1038/jhg.2016.91 · DOI
- Sørensen, 2016, miRNA expression profiles in cerebrospinal fluid and blood of patients with Alzheimer’s disease and other types of dementia - an exploratory study, Transl Neurodegener, 5, 6, 10.1186/s40035-016-0053-5 · DOI
- 10.1016/j.neuron.2011.09.002 · DOI
- Xia Q , Hu Q , Wang H , et al . Induction of COX-2-PGE2 synthesis by activation of the MAPK/ERK pathway contributes to neuronal death triggered by TDP-43-depleted microglia. Cell Death Dis 2015;6:e1702. doi:10.1038/cddis.2015.69 · DOI
- 10.1093/hmg/ddq100 · DOI
- 10.1016/j.neuron.2010.09.034 · DOI · Paper page
- 10.1007/s00401-015-1448-6 · DOI
- 10.1016/S0304-3940(99)00937-4 · DOI
- 10.1186/1750-1326-7-33 · DOI
Cited by
Sorted by citations
Frontotemporal lobar degeneration
Grossman, M., Seeley, W. W., Boxer, A. L., Hillis, A. E., Knopman, D. S., Ljubenov, P. A., Miller, B., Piguet, O., Rademakers, R., Whitwell, J. L., et al. (2023) · Nature Reviews Disease Primers · doi:10.1038/s41572-023-00447-0 · Cited by 178
Self-citationFluid biomarkers in frontotemporal dementia: past, present and future
Swift, I. J., Sogorb-Esteve, A., Heller, C., Synofzik, M., Otto, M., Graff, C., Galimberti, D., Todd, E., Heslegrave, A. J., van der Ende, E. L., et al. (2021) · Journal of Neurology, Neurosurgery & Psychiatry · doi:10.1136/jnnp-2020-323520 · Cited by 122
Self-citationMonteiro-Reis, S., Carvalho-Maia, C., Bart, G., Vainio, S. J., Pedro, J., Silva, E. R., Sales, G., Henrique, R., & Jerónimo, C. (2021) · International Journal of Molecular Sciences · doi:10.3390/ijms22063267 · Cited by 21
Manzini, V., Cappelletti, P., Orefice, N. S., Brentari, I., Rigby, M. J., Lo Giudice, M., Feligioni, M., Rivabene, R., Crestini, A., Manfredi, F., et al. (2025) · Molecular Neurobiology · doi:10.1007/s12035-024-04386-z · Cited by 16
A role for astrocytic miR-129-5p in frontotemporal dementia
Kaurani, L., Pradhan, R., Schröder, S., Burkhardt, S., Schuetz, A.-L., Krüger, D. M., Pena, T., Heutink, P., Sananbenesi, F., & Fischer, A. (2025) · Translational Psychiatry · doi:10.1038/s41398-025-03338-y · Cited by 10
Metadata
- Authors
- Schneider, R., McKeever, P., Kim, T., Graff, C., van Swieten, J. C., Karydas, A., Boxer, A., Rosen, H., Miller, B. L., Laforce Jr, R., Galimberti, D., Masellis, M., Borroni, B., Zhang, Z., Zinman, L., Rohrer, J. D., Tartaglia, M. C., & Robertson, J.
- ORCID
- Schneider, Raphael
- Venue
- Journal of Neurology, Neurosurgery & Psychiatry
- Publisher
- BMJ
- Published
- 2018-02-06
- Volume
- 89
- Issue
- 8
- Pages
- 851-858
- ISSN
- 0022-3050
- 1468-330X
- PMC
- PMC6045452
- Cited by
- 62
- References
- 4
- Language
- en
About these checks
Registry, retraction, Cites and statistics results are computed, not judged, with one exception: a printed reference that no index lists is read once by a model before it counts as a citation error. Claims are extracted by a model and kept only when their quote appears verbatim in the text; each cited source is then checked, with a model’s help, for whether it says what the claim relies on. Those verdicts can be wrong — read the claim’s quote and the cited source before relying on one.
Statistics and arithmetic are recomputed, not judged.
Confidence bands are shown only for fields calibrated on our annotated test set. None is calibrated yet, so no band is shown.
What counts as a claim ›How we measure confidence ›How we check this ›
Are you an author, or do you see a problem with this page? Request a review
