

The DOI matches its Crossref record; 2 of the 2 references it cites were found in a registry or an index.
Unraveling the Global Proteome and Phosphoproteome of Prostate Cancer Patient-Derived Xenografts
Open accessPublished version of a preprint
Abstract
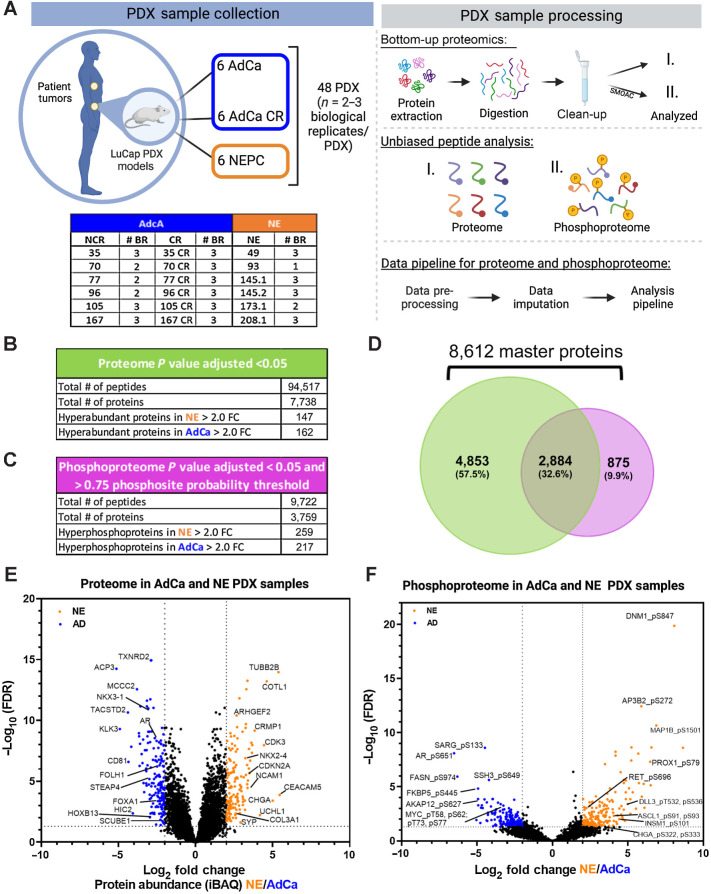
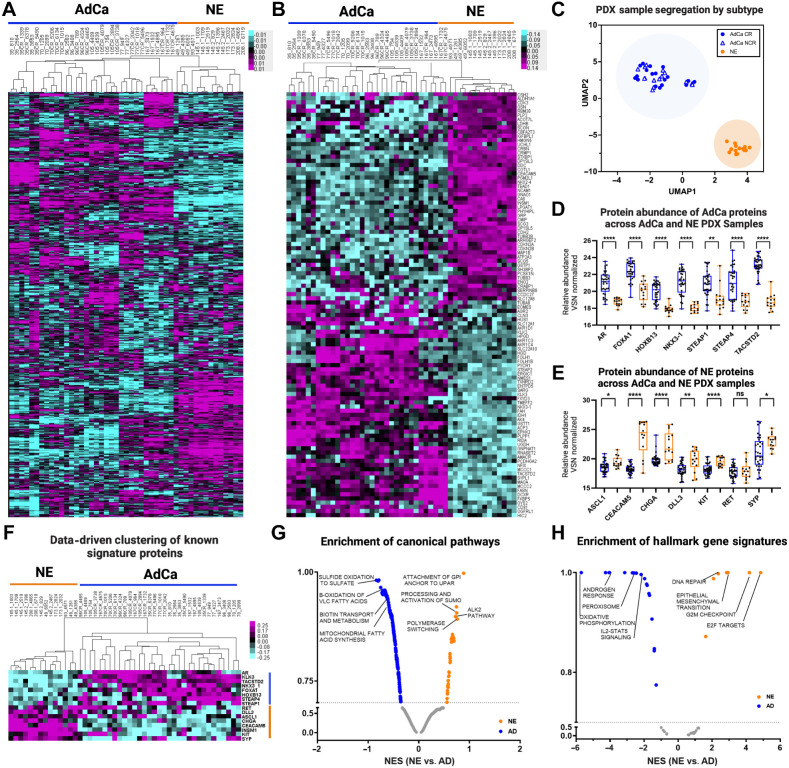
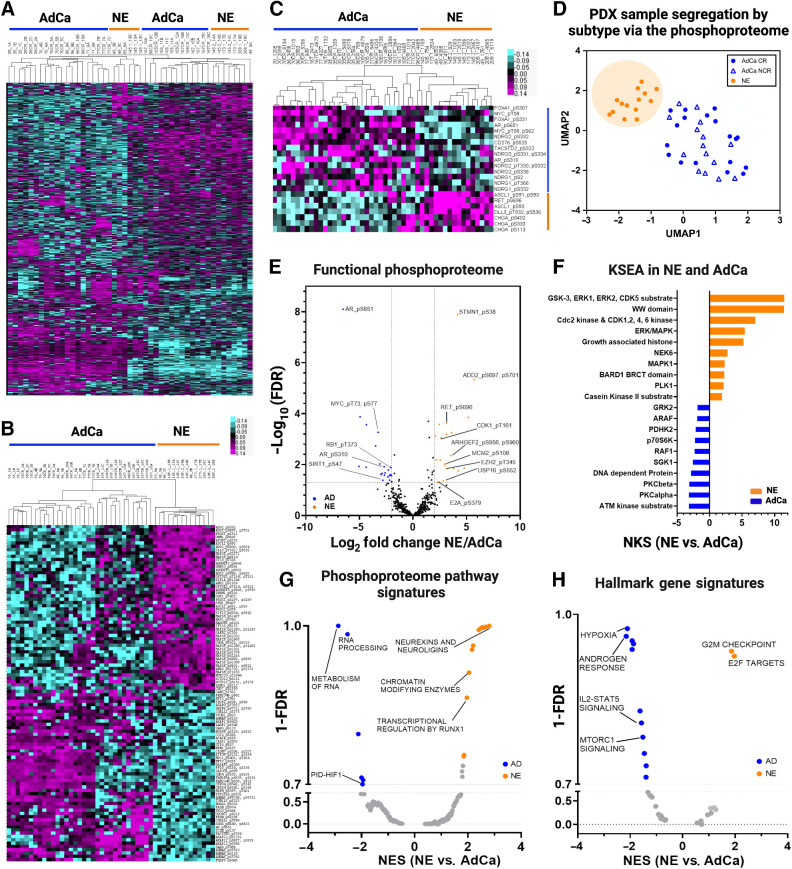
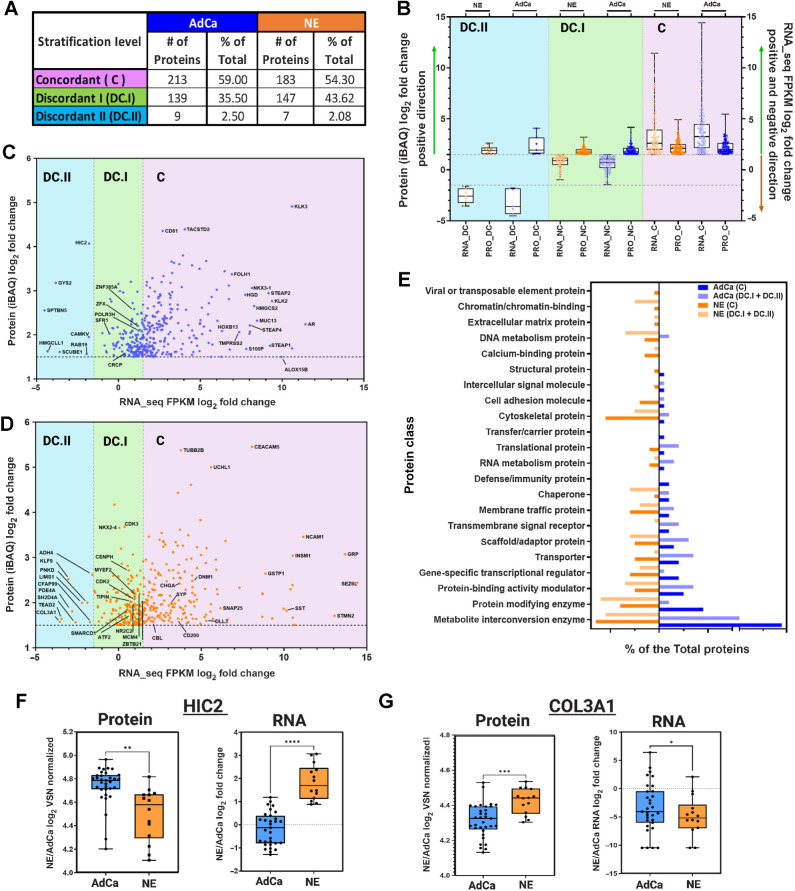
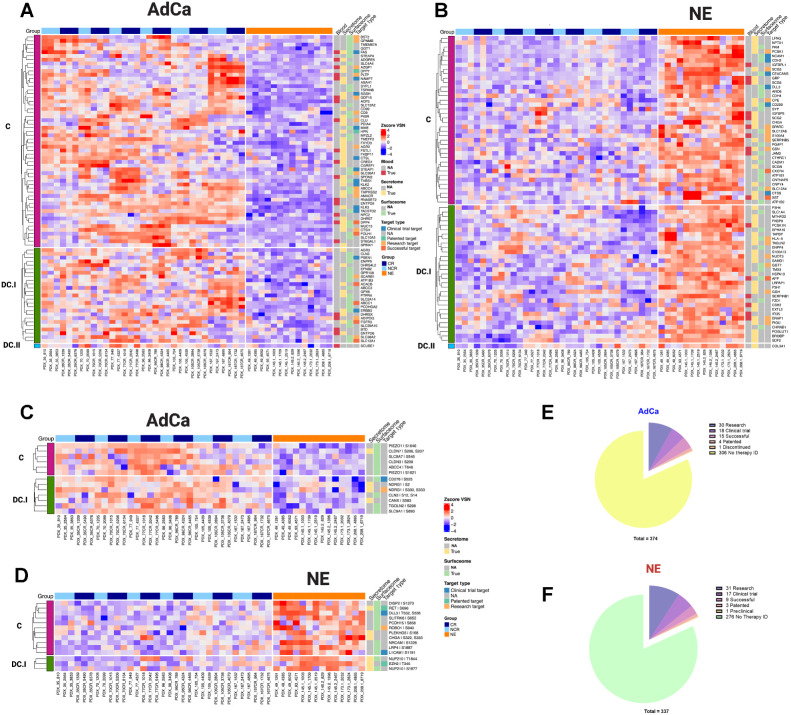
Resistance to androgen-deprivation therapies leads to metastatic castration-resistant prostate cancer (mCRPC) of adenocarcinoma (AdCa) origin that can transform into emergent aggressive variant prostate cancer (AVPC), which has neuroendocrine (NE)-like features. In this work, we used LuCaP patient-derived xenograft (PDX) tumors, clinically relevant models that reflect and retain key features of the tumor from advanced prostate cancer patients. Here we performed proteome and phosphoproteome characterization of 48 LuCaP PDX tumors and identified over 94,000 peptides and 9,700 phosphopeptides corresponding to 7,738 proteins. We compared 15 NE versus 33 AdCa samples, which included six different PDX tumors for each group in biological replicates, and identified 309 unique proteins and 476 unique phosphopeptides that were significantly altered and corresponded to proteins that are known to distinguish these two phenotypes. Assessment of concordance from PDX tumor-matched protein and mRNA revealed increased dissonance in transcriptionally regulated proteins in NE and metabolite interconversion enzymes in AdCa. Implications: Overall, our study highlights the importance of protein-based identification when compared with RNA and provides a rich resource of new and feasible targets for clinical assay development and in understanding the underlying biology of these tumors.
Overview
The claims and statistics of this paper haven’t been checked yet.
Run the check — free, no account needed. It reads the open-access text and checks the sources it cites.
Integrity signals
Registry
Cites
Statistics
Figures
Verification
Claims the paper makes
The claims and statistics of this paper haven’t been checked yet.
Run the check — free, no account needed. It reads the open-access text and checks the sources it cites.
Self-check
Percentages, sums and reported differences re-computed from the paper’s own numbers.
The self-check needs the paper’s full text.
Citations
Cites
Global quantification of mammalian gene expression control
Schwanhäusser, B., Busse, D., Li, N., Dittmar, G., Schuchhardt, J., Wolf, J., Chen, W., & Selbach, M. (2011) · Nature · doi:10.1038/nature10098 · Cited by 6,566
Emerging mechanisms of resistance to androgen receptor inhibitors in prostate cancer
Watson, P. A., Arora, V. K., & Sawyers, C. L. (2015) · Nature Reviews Cancer · doi:10.1038/nrc4016 · Cited by 1,536
Research works printed but not linked: 62
- Stephan, 2014, Prostate-specific antigen (PSA) screening and new biomarkers for prostate cancer (PCa), EJIFCC, 25, 55
- Wadosky, 2017, Androgen receptor splice variants and prostate cancer: From bench to bedside, Oncotarget, 8, 18550, 10.18632/oncotarget.14537 · DOI
- Antonarakis, 2016, Androgen receptor variant-driven prostate cancer: clinical implications and therapeutic targeting, Prostate Cancer Prostatic Dis, 19, 231, 10.1038/pcan.2016.17 · DOI
- Beltran, 2016, Divergent clonal evolution of castration-resistant neuroendocrine prostate cancer, Nat Med, 22, 298, 10.1038/nm.4045 · DOI
- Abida, 2019, Genomic correlates of clinical outcome in advanced prostate cancer, Proc Natl Acad Sci USA, 116, 11428, 10.1073/pnas.1902651116 · DOI · Paper page
- Robinson, 2015, Integrative clinical genomics of advanced prostate cancer, Cell, 161, 1215, 10.1016/j.cell.2015.05.001 · DOI · Paper page
- Baca, 2013, Punctuated evolution of prostate cancer genomes, Cell, 153, 666, 10.1016/j.cell.2013.03.021 · DOI
- Taylor, 2010, Integrative genomic profiling of human prostate cancer, Cancer Cell, 18, 11, 10.1016/j.ccr.2010.05.026 · DOI
- Berger, 2011, The genomic complexity of primary human prostate cancer, Nature, 470, 214, 10.1038/nature09744 · DOI
- Barbieri, 2012, Exome sequencing identifies recurrent SPOP, FOXA1 and MED12 mutations in prostate cancer, Nat Genet, 44, 685, 10.1038/ng.2279 · DOI
- Tomlins, 2007, Distinct classes of chromosomal rearrangements create oncogenic ETS gene fusions in prostate cancer, Nature, 448, 595, 10.1038/nature06024 · DOI
- Pflueger, 2011, Discovery of non-ETS gene fusions in human prostate cancer using next-generation RNA sequencing, Genome Res, 21, 56, 10.1101/gr.110684.110 · DOI
- Wang, 2011, Characterization of KRAS rearrangements in metastatic prostate cancer, Cancer Discov, 1, 35, 10.1158/2159-8274.CD-10-0022 · DOI
- Cooper, 2015, Analysis of the genetic phylogeny of multifocal prostate cancer identifies multiple independent clonal expansions in neoplastic and morphologically normal prostate tissue, Nat Genet, 47, 367, 10.1038/ng.3221 · DOI
- Lam, 2017, Characterization of an abiraterone ultraresponsive phenotype in castration-resistant prostate cancer patient-derived xenografts, Clin Cancer Res, 23, 2301, 10.1158/1078-0432.CCR-16-2054 · DOI
- Nguyen, 2020, Pan-cancer analysis of CDK12 alterations identifies a subset of prostate cancers with distinct genomic and clinical characteristics, Eur Urol, 78, 671, 10.1016/j.eururo.2020.03.024 · DOI
- Nickols, 2019, MEK-ERK signaling is a therapeutic target in metastatic castration resistant prostate cancer, Prostate Cancer Prostatic Dis, 22, 531, 10.1038/s41391-019-0134-5 · DOI
- Pascal, 2011, Lineage relationship of prostate cancer cell types based on gene expression, BMC Med Genomics, 4, 46, 10.1186/1755-8794-4-46 · DOI
- Vogelstein, 2013, Cancer genome landscapes, Science, 339, 1546, 10.1126/science.1235122 · DOI · Paper page
- Armenia, 2018, The long tail of oncogenic drivers in prostate cancer, Nat Genet, 50, 645, 10.1038/s41588-018-0078-z · DOI
- Garraway, 2013, Lessons from the cancer genome, Cell, 153, 17, 10.1016/j.cell.2013.03.002 · DOI
- Schwartz, 2015, Feedback suppression of PI3Kalpha signaling in PTEN-mutated tumors is relieved by selective inhibition of PI3Kbeta, Cancer Cell, 27, 109, 10.1016/j.ccell.2014.11.008 · DOI
- Lin, 2014, High fidelity patient-derived xenografts for accelerating prostate cancer discovery and drug development, Cancer Res, 74, 1272, 10.1158/0008-5472.CAN-13-2921-T · DOI
- Shi, 2022, Patient-derived xenograft models of neuroendocrine prostate cancer, Cancer Lett, 525, 160, 10.1016/j.canlet.2021.11.004 · DOI
- Risbridger, 2021, The MURAL collection of prostate cancer patient-derived xenografts enables discovery through preclinical models of uro-oncology, Nat Commun, 12, 5049, 10.1038/s41467-021-25175-5 · DOI
- Palanisamy, 2020, The MD Anderson prostate cancer patient-derived xenograft series (MDA PCa PDX) captures the molecular landscape of prostate cancer and facilitates marker-driven therapy development, Clin Cancer Res, 26, 4933, 10.1158/1078-0432.CCR-20-0479 · DOI
- Flores-Morales, 2019, Proteogenomic characterization of patient-derived xenografts highlights the role of REST in neuroendocrine differentiation of castration-resistant prostate cancer, Clin Cancer Res, 25, 595, 10.1158/1078-0432.CCR-18-0729 · DOI
- Nguyen, 2017, LuCaP prostate cancer patient-derived xenografts reflect the molecular heterogeneity of advanced disease and serve as models for evaluating cancer therapeutics, 654
- Hebert, 2018, Comprehensive single-shot proteomics with FAIMS on a hybrid orbitrap mass spectrometer, Anal Chem, 90, 9529, 10.1021/acs.analchem.8b02233 · DOI
- Swearingen, 2012, High-field asymmetric waveform ion mobility spectrometry for mass spectrometry-based proteomics, Expert Rev Proteomics, 9, 505, 10.1586/epr.12.50 · DOI
- Drake, 2016, Phosphoproteome integration reveals patient-specific networks in prostate cancer, Cell, 166, 1041, 10.1016/j.cell.2016.07.007 · DOI
- Cheng, 2018, Phosphopeptide enrichment coupled with label-free quantitative mass spectrometry to investigate the phosphoproteome in prostate cancer, J Vis Exp, 57996
- Nita-Lazar, 2008, Quantitative phosphoproteomics by mass spectrometry: past, present, and future, Proteomics, 8, 4433, 10.1002/pmic.200800231 · DOI
- Cox, 2008, MaxQuant enables high peptide identification rates, individualized p.p.b.-range mass accuracies and proteome-wide protein quantification, Nat Biotechnol, 26, 1367, 10.1038/nbt.1511 · DOI · Paper page
- Huber, 2002, Variance stabilization applied to microarray data calibration and to the quantification of differential expression, Bioinformatics, 18, S96, 10.1093/bioinformatics/18.suppl_1.S96 · DOI · Paper page
- Valikangas, 2018, A systematic evaluation of normalization methods in quantitative label-free proteomics, Brief Bioinform, 19, 1
- Suomi, 2017, ROTS: an R package for reproducibility-optimized statistical testing, PLoS Comput Biol, 13, e1005562, 10.1371/journal.pcbi.1005562 · DOI
- Eisen, 1998, Cluster analysis and display of genome-wide expression patterns, Proc Natl Acad Sci USA, 95, 14863, 10.1073/pnas.95.25.14863 · DOI · Paper page
- Saldanha, 2004, Java treeview–extensible visualization of microarray data, Bioinformatics, 20, 3246, 10.1093/bioinformatics/bth349 · DOI
- Coleman, 2022, Therapeutic implications for intrinsic phenotype classification of metastatic castration-resistant prostate cancer, Clin Cancer Res, 28, 3127, 10.1158/1078-0432.CCR-21-4289 · DOI
- Uhlén, 2019, The human secretome, Sci Signal, 12, eaaz0274, 10.1126/scisignal.aaz0274 · DOI · Paper page
- Bausch-Fluck, 2018, The in silico human surfaceome, Proc Natl Acad Sci USA, 115, E10988, 10.1073/pnas.1808790115 · DOI
- Hornbeck, 2015, PhosphoSitePlus, 2014: mutations, PTMs and recalibrations, Nucleic Acids Res, 43, D512, 10.1093/nar/gku1267 · DOI · Paper page
- Zhou, 2022, Therapeutic target database update 2022: facilitating drug discovery with enriched comparative data of targeted agents, Nucleic Acids Res, 50, D1398, 10.1093/nar/gkab953 · DOI
- Yang, 2013, Genomics of drug sensitivity in cancer (GDSC): a resource for therapeutic biomarker discovery in cancer cells, Nucleic Acids Res, 41, D955, 10.1093/nar/gks1111 · DOI · Paper page
- Yang, 2003, Decay rates of human mRNAs: correlation with functional characteristics and sequence attributes, Genome Res, 13, 1863, 10.1101/gr.1272403 · DOI
- Liu, 2016, On the dependency of cellular protein levels on mRNA abundance, Cell, 165, 535, 10.1016/j.cell.2016.03.014 · DOI · Paper page
- Maier, 2009, Correlation of mRNA and protein in complex biological samples, FEBS Lett, 583, 3966, 10.1016/j.febslet.2009.10.036 · DOI · Paper page
- Sinha, 2019, The proteogenomic landscape of curable prostate cancer, Cancer Cell, 35, 414, 10.1016/j.ccell.2019.02.005 · DOI
- Gaballah, 2022, Small extracellular vesicle-associated miR-6068 promotes aggressive phenotypes of prostate cancer through miR-6068/HIC2/SIRT1 axis, Am J Cancer Res, 12, 4015
- Jia, 2022, Stromal FOXF2 suppresses prostate cancer progression and metastasis by enhancing antitumor immunity, Nat Commun, 13, 6828, 10.1038/s41467-022-34665-z · DOI
- Ivanovic, 2018, miR-29b enhances prostate cancer cell invasion independently of MMP-2 expression, Cancer Cell Int, 18, 18, 10.1186/s12935-018-0516-0 · DOI
- Engqvist, 2019, Immunohistochemical validation of COL3A1, GPR158 and PITHD1 as prognostic biomarkers in early-stage ovarian carcinomas, BMC Cancer, 19, 928, 10.1186/s12885-019-6084-4 · DOI
- Iglesias-Gato, 2018, The proteome of prostate cancer bone metastasis reveals heterogeneity with prognostic implications, Clin Cancer Res, 24, 5433, 10.1158/1078-0432.CCR-18-1229 · DOI · Paper page
- Iglesias-Gato, 2016, The proteome of primary prostate cancer, Eur Urol, 69, 942, 10.1016/j.eururo.2015.10.053 · DOI
- Ramazi, 2021, Posttranslational modifications in proteins: resources, tools and prediction methods, Database (Oxford), 2021, baab012, 10.1093/database/baab012 · DOI
- Conibear, 2020, Deciphering protein post-translational modifications using chemical biology tools, Nat Rev Chem, 4, 674, 10.1038/s41570-020-00223-8 · DOI
- Xia, 2022, A novel gene signature associated with "E2F Target" pathway for predicting the prognosis of prostate cancer, Front Mol Biosci, 9, 838654, 10.3389/fmolb.2022.838654 · DOI
- Ahmad, 2021, Metabolic reprogramming in prostate cancer, Br J Cancer, 125, 1185, 10.1038/s41416-021-01435-5 · DOI
- Moss Bendtsen, 2015, The role of mRNA and protein stability in the function of coupled positive and negative feedback systems in eukaryotic cells, Sci Rep, 5, 13910, 10.1038/srep13910 · DOI
- Magnusson, 2022, RNA-sequencing and mass-spectrometry proteomic time-series analysis of T-cell differentiation identified multiple splice variants models that predicted validated protein biomarkers in inflammatory diseases, Front Mol Biosci, 9, 916128, 10.3389/fmolb.2022.916128 · DOI
- Breschi, 2017, Comparative transcriptomics in human and mouse, Nat Rev Genet, 18, 425, 10.1038/nrg.2017.19 · DOI
Metadata
- Authors
- Sychev, Z. E., Day, A., Bergom, H. E., Larson, G., Ali, A., Ludwig, M., Boytim, E., Coleman, I., Corey, E., Plymate, S. R., Nelson, P. S., Hwang, J. H., & Drake, J. M.
- Affiliations
- University of Minnesota (US)
- Fred Hutch Cancer Center (US)
- University of Washington (US)
- United States Department of Veterans Affairs (US)
- Corresponding author
- Drake, Justin M.
- ORCID
- Venue
- Molecular Cancer Research
- Published
- 2024-02-12
- Volume
- 22
- Issue
- 5
- Pages
- 452-464
- ISSN
- 1541-7786 (ISSN-L)
- 1557-3125
- PMC
- PMC11063764
- OpenAlex
- W4391755053
- Cited by
- 13
- References
- 2
- Citations by year
- 2026: 3 · 2025: 4 · 2024: 6
- FWCI
- 4.33
- Type
- journal article
- Language
- en
- Open access
- hybrid
- doi.org
- Licence
- Locations
- Molecular Cancer Research (publishedVersion, cc-by-nc-nd)
- bioRxiv (Cold Spring Harbor Laboratory) (acceptedVersion, cc-by-nc-nd)
- PubMed Central (publishedVersion, cc-by-nc-nd)
- PubMed (publishedVersion)
- PubMed Central (submittedVersion, cc-by-nc-nd)
- Funders
- U.S. Department of Defense (E01 W81XWH-20-1-0070-P00002, W81XWH-18-1-0542)
- National Institutes of Health (P50 CA97186, CA163227, R01CA269801)
- Topics
- Life Sciences › Biochemistry, Genetics and Molecular Biology › Cancer Research › Prostate Cancer Treatment and Research
- Physical Sciences › Chemistry › Spectroscopy › Advanced Proteomics Techniques and Applications
- Health Sciences › Medicine › Urology › Prostate Cancer Diagnosis and Treatment
- Keywords
- castration-resistant prostate cancer, neuroendocrine prostate cancer, adenocarcinoma, patient-derived xenografts, proteome, phosphoproteome, androgen deprivation therapy resistance
About these checks
Registry, retraction, Cites and statistics results are computed, not judged, with one exception: a printed reference that no index lists is read once by a model before it counts as a citation error. Claims are extracted by a model and kept only when their quote appears verbatim in the text; each cited source is then checked, with a model’s help, for whether it says what the claim relies on. Those verdicts can be wrong — read the claim’s quote and the cited source before relying on one.
Statistics and arithmetic are recomputed, not judged.
Confidence bands are shown only for fields calibrated on our annotated test set. None is calibrated yet, so no band is shown.
What counts as a claim ›How we measure confidence ›How we check this ›
Are you an author, or do you see a problem with this page? Request a review
