

Reconstructing the ups and downs of primate brain evolution: implications for adaptive hypotheses and Homo floresiensis
Open accessThe DOI matches its Crossref record; 128 of the 128 references it cites were found in a registry or an index.
Abstract
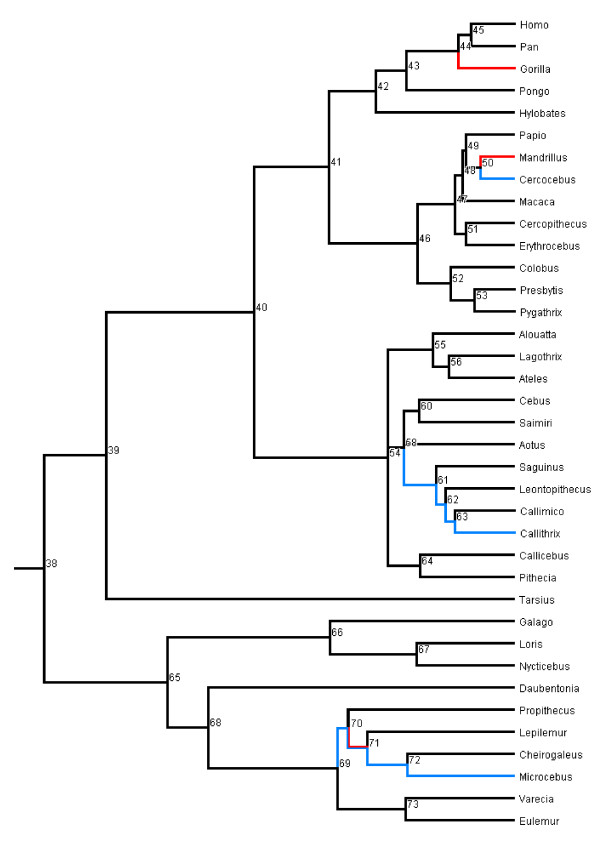
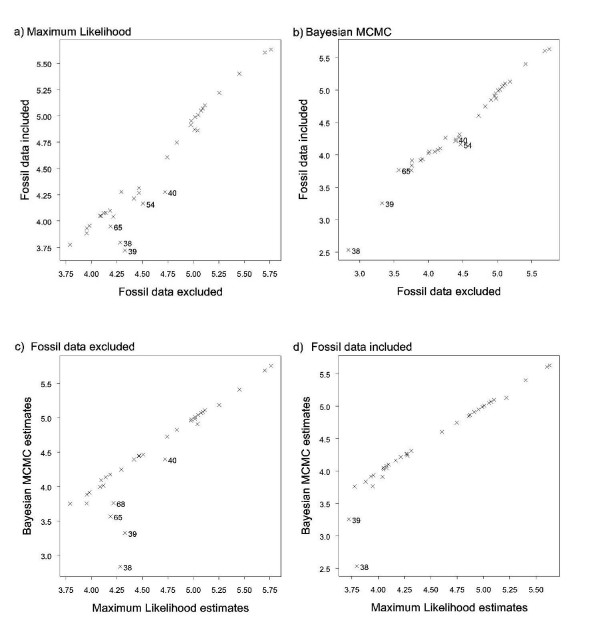
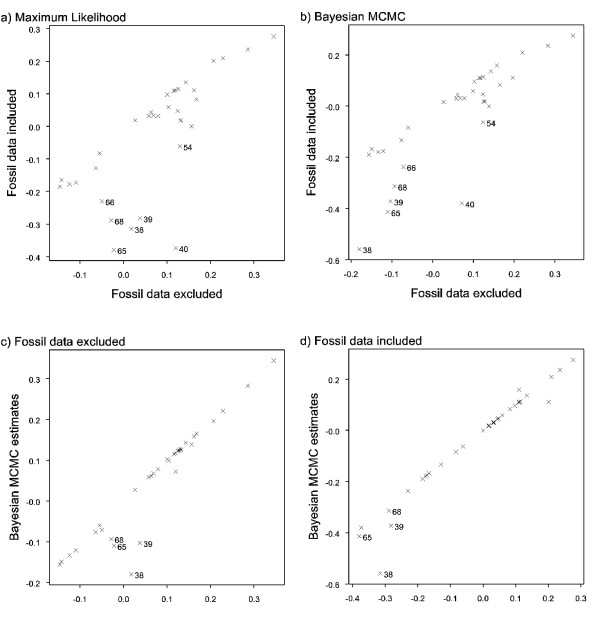
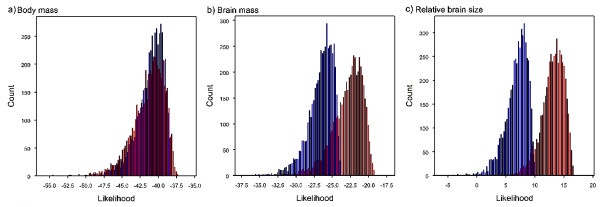
Background: Brain size is a key adaptive trait. It is often assumed that increasing brain size was a general evolutionary trend in primates, yet recent fossil discoveries have documented brain size decreases in some lineages, raising the question of how general a trend there was for brains to increase in mass over evolutionary time. We present the first systematic phylogenetic analysis designed to answer this question. Results: We performed ancestral state reconstructions of three traits (absolute brain mass, absolute body mass, relative brain mass) using 37 extant and 23 extinct primate species and three approaches to ancestral state reconstruction: parsimony, maximum likelihood and Bayesian Markov-chain Monte Carlo. Both absolute and relative brain mass generally increased over evolutionary time, but body mass did not. Nevertheless both absolute and relative brain mass decreased along several branches. Applying these results to the contentious case of Homo floresiensis, we find a number of scenarios under which the proposed evolution of Homo floresiensis'small brain appears to be consistent with patterns observed along other lineages, dependent on body mass and phylogenetic position. Conclusions: Our results confirm that brain expansion began early in primate evolution and show that increases occurred in all major clades. Only in terms of an increase in absolute mass does the human lineage appear particularly striking, with both the rate of proportional change in mass and relative brain size having episodes of greater expansion elsewhere on the primate phylogeny. However, decreases in brain mass also occurred along branches in all major clades, and we conclude that, while selection has acted to enlarge primate brains, in some lineages this trend has been reversed. Further analyses of the phylogenetic position of Homo floresiensis and better body mass estimates are required to confirm the plausibility of the evolution of its small brain mass. We find that for our dataset the Bayesian analysis for ancestral state reconstruction is least affected by inclusion of fossil data suggesting that this approach might be preferable for future studies on other taxa with a poor fossil record.
Overview
The claims and statistics of this paper haven’t been checked yet.
Free: it reads the open-access text and checks the first 5 claims that cite a source we can check. Create a free account to check every claim.
Integrity signals
Registry
Cites
Statistics
Figures


Verification
Claims the paper makes
The claims and statistics of this paper haven’t been checked yet.
Free: it reads the open-access text and checks the first 5 claims that cite a source we can check. Create a free account to check every claim.
Claims other papers make about this one
Each is checked against this paper’s own text: does it say what the citing paper says it does?
The source backs part of the claim, not all of it — or backs it for a different population, condition or comparison.
In the citing paper
“Whereas cetacean brain:body allometry is predominantly altered during three key periods (the origin of crown cetaceans, the origin of odontocetes, and the origin of mysticetes), primate brain and body mass evolved under contrasting selective regimes across longer periods of time resulting in a continuous allometric change and the expansion of relative brain size (Montgomery et al. 2010).”
From THE EVOLUTIONARY HISTORY OF CETACEAN BRAIN AND BODY SIZE: CETACEAN BRAIN EVOLUTION (2013) · cites this paper as Montgomery et al. 2010
Experimental — accuracy not yet measuredThe cited source says what the claim attributes to it.
In the citing paper
“In primates, the evolution of brain size (both in terms of absolute size and relative to body size) shows complex patterns of change involving both increases and decreases along different branches of the primate phylogeny [6,7].”
From Brain reorganization, not relative brain size, primarily characterizes anthropoid brain evolution (2013) · cites this paper as [6]
The cited source says what the claim attributes to it.
In the citing paper
“Including data from extinct taxa may improve such analyses (Finarelli and Flynn 2006;Montgomery et al. 2010;Slater et al. 2012).”
From THE EVOLUTIONARY HISTORY OF CETACEAN BRAIN AND BODY SIZE: CETACEAN BRAIN EVOLUTION (2013) · cites this paper as Montgomery et al. 2010
The cited source says what the claim attributes to it.
In the citing paper
“Primates are one order that shows a strong trend for directional increases in relative brain size (Montgomery et al. 2010).”
From THE EVOLUTIONARY HISTORY OF CETACEAN BRAIN AND BODY SIZE: CETACEAN BRAIN EVOLUTION (2013) · cites this paper as Montgomery et al. 2010
The cited source says what the claim attributes to it.
In the citing paper
“Increases in relative brain size are almost ubiquitous across the primate tree and are produced by directional evolution of increased brain mass in a background of body mass evolution that shows no significant trend to increase through time (Montgomery et al. 2010).”
From THE EVOLUTIONARY HISTORY OF CETACEAN BRAIN AND BODY SIZE: CETACEAN BRAIN EVOLUTION (2013) · cites this paper as Montgomery et al. 2010
2 more claims about this paper
Create a free account to see every claim other papers make about this one.
Self-check
Percentages, sums and reported differences re-computed from the paper’s own numbers.
The self-check needs the paper’s full text.
Citations
Cites
Phylogenies and the Comparative Method
Felsenstein, J. (1985) · The American Naturalist · doi:10.1086/284325 · Cited by 9,793 · cited 1×
“It is important to incorporate both topology and branch length information during reconstruction analyses as species are part of a hierarchically structured phylogeny, therefore not statistically independent, and differences in time since divergence from the common ancestors determines differential potential for evolu…”
BackgroundMarkov Chain Monte Carlo in Practice
(1995) · Chapman & Hall/CRC eBooks · doi:10.1201/b14835 · Cited by 7,757
(2009) · Cited by 6,571
The Ecological Implications of Body Size
Peters, R. H. (1983) · Cambridge University Press eBooks · doi:10.1017/cbo9780511608551 · Cited by 5,649 · cited 2×
“Finally, our analyses add to the growing number of studies that conclude that the evolution of the human brain size has not been anomalous when compared to general primate brain evolution [59,61,91,62-94].”
BackgroundInferring the historical patterns of biological evolution
Pagel, M. (1999) · Nature · doi:10.1038/44766 · Cited by 5,200 · cited 24×
“BayesTraits first identifies the best fitting evolutionary model (see below) to the species data, and then uses such model to infer unknown ancestral states at internal nodes along the tree.”
BackgroundMethodInfluentialThe comparative method in evolutionary biology
(1992) · Choice Reviews Online · doi:10.5860/choice.29-5104 · Cited by 4,931 · cited 1×
“They enable historical evolutionary processes, and the function and evolution of specific traits, to be inferred from patterns of diversity in extant species [1-3].”
BackgroundThe Comparative Method in Evolutionary Biology
Harvey, P. H., & Pagel, M. D. (1991) · doi:10.1093/oso/9780198546412.001.0001 · Cited by 4,337
Scaling: Why is Animal Size so Important?
Schmidt-Nielsen, K. (1984) · doi:10.1017/cbo9781139167826 · Cited by 2,677
Scaling Why is animal size so important?
Schmidt‐Nielsen, K. (1984) · Cited by 2,654
Kass, R. E., & Raftery, A. E. (1995) · Journal of the American Statistical Association · doi:10.2307/2291091 · Cited by 2,312
Research works printed but not linked: 1
- Smuts BB, Cheney DL, Seyfarth RM, Wrangham RW, Struhsaker TT: Primate Societies. 1987, University of Chicago Press
Cited by
The evolution of self-control.
MacLean, E. L., Hare, B., Nunn, C. L., Addessi, E., Amici, F., Anderson, R. C., Aureli, F., Baker, J. M., Bania, A. E., Barnard, A. M., et al. (2014) · Proceedings of the National Academy of Sciences · doi:10.1073/pnas.1323533111 · Cited by 819
“increased over time in primates, whereas body mass has not (187).”
Gomes, N. M. V., Ryder, O. A., Houck, M. L., Charter, S. J., Walker, W., Forsyth, N. R., Austad, S. N., Venditti, C., Pagel, M., Shay, J. W., et al. (2011) · Aging Cell · doi:10.1111/j.1474-9726.2011.00718.x · Cited by 464
“It has been shown to outperform other methods of ancestral state reconstruction as the model of evolution estimated across the whole tree is used to infer the ancestral states (Montgomery et al., 2010).”
Primate brain size is predicted by diet but not sociality
DeCasien, A. R., Williams, S. A., & Higham, J. P. (2017) · Nature Ecology & Evolution · doi:10.1038/s41559-017-0112 · Cited by 475
Rapid evolution of the cerebellum in humans and other great apes
Barton, R. A., & Venditti, C. (2014) · Current Biology · doi:10.1016/j.cub.2014.08.056 · Cited by 291
“We us BayesTraits following the protocol outlined in Organ et al [34] to impute the ancestral sizes as this approach has been show to outperform other methods for reconstruction ancestral states for continuously varying data [35].”
Self-citationWhy are there so many explanations for primate brain evolution?
Dunbar, R. I. M., & Shultz, S. (2017) · Philosophical Transactions of the Royal Society B: Biological Sciences · doi:10.1098/rstb.2016.0244 · Cited by 261
Metadata
- Authors
- Montgomery, S. H., Capellini, I., Barton, R. A., & Mundy, N. I.
- Affiliations
- University of Cambridge (GB)
- Durham University (GB)
- Corresponding author
- Mundy, Nicholas I
- Venue
- BMC Biology
- Published
- 2010-01-27
- Volume
- 8
- Issue
- 1
- Pages
- 9-9
- ISSN
- 1741-7007 (ISSN-L)
- PMC
- PMC2825212
- OpenAlex
- W2103126314
- Cited by
- 98
- References
- 126
- Citations by year
- 2026: 3 · 2025: 5 · 2024: 2 · 2023: 3 · 2022: 4 · 2021: 8 · 2020: 3 · 2019: 8 · 2018: 3 · 2017: 6 · 2016: 9 · 2015: 3 · 2014: 7 · 2013: 15 · 2012: 13
- FWCI
- 14.68
- Type
- journal article
- Language
- en
- Open access
- gold
- doi.org
- Licence
- cc-by
- Locations
- BMC Biology (publishedVersion, cc-by)
- PubMed Central (publishedVersion, cc-by)
- PubMed (publishedVersion)
- Bristol Research (University of Bristol) (publishedVersion)
- Durham Research Online (Durham University) (acceptedVersion, other-oa)
- Durham Research Online (Durham University) (submittedVersion, cc-by)
- Repository@Hull (Worktribe) (University of Hull) (submittedVersion, cc-by)
- DOAJ (DOAJ: Directory of Open Access Journals) (submittedVersion)
- UCL Discovery (University College London) (submittedVersion)
- Research Portal (Queen's University Belfast) (submittedVersion)
- Apollo (University of Cambridge) (submittedVersion, cc-by)
- Funders
- Leverhulme Trust
- Biotechnology and Biological Sciences Research Council (BB/E014593/1)
- Natural Environment Research Council
- Topics
- Life Sciences › Agricultural and Biological Sciences › Ecology, Evolution, Behavior and Systematics › Primate Behavior and Ecology
- Physical Sciences › Earth and Planetary Sciences › Paleontology › Evolution and Paleontology Studies
- Social Sciences › Anthropology › Pleistocene-Era Hominins and Archaeology
- Keywords
- primate brain evolution, brain size, body mass, ancestral state reconstruction, Homo floresiensis, brain size reduction, phylogenetic analysis, human evolution, brain expansion, fossil primates
- MeSH terms
- Animals, Bayes Theorem, Brain, Biological Evolution, Humans, Phylogeny, Primates, Hominidae, Likelihood Functions
About these checks
Registry, retraction, Cites and statistics results are computed, not judged, with one exception: a printed reference that no index lists is read once by a model before it counts as a citation error. Claims are extracted by a model and kept only when their quote appears verbatim in the text; each cited source is then checked, with a model’s help, for whether it says what the claim relies on. Those verdicts can be wrong — read the claim’s quote and the cited source before relying on one.
Statistics and arithmetic are recomputed, not judged.
Confidence bands are shown only for fields calibrated on our annotated test set. None is calibrated yet, so no band is shown.
What counts as a claim ›How we measure confidence ›How we check this ›
Are you an author, or do you see a problem with this page? Request a review
How to cite
Cite CoChat for the checks on this page, and the paper for its own findings.
- This page
- CoChat. (2026). Citation check: Reconstructing the ups and downs of primate brain evolution: implications for adaptive hypotheses and Homo floresiensis. https://app.cochat.ai/papers/10.1186/1741-7007-8-9
- The paper
- Montgomery, S. H., Capellini, I., Barton, R. A., & Mundy, N. I. (2010). Reconstructing the ups and downs of primate brain evolution: implications for adaptive hypotheses and Homo floresiensis. BMC Biology. https://doi.org/10.1186/1741-7007-8-9
Data sources
Bibliographic data: Semantic Scholar, OpenAlex, Crossref.
Contains information from the Semantic Scholar Academic Graph Datasets, made available under the ODC Attribution License (ODC-BY 1.0).
Semantic Scholar’s data is described in: Kinney, R., et al. (2023). The Semantic Scholar Open Data Platform. arXiv:2301.10140.
