

The DOI matches its Crossref record; 52 of the 53 references it cites were found in a registry or an index.
MONKEY: identifying conserved transcription-factor binding sites in multiple alignments using a binding site-specific evolutionary model
Open accessAbstract
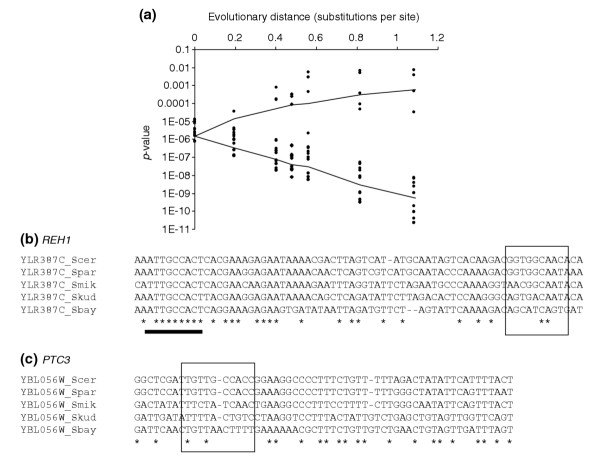
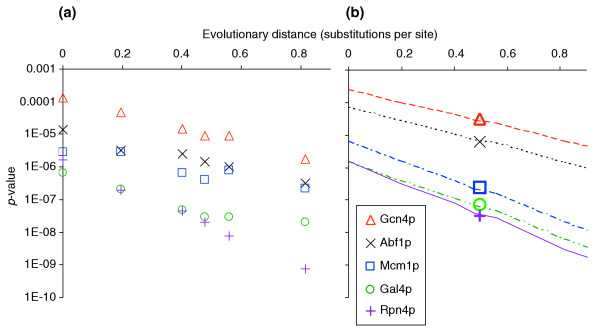
We introduce a method (MONKEY) to identify conserved transcription-factor binding sites in multispecies alignments. MONKEY employs probabilistic models of factor specificity and binding-site evolution, on which basis we compute the likelihood that putative sites are conserved and assign statistical significance to each hit. Using genomes from the genus Saccharomyces , we illustrate how the significance of real sites increases with evolutionary distance and explore the relationship between conservation and function.
Overview
The claims and statistics of this paper haven’t been checked yet.
Run the check — free, no account needed. It reads the open-access text and checks the sources it cites.
Integrity signals
Registry
Cites
Statistics
Figures
Verification
Claims the paper makes
The claims and statistics of this paper haven’t been checked yet.
Run the check — free, no account needed. It reads the open-access text and checks the sources it cites.
Claims other papers make about this one
Each is checked against this paper’s own text: does it say what the citing paper says it does?
In the citing paper
“there is an inverse relationship between the degeneracy of columns within an RNAcompete motif and the evolutionary conservation of the matching bases within the predicted binding site in transcripts”
From A compendium of RNA-binding motifs for decoding gene regulation (2013) · cites this paper as [23]
Self-check
Percentages, sums and reported differences re-computed from the paper’s own numbers.
The self-check needs the paper’s full text.
Citations
Cites
Thompson, J. D., Higgins, D. G., & Gibson, T. J. (1994) · Nucleic Acids Research · doi:10.1093/nar/22.22.4673 · Cited by 64,617
Cluster analysis and display of genome-wide expression patterns
Eisen, M. B., Spellman, P. T., Brown, P. O., & Botstein, D. (1998) · Proceedings of the National Academy of Sciences · doi:10.1073/pnas.95.25.14863 · Cited by 16,184
Self-citationEvolutionary trees from DNA sequences: A maximum likelihood approach.
Felsenstein, J. (1981) · Journal of Molecular Evolution · doi:10.1007/bf01734359 · Cited by 14,571
Evolution of Protein Molecules
JUKES, T. H., & CANTOR, C. R. (1969) · Mammalian Protein Metabolism · doi:10.1016/b978-1-4832-3211-9.50009-7 · Cited by 11,032
Dating of the human–ape splitting by a molecular clock of mitochondrial DNA.
Hasegawa, M., Kishino, H., & Yano, T.-A. (1985) · Journal of Molecular Evolution · doi:10.1007/bf02101694 · Cited by 8,687
PAML: a program package for phylogenetic analysis by maximum likelihood
Yang, Z. (1997) · Computer applications in the biosciences · doi:10.1093/bioinformatics/13.5.555 · Cited by 5,377
Genomic Expression Programs in the Response of Yeast Cells to Environmental Changes
Gasch, A. P., Spellman, P. T., Kao, C. M., Carmel-Harel, O., Eisen, M. B., Storz, G., Botstein, D., & Brown, P. O. (2000) · Molecular Biology of the Cell · doi:10.1091/mbc.11.12.4241 · Cited by 4,815
Self-citationIntegrated Genomic and Proteomic Analyses of a Systematically Perturbed Metabolic Network
Ideker, T., Thorsson, V., Ranish, J. A., Christmas, R., Buhler, J., Eng, J. K., Bumgarner, R., Goodlett, D. R., Aebersold, R., & Hood, L. (2001) · Science · doi:10.1126/science.292.5518.929 · Cited by 2,050
Genome-Wide Location and Function of DNA Binding Proteins
Ren, B., Robert, F., Wyrick, J. J., Aparicio, O. M., Jennings, E. G., Simon, I., Zeitlinger, J., Schreiber, J., Hannett, N. M., Kanin, E. I., et al. (2000) · Science · doi:10.1126/science.290.5500.2306 · Cited by 1,768
Sequencing and comparison of yeast species to identify genes and regulatory elements
Kellis, M., Patterson, N. J., Endrizzi, M. G., Birren, B. W., & Lander, E. S. (2003) · Nature · doi:10.1038/nature01644 · Cited by 1,751
Cited by
Sorted by citations
Detection of nonneutral substitution rates on mammalian phylogenies
Pollard, K. S., Hubisz, M. J., Rosenbloom, K. R., & Siepel, A. (2010) · Genome Research · doi:10.1101/gr.097857.109 · Cited by 2,353
A compendium of RNA-binding motifs for decoding gene regulation
Ray, D., Kazan, H., Cook, K. B., Weirauch, M. T., Najafabadi, H. S., Li, X., Gueroussov, S., Albu, M., Zheng, H., Yang, A., et al. (2013) · Nature · doi:10.1038/nature12311 · Cited by 1,480
PHAST and RPHAST: phylogenetic analysis with space/time models
Hubisz, M. J., Pollard, K. S., & Siepel, A. (2011) · Briefings in Bioinformatics · doi:10.1093/bib/bbq072 · Cited by 490
Transcription Factors Bind Thousands of Active and Inactive Regions in the Drosophila Blastoderm
Li, X., MacArthur, S., Bourgon, R., Nix, D. A., Pollard, D. A., Iyer, V. N., Hechmer, A., Simirenko, L., Stapleton, M., Hendriks, C. L. L., et al. (2008) · PLoS Biology · doi:10.1371/journal.pbio.0060027 · Cited by 485
Self-citationSystematic discovery and characterization of regulatory motifs in ENCODE TF binding experiments
Kheradpour, P., & Kellis, M. (2013) · Nucleic Acids Research · doi:10.1093/nar/gkt1249 · Cited by 447
The FANTOM Consortium, & Riken Omics Science Center (2009) · Nature Genetics · doi:10.1038/ng.375 · Cited by 427
Robustness can evolve gradually in complex regulatory gene networks with varying topology
Ciliberti, S., Martin, O. C., & Wagner, A. (2007) · PLoS Computational Biology · doi:10.1371/journal.pcbi.0030015 · Cited by 390
Kheradpour, P., Ernst, J., Melnikov, A., Rogov, P., Wang, L., Zhang, X., Alston, J., Mikkelsen, T. S., & Kellis, M. (2013) · Genome Research · doi:10.1101/gr.144899.112 · Cited by 315
Tata, P., Wu, W., Miles, S., Noble, W. S., & Breeden, L. L. (2006) · Genes & Development · doi:10.1101/gad.1450606 · Cited by 282
Large-Scale Turnover of Functional Transcription Factor Binding Sites in Drosophila
Moses, A. M., Pollard, D. A., Nix, D. A., Iyer, V. N., Li, X., Biggin, M. D., & Eisen, M. B. (2006) · PLoS Computational Biology · doi:10.1371/journal.pcbi.0020130 · Cited by 260
Self-citationA Catalog of Neutral and Deleterious Polymorphism in Yeast
Doniger, S. W., Kim, H. S., Swain-Lenz, D., Corcuera, D., Williams, M., Yang, S., & Fay, J. C. (2008) · PLoS Genetics · doi:10.1371/journal.pgen.1000183 · Cited by 247
Assigning roles to DNA regulatory motifs using comparative genomics
Buske, F. A., Mikael Bodén, A., Bauer, D. C., & Bailey, T. L. (2010) · Bioinformatics · doi:10.1093/bioinformatics/btq049 · Cited by 224
Natural selection on gene expression
Gilad, Y., Oshlack, A., & Rifkin, S. A. (2006) · Trends in Genetics · doi:10.1016/j.tig.2006.06.002 · Cited by 218
Modeling Evolution Using the Probability of Fixation: History and Implications
McCandlish, D. M., & Stoltzfus, A. (2014) · The Quarterly Review of Biology · doi:10.1086/677571 · Cited by 189
Practical Strategies for Discovering Regulatory DNA Sequence Motifs
MacIsaac, K. D., & Fraenkel, E. (2006) · PLoS Computational Biology · doi:10.1371/journal.pcbi.0020036 · Cited by 167
Reliable prediction of regulator targets using 12 Drosophila genomesPreprint
Kheradpour, P., Stark, A., Roy, S., & Kellis, M. (2007) · Genome Research · doi:10.1101/gr.7090407 · Cited by 163
SwissRegulon, a database of genome-wide annotations of regulatory sites: recent updates
Pachkov, M. V., Balwierz, P. J., Arnold, P., Ozonov, E. A., & van Nimwegen, E. (2012) · Nucleic Acids Research · doi:10.1093/nar/gks1145 · Cited by 153
Frequent Gain and Loss of Functional Transcription Factor Binding Sites
Doniger, S. W., & Fay, J. C. (2005) · PLoS Computational Biology · doi:10.1371/journal.pcbi.0030099 · Cited by 152
Piper, M., Barry, G., Hawkins, J., Mason, S., Lindwall, C., Little, E. B., Sarkar, A., Smith, A. G., Moldrich, R. X., Boyle, G. M., et al. (2010) · Journal of Neuroscience · doi:10.1523/jneurosci.6167-09.2010 · Cited by 147
The Cis-regulatory Logic of the Mammalian Photoreceptor Transcriptional Network
Hsiau, T. H.-C., Diaconu, C. I., Myers, C. A., Lee, J., Cepko, C. L., & Corbo, J. C. (2007) · PLoS ONE · doi:10.1371/journal.pone.0000643 · Cited by 142
MotifMap: a human genome-wide map of candidate regulatory motif sites
Xie, X. S., Rigor, P., & Baldi, P. (2008) · Bioinformatics · doi:10.1093/bioinformatics/btn605 · Cited by 139
From biophysics to evolutionary genetics: statistical aspects of gene regulation
Lässig, M. (2007) · BMC Bioinformatics · doi:10.1186/1471-2105-8-s6-s7 · Cited by 131
Analysis of Time-Series Gene Expression Data: Methods, Challenges, and Opportunities
Androulakis, I. P., Yang, E., & Almon, R. R. (2007) · Annual Review of Biomedical Engineering · doi:10.1146/annurev.bioeng.9.060906.151904 · Cited by 133
Evolutionary population genetics of promoters: Predicting binding sites and functional phylogenies
Mustonen, V., & Lässig, M. (2005) · Proceedings of the National Academy of Sciences · doi:10.1073/pnas.0505537102 · Cited by 120
Genome-wide identification of direct targets of the Drosophila retinal determination protein EyelessPreprint
Ostrin, E. J., Li, Y., Hoffman, K. L., Liu, J., Wang, K., Zhang, L., Mardon, G., & Chen, R. (2006) · Genome Research · doi:10.1101/gr.4673006 · Cited by 107
Systematic identification of mammalian regulatory motifs' target genes and functions
Warner, J. B., Philippakis, A., Jaeger, S. A., He, F. S., Lin, J. Y., & Bulyk, M. L. (2008) · Nature Methods · doi:10.1038/nmeth.1188 · Cited by 99
Arnold, P., Erb, I., Pachkov, M. V., Molina, N., & van Nimwegen, E. (2011) · Bioinformatics · doi:10.1093/bioinformatics/btr695 · Cited by 90
Eacker, S. M., Shima, J. E., Connolly, C. M., Sharma, M., Holdcraft, R. W., Griswold, M. D., & Braun, R. E. (2007) · Molecular Endocrinology · doi:10.1210/me.2006-0113 · Cited by 80
Revealing Posttranscriptional Regulatory Elements Through Network-Level Conservation
Chan, C. S., Elemento, O., & Tavazoie, S. (2005) · PLoS Computational Biology · doi:10.1371/journal.pcbi.0010069 · Cited by 77
Multiple whole-genome alignments without a reference organismPreprint
Dubchak, I. L., Poliakov, A., Kislyuk, A. O., & Brudno, M. (2009) · Genome Research · doi:10.1101/gr.081778.108 · Cited by 77
Assessing Computational Methods of Cis-Regulatory Module Prediction
Su, J., Teichmann, S. A., & Down, T. A. (2010) · PLoS Computational Biology · doi:10.1371/journal.pcbi.1001020 · Cited by 75
Evolution of Regulatory Sequences in 12 Drosophila Species
Kim, J., He, X., & Sinha, S. (2009) · PLoS Genetics · doi:10.1371/journal.pgen.1000330 · Cited by 72
Large Scale Discovery of Promoter Motifs in Drosophila melanogaster
Down, T. A., Bergman, C., Su, J., & Hubbard, T. (2005) · PLoS Computational Biology · doi:10.1371/journal.pcbi.0030007 · Cited by 71
Whitington, T., Perkins, A. C., & Bailey, T. L. (2008) · Nucleic Acids Research · doi:10.1093/nar/gkn866 · Cited by 70
Evolution of cis-regulatory sequence and function in Diptera
Wittkopp, P. J. (2006) · Heredity · doi:10.1038/sj.hdy.6800869 · Cited by 64
Philippakis, A., Busser, B. W., Gisselbrecht, S. S., He, F. S., Estrada, B., Michelson, A. M., & Bulyk, M. L. (2006) · PLoS Computational Biology · doi:10.1371/journal.pcbi.0020053 · Cited by 64
Computational methods for the detection of cis-regulatory modules
Van Loo, P., & Marynen, P. (2009) · Briefings in Bioinformatics · doi:10.1093/bib/bbp025 · Cited by 62
Vavouri, T., & Elgar, G. (2005) · Current Opinion in Genetics & Development · doi:10.1016/j.gde.2005.05.002 · Cited by 61
Ward, L. D., & Bussemaker, H. J. (2008) · Bioinformatics · doi:10.1093/bioinformatics/btn154 · Cited by 61
Identification of molecular compartments and genetic circuitry in the developing mammalian kidney
Yu, J., Valerius, M. T., Duah, M., Staser, K. W., Hansard, J. K., Guo, J., McMahon, J. A., Vaughan, J. E., Faria, D., Georgas, K. M., et al. (2012) · Development · doi:10.1242/dev.074005 · Cited by 59
Universal patterns of purifying selection at noncoding positions in bacteriaPreprint
Molina, N., & van Nimwegen, E. (2007) · Genome Research · doi:10.1101/gr.6759507 · Cited by 57
XRate: a fast prototyping, training and annotation tool for phylo-grammars
Klosterman, P. S., Uzilov, A. V., Bendaña, Y. R., Bradley, R. K., Chao, S., Kosiol, C., Goldman, N., & Holmes, I. H. (2006) · BMC Bioinformatics · doi:10.1186/1471-2105-7-428 · Cited by 56
Francke, C., Kerkhoven, R., Wels, M., & Siezen, R. J. (2008) · BMC Genomics · doi:10.1186/1471-2164-9-145 · Cited by 51
Finding regulatory elements and regulatory motifs: a general probabilistic framework
van Nimwegen, E. (2007) · BMC Bioinformatics · doi:10.1186/1471-2105-8-s6-s4 · Cited by 52
Pollard, D. A., Moses, A. M., Iyer, V. N., & Eisen, M. B. (2006) · BMC Bioinformatics · doi:10.1186/1471-2105-7-376 · Cited by 51
Self-citationCorticosteroid-regulated genes in rat kidney: mining time series array data
Almon, R. R., Lai, W., DuBois, D. C., & Jusko, W. J. (2005) · American Journal of Physiology-Endocrinology and Metabolism · doi:10.1152/ajpendo.00196.2005 · Cited by 49
Freeling, M., Rapaka, L., Lyons, E. H., Pedersen, B. S., & Thomas, B. C. (2007) · The Plant Cell · doi:10.1105/tpc.107.050419 · Cited by 47
Functional Evolution of cis-Regulatory Modules at a Homeotic Gene in Drosophila
Ho, M. C. W., Johnsen, H., Goetz, S. E., Schiller, B. J., Bae, E., Tran, D. A., Shur, A., Allen, J. M., Rau, C., Bender, W. W., et al. (2009) · PLoS Genetics · doi:10.1371/journal.pgen.1000709 · Cited by 48
New technologies, new findings, and new concepts in the study of vertebrate cis‐regulatory sequences
Gómez-Skármeta, J. L., Lenhard, B., & Becker, T. S. (2006) · Developmental Dynamics · doi:10.1002/dvdy.20659 · Cited by 45
WeederH: an algorithm for finding conserved regulatory motifs and regions in homologous sequences
Pavesi, G., Zambelli, F., & Pesole, G. (2007) · BMC Bioinformatics · doi:10.1186/1471-2105-8-46 · Cited by 45
Alignment and Prediction of cis-Regulatory Modules Based on a Probabilistic Model of Evolution
He, X., Ling, X., & Sinha, S. (2009) · PLoS Computational Biology · doi:10.1371/journal.pcbi.1000299 · Cited by 46
TRADE-OFFS IN DETECTING EVOLUTIONARILY CONSTRAINED SEQUENCE BY COMPARATIVE GENOMICS
Stone, E. A., Cooper, G. M., & Sidow, A. (2005) · Annual Review of Genomics and Human Genetics · doi:10.1146/annurev.genom.6.080604.162146 · Cited by 45
Computation and Analysis of Genomic Multi-Sequence Alignments
Blanchette, M. (2007) · Annual Review of Genomics and Human Genetics · doi:10.1146/annurev.genom.8.080706.092300 · Cited by 43
Exact Calculation of Distributions on Integers, with Application to Sequence Alignment
Newberg, L. A., & Lawrence, C. E. (2009) · Journal of Computational Biology · doi:10.1089/cmb.2008.0137 · Cited by 41
PhyloScan: identification of transcription factor binding sites using cross-species evidence
Carmack, C. S., McCue, L. A., Newberg, L. A., & Lawrence, C. E. (2007) · Algorithms for Molecular Biology · doi:10.1186/1748-7188-2-1 · Cited by 38
Evolution of the Vertebrate Gene Regulatory Network Controlled by the Transcriptional Repressor REST
Johnson, R., Samuel, J., Ng, C. K. L., Jauch, R., Stanton, L. W., & Wood, I. C. (2009) · Molecular Biology and Evolution · doi:10.1093/molbev/msp058 · Cited by 37
Deryckere, A., Styfhals, R., Elagoz, A. M., Maes, G. E., & Seuntjens, E. (2021) · eLife · doi:10.7554/elife.69161 · Cited by 37
Mapping Dmef2-binding regulatory modules by using a ChIP-enriched in silico targets approach
Junion, G., Jagla, T., Duplant, S., Tapin, R., Ponte, J. P. D., & Jagla, K. (2005) · Proceedings of the National Academy of Sciences · doi:10.1073/pnas.0507030102 · Cited by 36
Accurate Reconstruction of Insertion-Deletion Histories by Statistical Phylogenetics
Westesson, O., Lunter, G. A., Paten, B., & Holmes, I. H. (2012) · PLoS ONE · doi:10.1371/journal.pone.0034572 · Cited by 35
Evolutionary potential of transcription factors for gene regulatory rewiring
Igler, C., Lagator, M., Tkačik, G., Bollback, J. P., & Guet, C. C. (2018) · Nature Ecology & Evolution · doi:10.1038/s41559-018-0651-y · Cited by 35
Santolini, M., Mora, T., & Hakim, V. (2014) · PLoS ONE · doi:10.1371/journal.pone.0099015 · Cited by 38
Fay, J. C., & Benavides, J. A. (2005) · Genetics · doi:10.1534/genetics.105.042283 · Cited by 34
Lawrie, D. S., Petrov, D. A., & Messer, P. W. (2011) · Genome Biology and Evolution · doi:10.1093/gbe/evr032 · Cited by 31
Gertz, J., Riles, L., Turnbaugh, P. J., Ho, S.-W., & Cohen, B. A. (2005) · Genome Research · doi:10.1101/gr.3859605 · Cited by 29
Recent Advances in the Computational Discovery of Transcription Factor Binding Sites
Nguyen, T. T., & Androulakis, I. P. (2009) · Algorithms · doi:10.3390/a2010582 · Cited by 28
Simulations of Enhancer Evolution Provide Mechanistic Insights into Gene Regulation
Duque, T. S. P. C., Samee, M. A. H., Kazemian, M., Pham, H., Brodsky, M. H., & Sinha, S. (2013) · Molecular Biology and Evolution · doi:10.1093/molbev/mst170 · Cited by 27
An effective model for natural selection in promotersPreprint
Hoffman, M. M., & Birney, E. (2010) · Genome Research · doi:10.1101/gr.096719.109 · Cited by 27
Use of ChIP-Seq data for the design of a multiple promoter-alignment method
Erb, I., González‐Vallinas, J., Bussotti, G., Blanco, E., Eyras, E., & Notredame, C. (2012) · Nucleic Acids Research · doi:10.1093/nar/gkr1292 · Cited by 25
Rouault, H., Mazouni, K., Couturier, L., Hakim, V., & Schweisguth, F. (2010) · Proceedings of the National Academy of Sciences · doi:10.1073/pnas.1002876107 · Cited by 26
Reddy, T. E., DeLisi, C., & Shakhnovich, B. E. (2007) · PLoS Computational Biology · doi:10.1371/journal.pcbi.0030090 · Cited by 23
Regulation of nucleosome stability as a mediator of chromatin function
Giresi, P. G., Gupta, M., & Lieb, J. D. (2006) · Current Opinion in Genetics & Development · doi:10.1016/j.gde.2006.02.003 · Cited by 23
Duque, T. S. P. C., & Sinha, S. (2015) · Genome Biology and Evolution · doi:10.1093/gbe/evv080 · Cited by 21
Tools for simulating evolution of aligned genomic regions with integrated parameter estimation
Varadarajan, A. V., Bradley, R. K., & Holmes, I. H. (2008) · Genome biology · doi:10.1186/gb-2008-9-10-r147 · Cited by 22
Germline Fitness-Based Scoring of Cancer Mutations
Fischer, A., Greenman, C., & Mustonen, V. (2011) · Genetics · doi:10.1534/genetics.111.127480 · Cited by 20
Fan, S., Fang, F., Zhang, X., & Zhang, M. Q. (2007) · PLoS ONE · doi:10.1371/journal.pone.0001184 · Cited by 20
Formation of Regulatory Modules by Local Sequence Duplication
Nourmohammad, A., & Lässig, M. (2011) · PLoS Computational Biology · doi:10.1371/journal.pcbi.1002167 · Cited by 22
Genomic Evolution of the Proteasome System Among Hemiascomycetous Yeasts
Mannhaupt, G., & Feldmann, H. (2007) · Journal of Molecular Evolution · doi:10.1007/s00239-007-9031-y · Cited by 19
Assessing phylogenetic motif models for predicting transcription factor binding sites
Hawkins, J., Grant, C. E., Noble, W. S., & Bailey, T. L. (2009) · Bioinformatics · doi:10.1093/bioinformatics/btp201 · Cited by 19
CSMET: Comparative Genomic Motif Detection via Multi-Resolution Phylogenetic Shadowing
Ray, P. R., Shringarpure, S., Kolar, M., & Xing, E. P. (2008) · PLoS Computational Biology · doi:10.1371/journal.pcbi.1000090 · Cited by 19
Hadzhiev, Y., Lang, M., Ertzer, R., Meyer, A., Strähle, U., & Müller, F. (2007) · Genome biology · doi:10.1186/gb-2007-8-6-r106 · Cited by 20
Discriminating between HuR and TTP binding sites using the k-spectrum kernel method
Bhandare, S., Goldberg, D. S., & Dowell, R. D. (2017) · PLoS ONE · doi:10.1371/journal.pone.0174052 · Cited by 17
A new systematic computational approach to predicting target genes of transcription factors
Dai, X., He, J., & Zhao, X. (2007) · Nucleic Acids Research · doi:10.1093/nar/gkm454 · Cited by 17
Salmonid DNA Microarrays and Other Tools for Functional Genomics Research
Rise, M. L., von Schalburg, K. R., Cooper, G. A., & Koop, B. F. (2007) · doi:10.1002/9780470277560.ch22 · Cited by 17
Cell-type specificity of ChIP-predicted transcription factor binding sites
Håndstad, T., Rye, M. B., Močnik, R., Drabløs, F., & Sætrom, P. (2012) · BMC Genomics · doi:10.1186/1471-2164-13-372 · Cited by 16
A Systems Biology Approach to Transcription Factor Binding Site Prediction
Zhou, X., Sumazin, P., Rajbhandari, P., & Califano, A. (2010) · PLoS ONE · doi:10.1371/journal.pone.0009878 · Cited by 14
Liu, X., Weidle, K., Schröck, K., Tönjes, A., Schleinitz, D., Breitfeld, J., Stümvoll, M., Böttcher, Y., Schöneberg, T., & Kovacs, P. L. (2015) · PLoS ONE · doi:10.1371/journal.pone.0117093 · Cited by 13
Finding cis-regulatory modules in Drosophila using phylogenetic hidden Markov models
Wong, W. S. W., & Nielsen, R. (2007) · Bioinformatics · doi:10.1093/bioinformatics/btm299 · Cited by 12
Imogene: identification of motifs and cis-regulatory modules underlying gene co-regulation
Rouault, H., Santolini, M., Schweisguth, F., & Hakim, V. (2014) · Nucleic Acids Research · doi:10.1093/nar/gku209 · Cited by 11
Impact of DNA-binding position variants on yeast gene expression
Swamy, K. B. S., Cho, C.-Y., Chiang, S., Tsai, Z. T., & Tsai, H. (2009) · Nucleic Acids Research · doi:10.1093/nar/gkp743 · Cited by 11
Phylogenetic Footprinting to Find Functional DNA Elements
Ganley, A. R. D., & Kobayashi, T. (2007) · Methods in molecular biology · doi:10.1007/978-1-59745-514-5_23 · Cited by 12
Verzele, D., & Madder, A. (2012) · European Journal of Organic Chemistry · doi:10.1002/ejoc.201201235 · Cited by 11
Evolution of gene regulation--on the road towards computational inferences
Fuellen, G. (2010) · Briefings in Bioinformatics · doi:10.1093/bib/bbq060 · Cited by 11
Tissue-specific prediction of directly regulated genes
McLeay, R. C., Leat, C. J., & Bailey, T. L. (2011) · Bioinformatics · doi:10.1093/bioinformatics/btr399 · Cited by 11
Balmer, J. E., & Blomhoff, R. (2009) · Journal of Molecular Evolution · doi:10.1007/s00239-009-9238-1 · Cited by 11
Transcription Factor Action Orchestrates the Complex Expression Pattern of CRABS CLAW in Arabidopsis
Gross, T., & Becker, A. (2021) · Genes · doi:10.3390/genes12111663 · Cited by 10
Predicting site-specific human selective pressure using evolutionary signatures
Sadri, J., Diallo, A. B., & Blanchette, M. (2011) · Bioinformatics · doi:10.1093/bioinformatics/btr241 · Cited by 10
Incorporating evolution of transcription factor binding sites into annotated alignments
Bais, A. S., Grossmann, S., & Vingron, M. (2007) · Journal of Biosciences · doi:10.1007/s12038-007-0084-2 · Cited by 10
Simultaneous alignment and annotation ofcis-regulatory regions
Bais, A. S., Grossmann, S., & Vingron, M. (2007) · Bioinformatics · doi:10.1093/bioinformatics/btl305 · Cited by 10
Biological code breaking in the 21st century
Michelson, A. M., & Bulyk, M. L. (2006) · Molecular Systems Biology · doi:10.1038/msb4100062 · Cited by 9
Characterization of the genome expression trends in the heading-stage panicle of six rice lineages
Peng, Z., Zhang, H., Liu, T., Dzikiewicz, K. M., Li, S., Wang, X., Hu, G., Zhu, Z., Wei, X., Zhu, Q., et al. (2008) · Genomics · doi:10.1016/j.ygeno.2008.10.005 · Cited by 9
Metadata
- Authors
- Moses, A. M., Chiang, D. Y., Pollard, D. A., Iyer, V. N., & Eisen, M. B.
- Affiliations
- University of California, Berkeley (US)
- Lawrence Berkeley National Laboratory (US)
- Corresponding author
- Eisen, Michael B
- Venue
- Genome Biology
- Published
- 2004-11-30
- Volume
- 5
- Issue
- 12
- Pages
- R98-R98
- ISSN
- 1465-6906 (ISSN-L)
- 1474-760X
- PMC
- PMC545801
- OpenAlex
- W2109314645
- Cited by
- 153
- References
- 53
- Citations by year
- 2026: 1 · 2025: 1 · 2023: 1 · 2022: 1 · 2021: 4 · 2018: 1 · 2017: 4 · 2016: 4 · 2015: 3 · 2014: 4 · 2013: 6 · 2012: 12
- FWCI
- 6.29
- Type
- journal article
- Language
- en
- Open access
- gold
- doi.org
- Locations
- Genome biology (publishedVersion, cc-by)
- PubMed Central (publishedVersion)
- PubMed (publishedVersion)
- University of North Texas Digital Library (University of North Texas) (submittedVersion)
- OSTI OAI (U.S. Department of Energy Office of Scientific and Technical Information) (submittedVersion)
- Funders
- National Human Genome Research Institute (R01HG002779)
- Topics
- Life Sciences › Biochemistry, Genetics and Molecular Biology › Molecular Biology › Genomics and Chromatin Dynamics
- Life Sciences › Biochemistry, Genetics and Molecular Biology › Molecular Biology › Genomics and Phylogenetic Studies
- Life Sciences › Biochemistry, Genetics and Molecular Biology › Molecular Biology › Fungal and yeast genetics research
- Keywords
- transcription factor binding sites, conserved binding sites, binding site evolution, Saccharomyces, phylogenetic distance
- MeSH terms
- Binding Sites, DNA, DNA-Binding Proteins, DNA, Fungal, Biological Evolution, Gene Expression Regulation, Models, Genetic, Saccharomyces cerevisiae, Software, Species Specificity, Transcription Factors, Sequence Alignment, Conserved Sequence, Saccharomyces cerevisiae Proteins
About these checks
Registry, retraction, Cites and statistics results are computed, not judged, with one exception: a printed reference that no index lists is read once by a model before it counts as a citation error. Claims are extracted by a model and kept only when their quote appears verbatim in the text; each cited source is then checked, with a model’s help, for whether it says what the claim relies on. Those verdicts can be wrong — read the claim’s quote and the cited source before relying on one.
Statistics and arithmetic are recomputed, not judged.
Confidence bands are shown only for fields calibrated on our annotated test set. None is calibrated yet, so no band is shown.
What counts as a claim ›How we measure confidence ›How we check this ›
Are you an author, or do you see a problem with this page? Request a review
