

The DOI matches its Crossref record; 30 of the 30 references it cites were found in a registry or an index.
Gene ontology analysis for RNA-seq: accounting for selection bias
Open accessAbstract
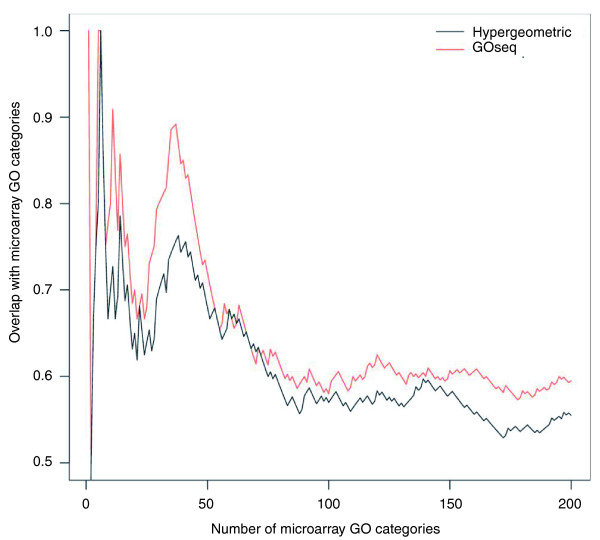
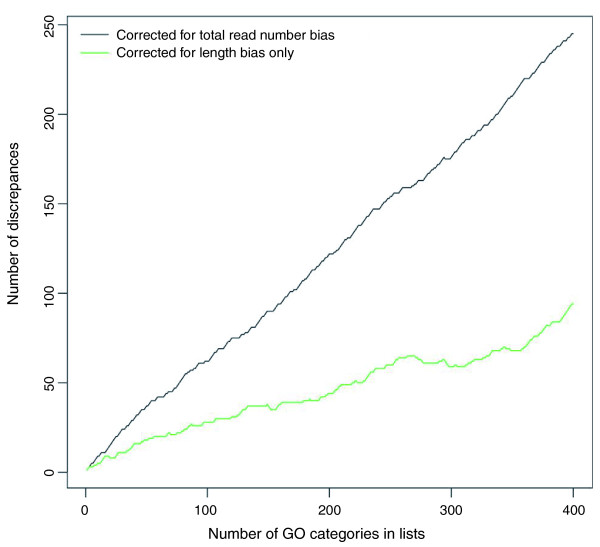
We present GOseq, an application for performing Gene Ontology (GO) analysis on RNA-seq data. GO analysis is widely used to reduce complexity and highlight biological processes in genome-wide expression studies, but standard methods give biased results on RNA-seq data due to over-detection of differential expression for long and highly expressed transcripts. Application of GOseq to a prostate cancer data set shows that GOseq dramatically changes the results, highlighting categories more consistent with the known biology.
Overview
The claims and statistics of this paper haven’t been checked yet.
Run the check — free, no account needed. It reads the open-access text and checks the sources it cites.
Integrity signals
Registry
Cites
Statistics
Figures
Verification
Claims the paper makes
The claims and statistics of this paper haven’t been checked yet.
Run the check — free, no account needed. It reads the open-access text and checks the sources it cites.
Claims other papers make about this one
Each is checked against this paper’s own text: does it say what the citing paper says it does?
In the citing paper
“Compared to the hypergeometric and Fisher’s tests, GOSeq has an advantage for RNA-seq data in that it explicitly accounts for the detection bias of long and highly expressed transcripts.”
From Gene expression elucidates functional impact of polygenic risk for schizophrenia (2016) · cites this paper as [111]
Self-check
Percentages, sums and reported differences re-computed from the paper’s own numbers.
The self-check needs the paper’s full text.
Citations
Cites
Controlling the False Discovery Rate: A Practical and Powerful Approach to Multiple Testing
Benjamini, Y., & Hochberg, Y. (1995) · Journal of the Royal Statistical Society Series B: Statistical Methodology · doi:10.1111/j.2517-6161.1995.tb02031.x · Cited by 109,482
Subramanian, A., Tamayo, P., Mootha, V. K., Mukherjee, S., Ebert, B. L., Gillette, M. A., Paulovich, A., Pomeroy, S. L., Golub, T. R., Lander, E. S., et al. (2005) · Proceedings of the National Academy of Sciences · doi:10.1073/pnas.0506580102 · Cited by 53,625
Gene Ontology: tool for the unification of biology
Ashburner, M., Ball, C. A., Blake, J. A., Botstein, D., Butler, H., Cherry, J. M., Davis, A. P., Dolinski, K., Dwight, S. S., Eppig, J. T., et al. (2000) · Nature Genetics · doi:10.1038/75556 · Cited by 43,206
Robinson, M. D., McCarthy, D. J., & Smyth, G. K. (2010) · Bioinformatics · doi:10.1093/bioinformatics/btp616 · Cited by 41,364
Self-citationSystematic and integrative analysis of large gene lists using DAVID bioinformatics resources
Huang, D. W., Sherman, B. T., & Lempicki, R. A. (2009) · Nature Protocols · doi:10.1038/nprot.2008.211 · Cited by 35,890
Ultrafast and memory-efficient alignment of short DNA sequences to the human genome.
Langmead, B., Trapnell, C., Pop, M., & Salzberg, S. L. (2009) · Genome Biology · doi:10.1186/gb-2009-10-3-r25 · Cited by 21,849
Mapping and quantifying mammalian transcriptomes by RNA-Seq
Mortazavi, A., Williams, B. A., McCue, K., Schaeffer, L., & Wold, B. (2008) · Nature Methods · doi:10.1038/nmeth.1226 · Cited by 13,696
A scaling normalization method for differential expression analysis of RNA-seq data
Robinson, M. D., & Oshlack, A. (2010) · Genome Biology · doi:10.1186/gb-2010-11-3-r25 · Cited by 7,876
Self-citationlimma: Linear Models for Microarray Data
Smyth, G. K. (2005) · Statistics for Biology and Health · doi:10.1007/0-387-29362-0_23 · Cited by 5,796
Self-citationAlternative isoform regulation in human tissue transcriptomes
Wang, E. T., Sandberg, R., Luo, S., Khrebtukova, I., Zhang, L., Mayr, C., Kingsmore, S. F., Schroth, G. P., & Burge, C. B. (2008) · Nature · doi:10.1038/nature07509 · Cited by 5,181
Research works printed but not linked: 1
- Barnard GA: Contribution to the discussion of Professor Bartlet's paper. J Roy Stat Soc Series B (Methodological). 1963, 25: 294-
Cited by
Sorted by citations
Items 301–400 of 1,009
The E3 Ligase TaSAP5 Alters Drought Stress Responses by Promoting the Degradation of DRIP Proteins
Zhang, N., Yin, Y., Liu, X., Tong, S., Xing, J., Zhang, Y., Pudake, R. N., Izquierdo, E. M., Peng, H., Xin, M., et al. (2017) · PLANT PHYSIOLOGY · doi:10.1104/pp.17.01319 · Cited by 109
Lamarre, S., Frasse, P., Zouine, M., Labourdette, D., Sainderichin, E., Hu, G., Berre, V. L., Bouzayen, M., & Maza, É. (2018) · Frontiers in Plant Science · doi:10.3389/fpls.2018.00108 · Cited by 106
He, Y., Cheng, J., He, Y., Yang, B., Cheng, Y., Yang, C., Zhang, H., & Wang, Z. (2018) · Plant Biotechnology Journal · doi:10.1111/pbi.12979 · Cited by 108
Sheppard, S., Santosa, E. K., Lau, C. M., Violante, S. N., Giovanelli, P., Kim, H., Cross, J. R., Li, M. O., & Sun, J. C.-Y. (2021) · Cell Reports · doi:10.1016/j.celrep.2021.109210 · Cited by 110
Yang, T., Guo, M., Yang, H., Guo, S., & Dong, C. (2015) · Applied Microbiology and Biotechnology · doi:10.1007/s00253-015-7047-6 · Cited by 107
Yue, C., Li, Q., & Yu, H. (2018) · Marine Biotechnology · doi:10.1007/s10126-018-9798-4 · Cited by 107
Dang, S., Leng, Y., Wang, Z., Xiao, X., Zhang, X., Wen, T., Gong, H.-Z., Hong, A., & Ma, Y. (2019) · International Journal of Biological Sciences · doi:10.7150/ijbs.28522 · Cited by 112
Gomes, A. P., Ilter, D., Low, V., Rosenzweig, A., Shen, Z.-J., Schild, T., Rivas, M. A., Er, E. E., McNally, D. R., Mutvei, A. P., et al. (2019) · Cancer Cell · doi:10.1016/j.ccell.2019.08.006 · Cited by 108
Riesco‐Eizaguirre, G., Wert-Lamas, L., Perales-Patón, J., Sastre-Perona, A., Fernández, L. P., & Santisteban, P. (2015) · Cancer Research · doi:10.1158/0008-5472.can-14-3547 · Cited by 107
Kogelman, L. J. A., Cirera, S., Zhernakova, D. V., Fredholm, M., Franke, L., & Kadarmideen, H. N. (2014) · BMC Medical Genomics · doi:10.1186/1755-8794-7-57 · Cited by 106
Salleh, M. S. M., Mazzoni, G., Höglund, J., Olijhoek, D., Lund, P., Løvendahl, P., & Kadarmideen, H. N. (2017) · BMC Genomics · doi:10.1186/s12864-017-3622-9 · Cited by 106
Zhang, P., Lyu, D., Jia, L., He, J., & Qin, S. (2017) · BMC Genomics · doi:10.1186/s12864-017-4055-1 · Cited by 106
Zhao, H., Wu, C., Gao, D., Chen, S., Zhu, Y., Sun, J., Luo, H., Yu, K., Fan, H., & Zhang, X. (2018) · ACS Nano · doi:10.1021/acsnano.8b01996 · Cited by 106
Sun, Y., Fu, T., Jin, J., Murphy, R. W., Hillis, D. M., Zhang, Y., & Che, J. (2018) · Proceedings of the National Academy of Sciences · doi:10.1073/pnas.1813593115 · Cited by 104
Huang, X., Poelchau, M. F., & Armbruster, P. (2015) · PLoS neglected tropical diseases · doi:10.1371/journal.pntd.0003724 · Cited by 104
Mosaic Epigenetic Dysregulation of Ectodermal Cells in Autism Spectrum Disorder
Berko, E. R., Suzuki, M., Beren, F., Lemetre, C., Alaimo, C. M., Calder, R. B., Ballaban‐Gil, K. R., Gounder, B., Kampf, K., Kirschen, J., et al. (2014) · PLoS Genetics · doi:10.1371/journal.pgen.1004402 · Cited by 110
Regions of variable DNA methylation in human placenta associated with newborn neurobehavior
Paquette, A. G., Houseman, E. A., Green, B. B., Lesseur, C., Armstrong, D. A., Lester, B. M., & Marsit, C. J. (2016) · Epigenetics · doi:10.1080/15592294.2016.1195534 · Cited by 104
Intrinsic apoptosis shapes the tumor spectrum linked to inactivation of the deubiquitinase BAP1
He, M. X., Chaurushiya, M. S., Webster, J. D., Kummerfeld, S., Reja, R., Chaudhuri, S., Chen, Y., Modrusan, Z. D., Haley, B., Dugger, D. L., et al. (2019) · Science · doi:10.1126/science.aav4902 · Cited by 105
Zhuang, H., Lou, Q., Liu, H., Han, H., Wang, Q., Tang, Z., Ma, Y., & Wang, H. (2019) · International Journal of Molecular Sciences · doi:10.3390/ijms20184387 · Cited by 105
Hergenreder, E., Minotti, A. P., Zorina, Y., Oberst, P., Zhao, Z., Munguba, H., Calder, E. L., Baggiolini, A., Walsh, R. M., Liston, C. M., et al. (2024) · Nature Biotechnology · doi:10.1038/s41587-023-02031-z · Cited by 109
Gerlach, J. P., van Buggenum, J. A. G., Tanis, S. E. J., Hogeweg, M., Heuts, B. M. H., Muraro, M. J., Elze, L., Rivello, F., Rakszewska, A., van Oudenaarden, A., et al. (2019) · Scientific Reports · doi:10.1038/s41598-018-37977-7 · Cited by 104
A Non-canonical BCOR-PRC1.1 Complex Represses Differentiation Programs in Human ESCs
Wang, Z., Gearhart, M. D., Lee, Y.-W., Kumar, I., Ramazanov, B. R., Zhang, Y., Hernandez, C. C., Lü, A., Neuenkirchen, N., Deng, J., et al. (2018) · Cell stem cell · doi:10.1016/j.stem.2017.12.002 · Cited by 110
Hu, L., Xie, Y., Fan, S., Wang, Z., Wang, F., Zhang, B., Li, H., Song, J., & Kong, L. (2018) · Plant Science · doi:10.1016/j.plantsci.2018.03.036 · Cited by 104
Deng, Z., Chen, M., Liu, F., Wang, Y., Xu, S., Sha, K., Peng, Q., Wu, Z., Xiao, W., Liu, T., et al. (2022) · Journal of Investigative Dermatology · doi:10.1016/j.jid.2022.01.003 · Cited by 110
An epigenome-wide DNA methylation study of PTSD and depression in World Trade Center responders
Kuan, P.-F., Waszczuk, M. A., Kotov, R., Marsit, C. J., Guffanti, G., Gonzalez, A., Yang, X., Koenen, K., Bromet, E., & Luft, B. J. (2017) · Translational Psychiatry · doi:10.1038/tp.2017.130 · Cited by 103
Targets of the StBEL5 Transcription Factor Include the FT Ortholog StSP6A
Sharma, P., Lin, T., & Hannapel, D. J. (2015) · PLANT PHYSIOLOGY · doi:10.1104/pp.15.01314 · Cited by 103
Comprehensive RNA-Seq Analysis on the Regulation of Tomato Ripening by Exogenous Auxin
Li, J., Tao, X., Li, L., Mao, L., Luo, Z., Khan, Z. U., & Ying, T. (2016) · PLoS ONE · doi:10.1371/journal.pone.0156453 · Cited by 103
Doktor, T. K., Hua, Y., Andersen, H. S., Brøner, S., Liu, Y. H., Wieckowska, A., Dembić, M., Bruun, G. H., Krainer, A. R., & Andresen, B. S. (2016) · Nucleic Acids Research · doi:10.1093/nar/gkw731 · Cited by 103
Chang, Y., Nguyen, B. H., Xie, Y., Xiao, B., Tang, N., Zhu, W., Mou, T., & Xiong, L. (2017) · Frontiers in Plant Science · doi:10.3389/fpls.2017.01102 · Cited by 102
Zhou, C., Mei, X., Rothenberg, D. O., Yang, Z., Zhang, W., Wan, S., Yang, H., & Zhang, L. (2020) · Molecules · doi:10.3390/molecules25010190 · Cited by 104
A molecular quantitative trait locus map for osteoarthritis
Steinberg, J., Southam, L., Butterfield, N. C., Roumeliotis, T. I., Fontalis, A., Clark, M. J. R., Jayasuriya, R. L., Swift, D., Shah, K. M., Curry, K. F., et al. (2021) · Nature Communications · doi:10.1038/s41467-021-21593-7 · Cited by 103
Massive Activation of Archaeal Defense Genes during Viral Infection
Quax, T. E. F., Voet, M., Sismeiro, O., Dillies, M., Jagla, B., Coppée, J., Sezonov, G., Forterre, P., John van der, O. O. S. T., Lavigne, R., et al. (2013) · Journal of Virology · doi:10.1128/jvi.01020-13 · Cited by 99
Elevated CO 2 improves lipid accumulation by increasing carbon metabolism in Chlorella sorokiniana
Sun, Z., Chen, Y., & Du, J. (2015) · Plant Biotechnology Journal · doi:10.1111/pbi.12398 · Cited by 104
Leach, M. D., Farrer, R. A., Tan, K., Miao, Z., Walker, L. A., Cuomo, C. A., Wheeler, R. T., Brown, A. J. P., Wong, K. H., & Cowen, L. E. (2016) · Nature Communications · doi:10.1038/ncomms11704 · Cited by 107
The Transcriptome of Leishmania major Developmental Stages in Their Natural Sand Fly Vector
Inbar, E., Hughitt, V. K., Dillon, L. A. L., Ghosh, K., El-Sayed, N. M., & Sacks, D. L. (2017) · mBio · doi:10.1128/mbio.00029-17 · Cited by 106
Christen, V., Schirrmann, M. K., Frey, J. E., & Fent, K. (2018) · Environmental Science & Technology · doi:10.1021/acs.est.8b01801 · Cited by 102
C1 CAGE detects transcription start sites and enhancer activity at single-cell resolution
Kouno, T., Moody, J., Kwon, A. T.-J., Shibayama, Y., Kato, S., Huang, Y., Böttcher, M. E., Motakis, E., Mendez, M., Severin, J., et al. (2019) · Nature Communications · doi:10.1038/s41467-018-08126-5 · Cited by 101
Li, W., Tan, L., Zou, Y., Tan, X., Huang, J., Chen, W., & Tang, Q. (2020) · Molecules · doi:10.3390/molecules25020354 · Cited by 102
the Traumatic Stress Brain Study Group, Logue, M. W., Miller, M. W., Wolf, E. J., Huber, B. R., Morrison, F. G., Zhou, Z., Zheng, Y., Smith, A. K., Daskalakis, N. P., et al. (2020) · Clinical Epigenetics · doi:10.1186/s13148-020-0820-0 · Cited by 105
Rubino, F., Carberry, C., Waters, S. M., Kenny, D., McCabe, M. S., & Creevey, C. J. (2017) · The ISME Journal · doi:10.1038/ismej.2016.172 · Cited by 101
Wu, J. Q., Wang, X., Beveridge, N. J., Tooney, P. A., Scott, R. J., Carr, V. J., & Cairns, M. J. (2012) · PLoS ONE · doi:10.1371/journal.pone.0036351 · Cited by 103
Moya, A., Huisman, L., Forêt, S., Gattuso, J., Hayward, D. C., Ball, E. E., & Miller, D. J. (2014) · Molecular Ecology · doi:10.1111/mec.13021 · Cited by 101
Lu, X., Wang, X., Chen, X., Shu, N., Wang, J., Wang, D., Wang, S., Fan, W., Guo, L., Guo, X., et al. (2017) · BMC Genomics · doi:10.1186/s12864-017-3681-y · Cited by 101
Kudapa, H., Garg, V., Chitikineni, A., & Varshney, R. K. (2018) · Plant Cell & Environment · doi:10.1111/pce.13210 · Cited by 101
Wu, H.-Y., Shi, N., An, X., Cong, L., Fu, H., Cao, L. H., Feng, Y., Sun, D., & Zhang, L. (2018) · International Journal of Molecular Sciences · doi:10.3390/ijms19061594 · Cited by 101
Ding, J., Liu, C., Luo, S., Zhang, Y., Gao, X., Wu, X., Shen, W., & Zhu, J. (2019) · Ecotoxicology and Environmental Safety · doi:10.1016/j.ecoenv.2019.109957 · Cited by 100
Priming with a Seaweed Extract Strongly Improves Drought Tolerance in Arabidopsis
Rasul, F., Gupta, S., Olas, J. J., Gechev, T., Sujeeth, N., & Mueller‐Roeber, B. (2021) · International Journal of Molecular Sciences · doi:10.3390/ijms22031469 · Cited by 102
Glycosylation is an Androgen-Regulated Process Essential for Prostate Cancer Cell Viability
Munkley, J., Vodák, D., Livermore, K. E., James, K., Wilson, B. T., Knight, B., McCullagh, P. J., McGrath, J. S., Crundwell, M. C., Harries, L. W., et al. (2016) · EBioMedicine · doi:10.1016/j.ebiom.2016.04.018 · Cited by 100
Wang, W., Gao, Z., Wang, H., Li, T., He, W., Lv, W., & Zhang, J. (2016) · Scientific Reports · doi:10.1038/srep26604 · Cited by 101
Capozzi, V., Toro, M. R. D., Grieco, F., Michelotti, V., Salma, M., Lamontanara, A., Russo, P., Orrù, L., Alexandre, H., & Spano, G. (2016) · Food Microbiology · doi:10.1016/j.fm.2016.06.007 · Cited by 100
Chen, L., Shi, S., Jiang, N., Khanzada, H., Wassan, G. M., Zhu, C., Peng, X., Xu, J., Chen, Y., Yu, Q., et al. (2018) · BMC Genomics · doi:10.1186/s12864-018-4807-6 · Cited by 100
Mesnage, R., Ibragim, M., Mandrioli, D., Falcioni, L., Tibaldi, E., Belpoggi, F., Brandsma, I., Bourne, E., Savage, E., Mein, C. A., et al. (2021) · Toxicological Sciences · doi:10.1093/toxsci/kfab143 · Cited by 106
Zhao, H., Li, Z., Wang, Y., Wang, J., Xiao, M., Liu, H., Quan, R., Zhang, H., Huang, R., Zhu, L., et al. (2021) · Plant Biotechnology Journal · doi:10.1111/pbi.13729 · Cited by 99
Feng, D., Li, Q., Yu, H., Zhao, X., & Kong, L. (2015) · PLoS ONE · doi:10.1371/journal.pone.0145257 · Cited by 98
Fernandes, M. C., Dillon, L. A. L., Belew, A. T., Bravo, H. C., Mosser, D. M., & El-Sayed, N. M. (2016) · mBio · doi:10.1128/mbio.00027-16 · Cited by 104
The Landscape of A-to-I RNA Editome Is Shaped by Both Positive and Purifying Selection
Yu, Y., Zhou, H., Kong, Y., Pan, B., Chen, L., Wang, H., Hao, P., & Li, X. (2016) · PLoS Genetics · doi:10.1371/journal.pgen.1006191 · Cited by 98
Disrupted prenatal RNA processing and myogenesis in congenital myotonic dystrophyPreprint
Thomas, J. D., Sznajder, Ł. J., Bardhi, O., Aslam, F. N., Anastasiadis, Z. P., Scotti, M. M., Nishino, I., Nakamori, M., Wang, E. T., & Swanson, M. S. (2017) · Genes & Development · doi:10.1101/gad.300590.117 · Cited by 103
PP2A-B′ holoenzyme substrate recognition, regulation and role in cytokinesis
Wu, C.-G., Chen, H., Guo, F., Yadav, V. K., Mcilwain, S. J., Rowse, M., Choudhary, A., Lin, Z., Li, Y., Gu, T., et al. (2017) · Cell Discovery · doi:10.1038/celldisc.2017.27 · Cited by 85
The U2AF1S34F mutation induces lineage-specific splicing alterations in myelodysplastic syndromes
Yip, B. H., Steeples, V., Repapi, E., Armstrong, R. N., Llorian, M., Roy, S., Shaw, J. M., Dolatshad, H., Taylor, S., Verma, A. K., et al. (2017) · Journal of Clinical Investigation · doi:10.1172/jci91363 · Cited by 99
Rippin, M., Becker, B., & Holzinger, A. (2017) · Plant and Cell Physiology · doi:10.1093/pcp/pcx136 · Cited by 103
Coppola, M., Cascone, P., Lelio, I. D., Woo, S. L., Lorito, M., Rao, R., Pennacchio, F., Guerrieri, E., & Digilio, M. C. (2019) · Frontiers in Physiology · doi:10.3389/fphys.2019.00813 · Cited by 97
Hobit identifies tissue-resident memory T cell precursors that are regulated by Eomes
Vidal, L. P., Behr, F. M., Kragten, N. A. M., Nota, B., Wesselink, T. H., Kavazović, I., Covill, L., Schuller, M. B. P., Bryceson, Y. T., Wensveen, F. M., et al. (2021) · Science Immunology · doi:10.1126/sciimmunol.abg3533 · Cited by 101
Germain, P.-L., & Testa, G. (2017) · Stem Cell Reports · doi:10.1016/j.stemcr.2017.05.012 · Cited by 94
Molecular profiling of dilated cardiomyopathy that progresses to heart failure
Burke, M. A., Chang, S., Wakimoto, H., Gorham, J., Conner, D. A., Christodoulou, D. C., Parfenov, M. G., DePalma, S. R., Eminaga, S., Konno, T., et al. (2016) · JCI Insight · doi:10.1172/jci.insight.86898 · Cited by 98
Pubertal development in healthy children is mirrored by DNA methylation patterns in peripheral blood
Almstrup, K., Johansen, M. L., Busch, A. S., Hagen, C. P., Nielsen, J. E., Petersen, J. H., & Juul, A. (2016) · Scientific Reports · doi:10.1038/srep28657 · Cited by 94
Costa, F., Alba, R., Schouten, H. J., Soglio, V., Gianfranceschi, L., Serra, S., Musacchi, S., Sansavini, S., Costa, G., Fei, Z., et al. (2010) · BMC Plant Biology · doi:10.1186/1471-2229-10-229 · Cited by 96
OsSIDP366 , a DUF1644 gene, positively regulates responses to drought and salt stresses in rice
Guo, C., Luo, C., Guo, L., Li, M., Guo, X., Zhang, Y., Wang, L., & Chen, L. (2015) · Journal of Integrative Plant Biology · doi:10.1111/jipb.12376 · Cited by 95
Tissue-Specific Venom Composition and Differential Gene Expression in Sea Anemones
Macrander, J., Broe, M. B., & Daly, M. (2016) · Genome Biology and Evolution · doi:10.1093/gbe/evw155 · Cited by 98
Wang, X., Hou, J., Quedenau, C., & Chen, W. (2016) · Molecular Systems Biology · doi:10.15252/msb.20166941 · Cited by 90
A TRIM insertion in the promoter of Ms2 causes male sterility in wheat
Xia, C., Zhang, L., Zou, C., Gu, Y., Duan, J., Zhao, G., Wu, J., Liu, Y., Fang, X., Gao, L., et al. (2017) · Nature Communications · doi:10.1038/ncomms15407 · Cited by 95
Yan, H., Gao, Y., Ding, Q., Liu, J., Li, Y., Jin, M., Xu, H., Ma, S., Wang, X., Zeng, W., et al. (2019) · International Journal of Biological Sciences · doi:10.7150/ijbs.33233 · Cited by 98
Choi, Y.-J., Ghedin, E., Berriman, M., Keane, J. A., Holroyd, N. E., Mayhew, G. F., Christensen, B. M., & Michalski, M. L. (2011) · PLoS neglected tropical diseases · doi:10.1371/journal.pntd.0001409 · Cited by 95
Shade Avoidance Components and Pathways in Adult Plants Revealed by Phenotypic Profiling
Nozue, K., Tat, A. V., Devisetty, U. K., Robinson, M. C., Mumbach, M. R., Ichihashi, Y., Lekkala, S., & Maloof, J. (2015) · PLoS Genetics · doi:10.1371/journal.pgen.1004953 · Cited by 99
Adams, A. T., Kennedy, N. A., Hansen, R., Ventham, N. T., O’Leary, K. R., Drummond, H. E., Noble, C. L., El-Omar, E. M., Russell, R. K., Wilson, D. C., et al. (2014) · Inflammatory Bowel Diseases · doi:10.1097/mib.0000000000000179 · Cited by 97
Yue, Y., Yu, R., & Fan, Y. (2015) · BMC Genomics · doi:10.1186/s12864-015-1653-7 · Cited by 94
The splicing landscape is globally reprogrammed during male meiosis
Schmid, R., Grellscheid, S. N., Ehrmann, I. E., Dalgliesh, C., Danilenko, M., Paronetto, M. P., Pedrotti, S., Grellscheid, D., Dixon, R. J., Sette, C., et al. (2013) · Nucleic Acids Research · doi:10.1093/nar/gkt811 · Cited by 94
Owen, R. P., White, M. J., Severson, D. T., Braden, B., Bailey, A. A., Goldin, R. D., Wang, L. M., Ruiz‐Puig, C., Maynard, N. D., Green, A., et al. (2018) · Nature Communications · doi:10.1038/s41467-018-06796-9 · Cited by 94
Gros‐Balthazard, M., Besnard, G., Sarah, G., Holtz, Y., Leclercq, J., Santoni, S., Wegmann, D., Glémin, S., & Khadari, B. (2019) · The Plant Journal · doi:10.1111/tpj.14435 · Cited by 96
Third Report on Chicken Genes and Chromosomes 2015
Schmid, M., Smith, J., Burt, D. W., Aken, B. L., Antin, P. B., Archibald, A. L., Ashwell, C. M., Blackshear, P. J., Boschiero, C., Brown, C. T., et al. (2015) · Cytogenetic and Genome Research · doi:10.1159/000430927 · Cited by 93
Ma, Z., Tan, Y., Cui, G., Feng, Y., Cui, Q., & Song, X. (2015) · Scientific Reports · doi:10.1038/srep14446 · Cited by 93
Li, Q., Ding, G., Li, B., & Guo, S. (2017) · Scientific Reports · doi:10.1038/s41598-017-00445-9 · Cited by 93
The Transcriptomic Responses of Pinus massoniana to Drought Stress
Du, M., Ding, G., & Cai, Q. (2018) · Forests · doi:10.3390/f9060326 · Cited by 93
Retrotransposon insertions can initiate colorectal cancer and are associated with poor survival
Cajuso, T., Sulo, P., Tanskanen, T. J., Katainen, R., Taira, A., Hänninen, U. A., Kondelin, J., Forsström, L. M., Välimäki, N., Aavikko, M., et al. (2019) · Nature Communications · doi:10.1038/s41467-019-11770-0 · Cited by 96
Song, Z., Zhang, L., Han, J., Zhou, M., & Liu, J. (2020) · The Plant Journal · doi:10.1111/tpj.15114 · Cited by 94
Guo, M., Yang, F., Liu, C., Zou, J., Qi, Z., Fotopoulos, V., Lu, G., Yu, J., & Zhou, J. (2022) · New Phytologist · doi:10.1111/nph.18403 · Cited by 93
Vyas, M., Fisher, T. W., He, R., Nelson, W. M., Yin, G., Cicero, J. M., Willer, M. R., Kim, R., Kramer, R., May, G. A., et al. (2015) · PLoS ONE · doi:10.1371/journal.pone.0130328 · Cited by 94
Zhao, D., Li, T., shen, M., Wang, J., & Zhao, Z. (2014) · Microbiological Research · doi:10.1016/j.micres.2014.09.005 · Cited by 93
Löffler, M., Simen, J. D., Jäger, G., Schäferhoff, K., Freund, A., & Takors, R. (2016) · Metabolic Engineering · doi:10.1016/j.ymben.2016.06.008 · Cited by 93
El Gaamouch, F., Audrain, M., Lin, W.-J., Beckmann, N., Jiang, C., Hariharan, S., Heeger, P. S., Schadt, E. E., Gandy, S., Ehrlich, M. E., et al. (2020) · Molecular Neurodegeneration · doi:10.1186/s13024-020-0357-x · Cited by 92
Si, Y., Wen, H., Li, Y., He, F., Li, J., Li, S., & He, H. (2018) · BMC Genomics · doi:10.1186/s12864-018-4825-4 · Cited by 92
Zheng, C., Wang, Y., Ding, Z., & Zhao, L. (2016) · Frontiers in Plant Science · doi:10.3389/fpls.2016.01858 · Cited by 92
Ilut, D. C., Coate, J. E., Luciano, A. K., Owens, T. G., May, G. D., Farmer, A. D., & Doyle, J. J. (2012) · American Journal of Botany · doi:10.3732/ajb.1100312 · Cited by 91
Systematic Identification of Long Noncoding RNAs in Immature and Mature Porcine Testes1
Ran, M., Chen, B., Li, Z., Wu, M., Liu, X., He, C., Zhang, S., & Li, Z. (2016) · Biology of Reproduction · doi:10.1095/biolreprod.115.136911 · Cited by 90
Zhao, N., Li, W., Bai, S., Guo, W., Yuan, G., Wang, F., Liu, W., & Wang, J. (2017) · Frontiers in Plant Science · doi:10.3389/fpls.2017.01391 · Cited by 91
Auxin and cytokinin coordinate the dormancy and outgrowth of axillary bud in strawberry runner
Qiu, Y., Guan, S., Wen, C., Li, P., Gao, Z., & Chen, X. (2019) · BMC Plant Biology · doi:10.1186/s12870-019-2151-x · Cited by 94
Wu, J., Wu, Z., Wang, T., Mantri, N. L., Huang, H., Li, H., Tao, Z., & Guo, Q. (2020) · Plant Physiology and Biochemistry · doi:10.1016/j.plaphy.2020.01.010 · Cited by 91
Li, S., Zhang, Y., Liu, Y., Zhang, P., Wang, X., Chen, B., Ding, L., Nie, Y., Li, F., Ma, Z., et al. (2023) · The Plant Cell · doi:10.1093/plcell/koad307 · Cited by 91
Charting Brachyury-mediated developmental pathways during early mouse embryogenesis
Lolas, M., Valenzuela, P., Tjian, R., & Liu, Z. J. (2014) · Proceedings of the National Academy of Sciences · doi:10.1073/pnas.1402612111 · Cited by 91
Hughes, T. E., Langdale, J. A., & Kelly, S. L. (2014) · Genome Research · doi:10.1101/gr.172684.114 · Cited by 93
The DNA Methylome and Transcriptome of Different Brain Regions in Schizophrenia and Bipolar Disorder
Xiao, Y., Camarillo, C., Ping, Y., Arana, T. B., Zhao, H., Thompson, P. M., Xu, C., Su, B., Fan, H., Ordoñez, J., et al. (2014) · PLoS ONE · doi:10.1371/journal.pone.0095875 · Cited by 95
Metadata
- Authors
- Young, M. D., Wakefield, M. J., Smyth, G. K., & Oshlack, A.
- Affiliations
- Walter and Eliza Hall Institute of Medical Research (AU)
- Corresponding author
- Oshlack, Alicia
- Venue
- Genome Biology
- Published
- 2010-02-04
- Volume
- 11
- Issue
- 2
- Pages
- R14-R14
- ISSN
- 1465-6906 (ISSN-L)
- 1474-760X
- PMC
- PMC2872874
- OpenAlex
- W2107060225
- Cited by
- 7,107
- References
- 30
- Citations by year
- 2026: 284 · 2025: 495 · 2024: 690 · 2023: 713 · 2022: 918 · 2021: 1008 · 2020: 849 · 2019: 657 · 2018: 476 · 2017: 385 · 2016: 229 · 2015: 160 · 2014: 95 · 2013: 58 · 2012: 44
- FWCI
- 18.77
- Type
- journal article
- Language
- en
- Open access
- gold
- doi.org
- Locations
- Genome biology (publishedVersion, cc-by)
- Europe PMC (PubMed Central) (publishedVersion, cc-by)
- PubMed Central (publishedVersion, cc-by)
- PubMed (publishedVersion)
- Minerva Access (University of Melbourne) (submittedVersion, cc-by)
- Topics
- Life Sciences › Biochemistry, Genetics and Molecular Biology › Molecular Biology › Bioinformatics and Genomic Networks
- Life Sciences › Biochemistry, Genetics and Molecular Biology › Molecular Biology › Genomics and Phylogenetic Studies
- Life Sciences › Biochemistry, Genetics and Molecular Biology › Molecular Biology › Gene expression and cancer classification
- Keywords
- gene ontology enrichment, RNA-seq, selection bias, differential gene expression, prostate cancer, gene expression analysis
- MeSH terms
- Androgens, Humans, Male, Prostatic Neoplasms, Gene Expression Regulation, Neoplastic, Bias, Sequence Analysis, RNA, Cell Line, Tumor, Genome-Wide Association Study
About these checks
Registry, retraction, Cites and statistics results are computed, not judged, with one exception: a printed reference that no index lists is read once by a model before it counts as a citation error. Claims are extracted by a model and kept only when their quote appears verbatim in the text; each cited source is then checked, with a model’s help, for whether it says what the claim relies on. Those verdicts can be wrong — read the claim’s quote and the cited source before relying on one.
Statistics and arithmetic are recomputed, not judged.
Confidence bands are shown only for fields calibrated on our annotated test set. None is calibrated yet, so no band is shown.
What counts as a claim ›How we measure confidence ›How we check this ›
Are you an author, or do you see a problem with this page? Request a review
