

The DOI matches its Crossref record; 70 of the 70 references it cites were found in a registry or an index; 2 of the 25 sources its claims cite were checked for support.
PU.1 target genes undergo Tet2-coupled demethylation and DNMT3b-mediated methylation in monocyte-to-osteoclast differentiation
Open accessAbstract
Background: DNA methylation is a key epigenetic mechanism for driving and stabilizing cell-fate decisions. Local deposition and removal of DNA methylation are tightly coupled with transcription factor binding, although the relationship varies with the specific differentiation process. Conversion of monocytes to osteoclasts is a unique terminal differentiation process within the hematopoietic system. This differentiation model is relevant to autoimmune disease and cancer, and there is abundant knowledge on the sets of transcription factors involved. Results: Here we focused on DNA methylation changes during osteoclastogenesis. Hypermethylation and hypomethylation changes took place in several thousand genes, including all relevant osteoclast differentiation and function categories. Hypomethylation occurred in association with changes in 5-hydroxymethylcytosine, a proposed intermediate toward demethylation. Transcription factor binding motif analysis revealed an over-representation of PU.1, NF-κB, and AP-1 (Jun/Fos) binding motifs in genes undergoing DNA methylation changes. Among these, only PU.1 motifs were significantly enriched in both hypermethylated and hypomethylated genes; ChIP-seq data analysis confirmed its association to both gene sets. Moreover, PU.1 interacts with both DNMT3b and TET2, suggesting its participation in driving hypermethylation and hydroxymethylation-mediated hypomethylation. Consistent with this, siRNA-mediated PU.1 knockdown in primary monocytes impaired the acquisition of DNA methylation and expression changes, and reduced the association of TET2 and DNMT3b at PU.1 targets during osteoclast differentiation. Conclusions: The work described here identifies key changes in DNA methylation during monocyte-to-osteoclast differentiation and reveals novel roles for PU.1 in this process.
Overview
AI snapshot
Written from the paper’s full text.
TL;DR
In matched human monocyte-to-osteoclast differentiation samples, DNA methylation is extensively remodeled, with thousands of genes gaining or losing methylation. PU.1 binds both hypo- and hypermethylated targets and recruits TET2 or DNMT3b, and PU.1 knockdown impairs these methylation and expression changes.
Key findings
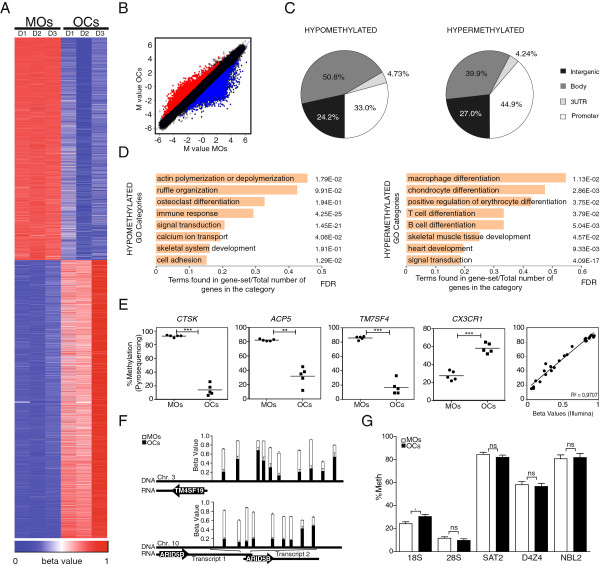
- In three matched CD14+ monocyte/osteoclast pairs, 3,515 genes (8,028 CpGs) were differentially methylated (FC ≥2 or ≤0.5; FDR ≤0.05): 1,895 hypomethylated genes (3,597 CpGs) and 2,054 hypermethylated genes (4,429 CpGs).
- Hypomethylation occurred early (about 60% of the range by days 0–4), without replication (BrdU-positive cells <9.8% between days 1 and 4; 5azadC treatment had no significant effect on osteoclastogenesis), and was associated with 5hmC changes at genes such as ACP5 and TM4SF19.
- Motif analysis found PU.1 enrichment in both directions: 15% of hypomethylated genes had PU.1/ETS motifs (PU.1 alone 9%) and 15% of hypermethylated genes had PU.1 motifs; ChIP-seq showed PU.1 peaks within 500 bp of 10.7% of promoter hypomethylated CpGs and 25.1% of promoter hypermethylated CpGs.
- PU.1 co-immunoprecipitated with DNMT3b and TET2; siRNA PU.1 knockdown (~60%) impaired acquisition of DNA methylation and expression changes at PU.1 targets and reduced TET2 and DNMT3b association at those promoters.
Methods
- Primary human CD14+ monocytes from buffy coats were differentiated to osteoclasts with M-CSF and RANKL for 21 days; three matched monocyte/osteoclast pairs were profiled.
- Genome-wide DNA methylation used Illumina HumanMethylation450 arrays, with differential methylation by paired limma (FC ≥2 or ≤0.5; P<0.01; FDR<0.05), validated by bisulfite pyrosequencing; expression data came from ArrayExpress E-MEXP-2019.
- Mechanistic assays included TRANSFAC/STORM motif analysis, PU.1 ChIP-seq (GSE31621), ChIP, immunoprecipitation, siRNA knockdown, 5hmC detection, BrdU, and 5azadC treatment.
Limitations
- Stated: PU.1 knockdown only partially impaired DNA methylation/expression changes and only partially reduced TET2/DNMT3b binding, indicating additional transcription factors participate; TM7SF4 showed no effect, possibly because it demethylates before PU.1 knockdown is effective.
- Stated: the detailed mechanisms coupling 5mC hydroxylation and demethylation remain debated, and the study did not address whether PU.1 interactions involve different subpopulations or post-translational modifications.
- Evident: array analyses used three matched pairs, and some ChIP experiments are described as three biological triplicates but only one experiment is shown; TRANSFAC predictions had limited overlap with ChIP-seq (20.6% hypomethylated, 46.9% hypermethylated), which the authors note reveals weakness in predictive motif searches.
Model-written summary. Check it against the paper before relying on it.
Integrity signals
Registry
Cites
Statistics
Figures
Verification
Claims the paper makes
82 Own result · 24 Own interpretation · 18 Not checked yet · 14 Own method · 1 Supported · 1 No basis given
A result the paper reports from its own data — it cites no other source for it, so there is none to check. The quote shows it is in the paper.
In the paper
“although DNA methylation changes also occurred at a similar scale in gene bodies (51% for hypomethylated CpGs, 40% for hypermethylated CpGs)”
§ PU.1 target genes undergo Tet2-coupled demethylation and DNMT3b-mediated methylation in monocyte-to-osteoclast differentiation > Results > Cell differentiation and fusion in osteoclastogenesis are accompanied by hypomethylation and hypermethylation of key functional pathways and genes
plain- Asserted: passes — The authors put it forward as true.
- Checkable: passes — It can be checked against evidence.
- Load-bearing: unclear — It is unclear whether the paper’s conclusions depend on it.
- Based: passes — The paper gives a reason why it holds.
A result the paper reports from its own data — it cites no other source for it, so there is none to check. The quote shows it is in the paper.
In the paper
“Conversely, CX3CR1, an important factor for MO adhesion to blood vessels that is downregulated during osteoclastogenesis, displayed an increase in methylation of over 28%”
§ PU.1 target genes undergo Tet2-coupled demethylation and DNMT3b-mediated methylation in monocyte-to-osteoclast differentiation > Results > Cell differentiation and fusion in osteoclastogenesis are accompanied by hypomethylation and hypermethylation of key functional pathways and genes
plaindirect- Asserted: passes — The authors put it forward as true.
- Checkable: passes — It can be checked against evidence.
- Load-bearing: unclear — It is unclear whether the paper’s conclusions depend on it.
- Based: passes — The paper gives a reason why it holds.
A result the paper reports from its own data — it cites no other source for it, so there is none to check. The quote shows it is in the paper.
In the paper
“TM7SF4, which encodes for DC-STAMP, a seven-pass transmembrane protein involved in signal transduction in OCs and dendritic cells, undergoes 59% hypomethylation.”
§ PU.1 target genes undergo Tet2-coupled demethylation and DNMT3b-mediated methylation in monocyte-to-osteoclast differentiation > Results > Cell differentiation and fusion in osteoclastogenesis are accompanied by hypomethylation and hypermethylation of key functional pathways and genes
plain- Asserted: passes — The authors put it forward as true.
- Checkable: passes — It can be checked against evidence.
- Load-bearing: unclear — It is unclear whether the paper’s conclusions depend on it.
- Based: passes — The paper gives a reason why it holds.
A result the paper reports from its own data — it cites no other source for it, so there is none to check. The quote shows it is in the paper.
In the paper
“Hypermethylation and hypomethylation occur in many relevant functional categories and key genes, including those whose functions are crucial to OC biology, like CTSK, ACP5, and DC-STAMP.”
§ PU.1 target genes undergo Tet2-coupled demethylation and DNMT3b-mediated methylation in monocyte-to-osteoclast differentiation > Background
plain- Asserted: passes — The authors put it forward as true.
- Checkable: passes — It can be checked against evidence.
- Load-bearing: passes — The paper’s conclusions depend on it.
- Based: passes — The paper gives a reason why it holds.
A result the paper reports from its own data — it cites no other source for it, so there is none to check. The quote shows it is in the paper.
In the paper
“associated with a change in 5-hydroxymethylcytosine”
§ PU.1 target genes undergo Tet2-coupled demethylation and DNMT3b-mediated methylation in monocyte-to-osteoclast differentiation > Background
plaincorrelational- Asserted: passes — The authors put it forward as true.
- Checkable: passes — It can be checked against evidence.
- Load-bearing: passes — The paper’s conclusions depend on it.
- Based: passes — The paper gives a reason why it holds.
A result the paper reports from its own data — it cites no other source for it, so there is none to check. The quote shows it is in the paper.
In the paper
“ChIP-seq data analysis confirmed its association to both gene sets.”
§ PU.1 target genes undergo Tet2-coupled demethylation and DNMT3b-mediated methylation in monocyte-to-osteoclast differentiation > Abstract > Results
plaincorrelational- Asserted: passes — The authors put it forward as true.
- Checkable: passes — It can be checked against evidence.
- Load-bearing: passes — The paper’s conclusions depend on it.
- Based: passes — The paper gives a reason why it holds.
A result the paper reports from its own data — it cites no other source for it, so there is none to check. The quote shows it is in the paper.
In the paper
“PU.1 interacts with both DNMT3b and TET2”
§ PU.1 target genes undergo Tet2-coupled demethylation and DNMT3b-mediated methylation in monocyte-to-osteoclast differentiation > Abstract > Results
plaincorrelational- Asserted: passes — The authors put it forward as true.
- Checkable: passes — It can be checked against evidence.
- Load-bearing: passes — The paper’s conclusions depend on it.
- Based: passes — The paper gives a reason why it holds.
A result the paper reports from its own data — it cites no other source for it, so there is none to check. The quote shows it is in the paper.
In the paper
“Statistical analysis of the combined data from the three pairs of samples revealed that 3,515 genes (8,028 CpGs) displayed differential methylation (FC ≥2 or FC ≤0.5; false discovery rate (FDR) ≤0.05).”
§ PU.1 target genes undergo Tet2-coupled demethylation and DNMT3b-mediated methylation in monocyte-to-osteoclast differentiation > Results > Cell differentiation and fusion in osteoclastogenesis are accompanied by hypomethylation and hypermethylation of key functional pathways and genes
plainn = 3- Asserted: passes — The authors put it forward as true.
- Checkable: passes — It can be checked against evidence.
- Load-bearing: passes — The paper’s conclusions depend on it.
- Based: passes — The paper gives a reason why it holds.
A result the paper reports from its own data — it cites no other source for it, so there is none to check. The quote shows it is in the paper.
In the paper
“This analysis showed a very close correlation between the array and the pyrosequencing data (R2 = 0.9707)”
§ PU.1 target genes undergo Tet2-coupled demethylation and DNMT3b-mediated methylation in monocyte-to-osteoclast differentiation > Results > Cell differentiation and fusion in osteoclastogenesis are accompanied by hypomethylation and hypermethylation of key functional pathways and genes
plaincorrelational- Asserted: passes — The authors put it forward as true.
- Checkable: passes — It can be checked against evidence.
- Load-bearing: passes — The paper’s conclusions depend on it.
- Based: passes — The paper gives a reason why it holds.
A result the paper reports from its own data — it cites no other source for it, so there is none to check. The quote shows it is in the paper.
In the paper
“Gene ontology analysis of hypomethylated CpGs revealed significant enrichment (FDR ≤0.05) for a variety of functional categories of relevance in OC differentiation and function”
§ PU.1 target genes undergo Tet2-coupled demethylation and DNMT3b-mediated methylation in monocyte-to-osteoclast differentiation > Results > Cell differentiation and fusion in osteoclastogenesis are accompanied by hypomethylation and hypermethylation of key functional pathways and genes
plaincorrelational- Asserted: passes — The authors put it forward as true.
- Checkable: passes — It can be checked against evidence.
- Load-bearing: passes — The paper’s conclusions depend on it.
- Based: passes — The paper gives a reason why it holds.
A result the paper reports from its own data — it cites no other source for it, so there is none to check. The quote shows it is in the paper.
In the paper
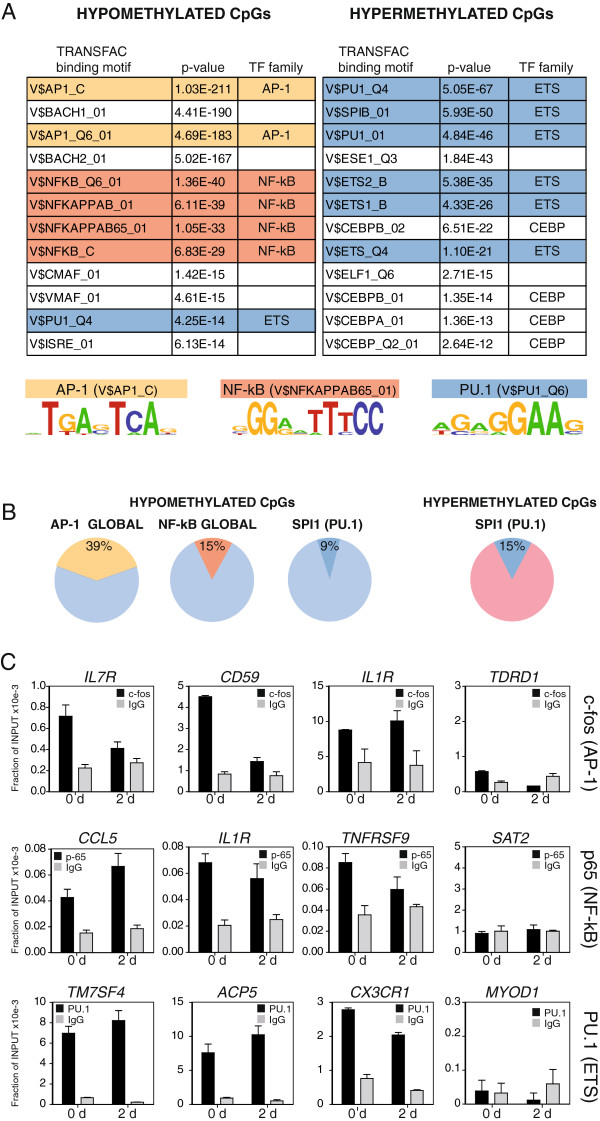
“Inspection of transcription factor binding motif over-representation in genes undergoing DNA methylation changes revealed the enrichment of the PU.1 binding motif in hypermethylated genes and AP-1, NF-kB, and also PU.1 motifs among hypomethylated genes.”
§ PU.1 target genes undergo Tet2-coupled demethylation and DNMT3b-mediated methylation in monocyte-to-osteoclast differentiation > Background
plaincorrelational- Asserted: passes — The authors put it forward as true.
- Checkable: passes — It can be checked against evidence.
- Load-bearing: passes — The paper’s conclusions depend on it.
- Based: passes — The paper gives a reason why it holds.
In the paper
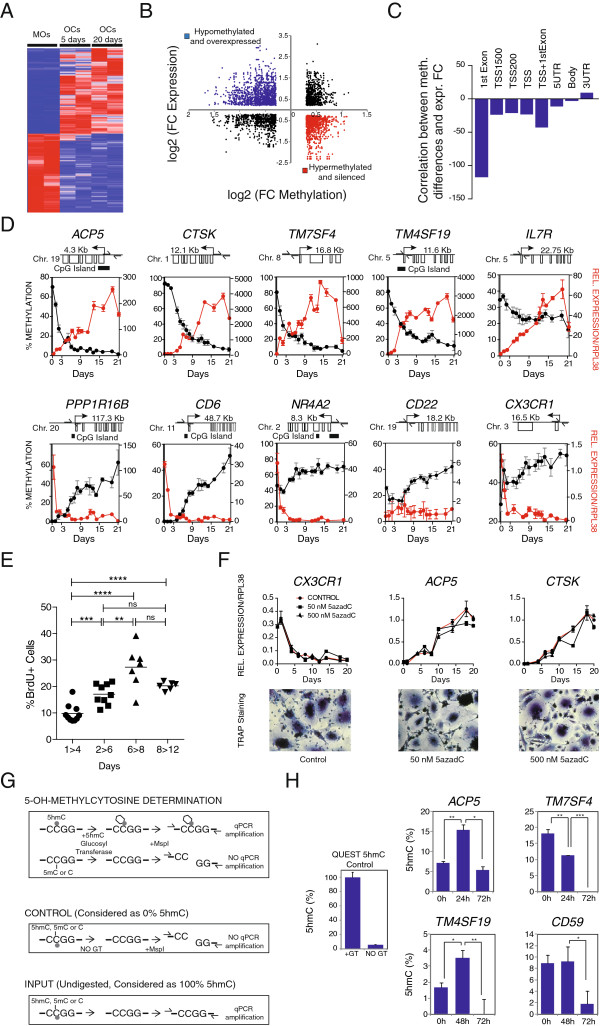
“Our analysis showed that most changes occurred within the first 5 days”
§ PU.1 target genes undergo Tet2-coupled demethylation and DNMT3b-mediated methylation in monocyte-to-osteoclast differentiation > Results > Hypomethylation is replication-independent and involves changes in 5-hydroxymethylcytosine
What the sources say
- Not checked yetcites [32] Gallois A, Lachuer J, Yvert G, Wierinckx A, Brunet F, Rabourdin-Combe C, Delprat C, Jurdic P, Mazzorana M: Genome-wide expression analyses establish dendritic cells as a new osteoclast precursor able to generate bone-resorbing cells more efficiently than monocytes. J Bone Miner Res. 2010, 25: 661-672. 10.1359/jbmr.090829. source
plain- Asserted: passes — The authors put it forward as true.
- Checkable: passes — It can be checked against evidence.
- Load-bearing: unclear — It is unclear whether the paper’s conclusions depend on it.
- Based: passes — The paper gives a reason why it holds.
A result the paper reports from its own data — it cites no other source for it, so there is none to check. The quote shows it is in the paper.
In the paper
“We found that osteoclastogenesis was associated with the drastic reshaping of the DNA methylation landscape.”
§ PU.1 target genes undergo Tet2-coupled demethylation and DNMT3b-mediated methylation in monocyte-to-osteoclast differentiation > Background
plaincorrelational- Asserted: passes — The authors put it forward as true.
- Checkable: passes — It can be checked against evidence.
- Load-bearing: passes — The paper’s conclusions depend on it.
- Based: passes — The paper gives a reason why it holds.
A result the paper reports from its own data — it cites no other source for it, so there is none to check. The quote shows it is in the paper.
In the paper
“The ACP5/TRACP gene is hypomethylated around 47%.”
§ PU.1 target genes undergo Tet2-coupled demethylation and DNMT3b-mediated methylation in monocyte-to-osteoclast differentiation > Results > Cell differentiation and fusion in osteoclastogenesis are accompanied by hypomethylation and hypermethylation of key functional pathways and genes
plain- Asserted: passes — The authors put it forward as true.
- Checkable: passes — It can be checked against evidence.
- Load-bearing: unclear — It is unclear whether the paper’s conclusions depend on it.
- Based: passes — The paper gives a reason why it holds.
A result the paper reports from its own data — it cites no other source for it, so there is none to check. The quote shows it is in the paper.
In the paper
“We also observed significant hypomethylation at the osteoclast-specific transcription factor gene NFATC1, although in this case hypomethylation occurred at CpG sites located in its gene body region.”
§ PU.1 target genes undergo Tet2-coupled demethylation and DNMT3b-mediated methylation in monocyte-to-osteoclast differentiation > Results > Cell differentiation and fusion in osteoclastogenesis are accompanied by hypomethylation and hypermethylation of key functional pathways and genes
plain- Asserted: passes — The authors put it forward as true.
- Checkable: passes — It can be checked against evidence.
- Load-bearing: unclear — It is unclear whether the paper’s conclusions depend on it.
- Based: passes — The paper gives a reason why it holds.
A result the paper reports from its own data — it cites no other source for it, so there is none to check. The quote shows it is in the paper.
In the paper
“Changes corresponding to the average three pairs of monocytes/osteoclasts (Figure 1B) were almost identical to the pattern obtained for each individual pair of samples”
§ PU.1 target genes undergo Tet2-coupled demethylation and DNMT3b-mediated methylation in monocyte-to-osteoclast differentiation > Results > Cell differentiation and fusion in osteoclastogenesis are accompanied by hypomethylation and hypermethylation of key functional pathways and genes
plaincorrelational- Asserted: passes — The authors put it forward as true.
- Checkable: passes — It can be checked against evidence.
- Load-bearing: unclear — It is unclear whether the paper’s conclusions depend on it.
- Based: passes — The paper gives a reason why it holds.
A result the paper reports from its own data — it cites no other source for it, so there is none to check. The quote shows it is in the paper.
In the paper
“Among these, only PU.1 motifs were significantly enriched in both hypermethylated and hypomethylated genes”
§ PU.1 target genes undergo Tet2-coupled demethylation and DNMT3b-mediated methylation in monocyte-to-osteoclast differentiation > Abstract > Results
plain- Asserted: passes — The authors put it forward as true.
- Checkable: passes — It can be checked against evidence.
- Load-bearing: passes — The paper’s conclusions depend on it.
- Based: passes — The paper gives a reason why it holds.
A result the paper reports from its own data — it cites no other source for it, so there is none to check. The quote shows it is in the paper.
In the paper
“was DNA replication-independent”
§ PU.1 target genes undergo Tet2-coupled demethylation and DNMT3b-mediated methylation in monocyte-to-osteoclast differentiation > Background
plain- Asserted: passes — The authors put it forward as true.
- Checkable: passes — It can be checked against evidence.
- Load-bearing: passes — The paper’s conclusions depend on it.
- Based: passes — The paper gives a reason why it holds.
A result the paper reports from its own data — it cites no other source for it, so there is none to check. The quote shows it is in the paper.
In the paper
“Over one-third of the differentially methylated CpG-containing probes (33% for hypomethylated CpGs, 45% for hypermethylated CpGs) mapped to gene promoters”
§ PU.1 target genes undergo Tet2-coupled demethylation and DNMT3b-mediated methylation in monocyte-to-osteoclast differentiation > Results > Cell differentiation and fusion in osteoclastogenesis are accompanied by hypomethylation and hypermethylation of key functional pathways and genes
plain- Asserted: passes — The authors put it forward as true.
- Checkable: passes — It can be checked against evidence.
- Load-bearing: unclear — It is unclear whether the paper’s conclusions depend on it.
- Based: passes — The paper gives a reason why it holds.
A result the paper reports from its own data — it cites no other source for it, so there is none to check. The quote shows it is in the paper.
In the paper
“CTSK, the lysosomal cysteine proteinase involved in bone remodeling and resorption, is hypomethylated more than 60%.”
§ PU.1 target genes undergo Tet2-coupled demethylation and DNMT3b-mediated methylation in monocyte-to-osteoclast differentiation > Results > Cell differentiation and fusion in osteoclastogenesis are accompanied by hypomethylation and hypermethylation of key functional pathways and genes
plain- Asserted: passes — The authors put it forward as true.
- Checkable: passes — It can be checked against evidence.
- Load-bearing: unclear — It is unclear whether the paper’s conclusions depend on it.
- Based: passes — The paper gives a reason why it holds.
A result the paper reports from its own data — it cites no other source for it, so there is none to check. The quote shows it is in the paper.
In the paper
“These experiments showed no significant DNA methylation changes in any of these repetitive elements”
§ PU.1 target genes undergo Tet2-coupled demethylation and DNMT3b-mediated methylation in monocyte-to-osteoclast differentiation > Results > Cell differentiation and fusion in osteoclastogenesis are accompanied by hypomethylation and hypermethylation of key functional pathways and genes
plain- Asserted: passes — The authors put it forward as true.
- Checkable: passes — It can be checked against evidence.
- Load-bearing: passes — The paper’s conclusions depend on it.
- Based: passes — The paper gives a reason why it holds.
A result the paper reports from its own data — it cites no other source for it, so there is none to check. The quote shows it is in the paper.
In the paper
“Hypomethylation occurred early, concomitantly with transcription changes”
§ PU.1 target genes undergo Tet2-coupled demethylation and DNMT3b-mediated methylation in monocyte-to-osteoclast differentiation > Background
plaincorrelational- Asserted: passes — The authors put it forward as true.
- Checkable: passes — It can be checked against evidence.
- Load-bearing: passes — The paper’s conclusions depend on it.
- Based: passes — The paper gives a reason why it holds.
A result the paper reports from its own data — it cites no other source for it, so there is none to check. The quote shows it is in the paper.
In the paper
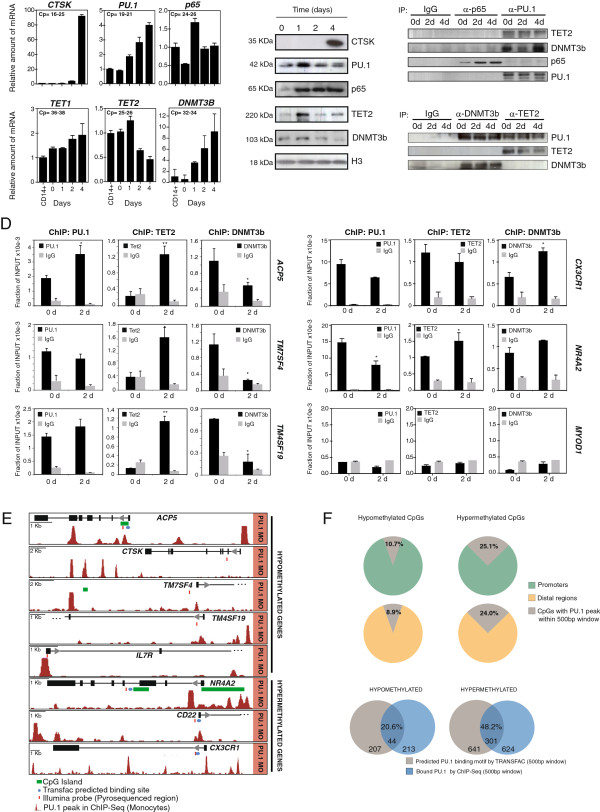
“PU.1 revealed an increase at the mRNA levels, although there was no change at the protein level.”
§ PU.1 target genes undergo Tet2-coupled demethylation and DNMT3b-mediated methylation in monocyte-to-osteoclast differentiation > Results > PU.1 recruits DNMT3b and TET2 to hypermethylated and hypomethylated genes
plaindirect- Asserted: passes — The authors put it forward as true.
- Checkable: passes — It can be checked against evidence.
- Load-bearing: unclear — It is unclear whether the paper’s conclusions depend on it.
- Based: passes — The paper gives a reason why it holds.
A result the paper reports from its own data — it cites no other source for it, so there is none to check. The quote shows it is in the paper.
In the paper
“In the case of hypomethylated genes, we observed highly significant enrichment of binding motifs of the AP-1 family and NF-kB subunits”
§ PU.1 target genes undergo Tet2-coupled demethylation and DNMT3b-mediated methylation in monocyte-to-osteoclast differentiation > Results > Sequences undergoing DNA methylation changes are enriched for binding motifs for AP-1, NF-kB, and PU.1, key transcription factors in osteoclastogenesis
boostedcorrelational- Asserted: passes — The authors put it forward as true.
- Checkable: passes — It can be checked against evidence.
- Load-bearing: passes — The paper’s conclusions depend on it.
- Based: passes — The paper gives a reason why it holds.
A result the paper reports from its own data — it cites no other source for it, so there is none to check. The quote shows it is in the paper.
In the paper
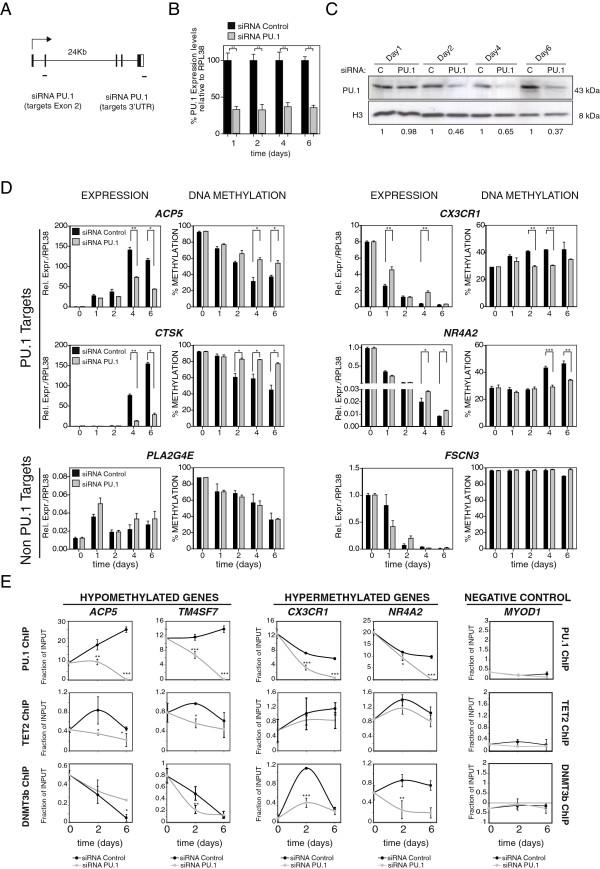
“whereas DNMT3b was initially enriched but its association with these promoters was lost after M-CSF and RANKL stimulation (Figure 4D).”
§ PU.1 target genes undergo Tet2-coupled demethylation and DNMT3b-mediated methylation in monocyte-to-osteoclast differentiation > Results > PU.1 recruits DNMT3b and TET2 to hypermethylated and hypomethylated genes
plaincorrelational- Asserted: passes — The authors put it forward as true.
- Checkable: passes — It can be checked against evidence.
- Load-bearing: passes — The paper’s conclusions depend on it.
- Based: passes — The paper gives a reason why it holds.
A result the paper reports from its own data — it cites no other source for it, so there is none to check. The quote shows it is in the paper.
In the paper
“Our analysis showed binding of PU.1 at both 0 and 2 days (Figure 4D).”
§ PU.1 target genes undergo Tet2-coupled demethylation and DNMT3b-mediated methylation in monocyte-to-osteoclast differentiation > Results > PU.1 recruits DNMT3b and TET2 to hypermethylated and hypomethylated genes
plaincorrelational- Asserted: passes — The authors put it forward as true.
- Checkable: passes — It can be checked against evidence.
- Load-bearing: passes — The paper’s conclusions depend on it.
- Based: passes — The paper gives a reason why it holds.
A result the paper reports from its own data — it cites no other source for it, so there is none to check. The quote shows it is in the paper.
In the paper
“For genes that become hypomethylated, we observed an increased recruitment of TET2 at these promoters after 2 days”
§ PU.1 target genes undergo Tet2-coupled demethylation and DNMT3b-mediated methylation in monocyte-to-osteoclast differentiation > Results > PU.1 recruits DNMT3b and TET2 to hypermethylated and hypomethylated genes
plaindirect- Asserted: passes — The authors put it forward as true.
- Checkable: passes — It can be checked against evidence.
- Load-bearing: passes — The paper’s conclusions depend on it.
- Based: passes — The paper gives a reason why it holds.
A result the paper reports from its own data — it cites no other source for it, so there is none to check. The quote shows it is in the paper.
In the paper
“observed that the overlap between the two sets of list was around 20.6% for hypomethylated genes and 46.9% for hypermethylated genes, again using the same 500 bp for both datasets (Figure 4F).”
§ PU.1 target genes undergo Tet2-coupled demethylation and DNMT3b-mediated methylation in monocyte-to-osteoclast differentiation > Results > PU.1 recruits DNMT3b and TET2 to hypermethylated and hypomethylated genes
plaincorrelational- Asserted: passes — The authors put it forward as true.
- Checkable: passes — It can be checked against evidence.
- Load-bearing: unclear — It is unclear whether the paper’s conclusions depend on it.
- Based: passes — The paper gives a reason why it holds.
A result the paper reports from its own data — it cites no other source for it, so there is none to check. The quote shows it is in the paper.
In the paper
“Consistent with previous observations, fewer than 9.8% were found to be BrdU-positive between 1 and 4 days, confirming the virtual absence of replication”
§ PU.1 target genes undergo Tet2-coupled demethylation and DNMT3b-mediated methylation in monocyte-to-osteoclast differentiation > Results > Hypomethylation is replication-independent and involves changes in 5-hydroxymethylcytosine
boosted- Asserted: passes — The authors put it forward as true.
- Checkable: passes — It can be checked against evidence.
- Load-bearing: passes — The paper’s conclusions depend on it.
- Based: passes — The paper gives a reason why it holds.
A result the paper reports from its own data — it cites no other source for it, so there is none to check. The quote shows it is in the paper.
In the paper
“We found that the promoters of genes like ACP5, CTSK, TM7SF4, and TM4SF19 rapidly became hypomethylated following RANKL and M-CSF stimulation”
§ PU.1 target genes undergo Tet2-coupled demethylation and DNMT3b-mediated methylation in monocyte-to-osteoclast differentiation > Results > Hypomethylation is replication-independent and involves changes in 5-hydroxymethylcytosine
plaindirectn = 3- Asserted: passes — The authors put it forward as true.
- Checkable: passes — It can be checked against evidence.
- Load-bearing: passes — The paper’s conclusions depend on it.
- Based: passes — The paper gives a reason why it holds.
A result the paper reports from its own data — it cites no other source for it, so there is none to check. The quote shows it is in the paper.
In the paper
“We then observed that the upregulation of genes like ACP5 and CTSK (both PU.1-direct targets) was partially impaired (Figure 5D).”
§ PU.1 target genes undergo Tet2-coupled demethylation and DNMT3b-mediated methylation in monocyte-to-osteoclast differentiation > Results > Dowregulation of PU.1 in MOs impairs activation of OC markers, hypomethylation, and recruitment of DNMT3b and TET2
plaindirect- Asserted: passes — The authors put it forward as true.
- Checkable: passes — It can be checked against evidence.
- Load-bearing: passes — The paper’s conclusions depend on it.
- Based: passes — The paper gives a reason why it holds.
A result the paper reports from its own data — it cites no other source for it, so there is none to check. The quote shows it is in the paper.
In the paper
“We also observed increased recruitment of DNMT3b at 2 days after M-CSF/ RANKL stimulation.”
§ PU.1 target genes undergo Tet2-coupled demethylation and DNMT3b-mediated methylation in monocyte-to-osteoclast differentiation > Results > PU.1 recruits DNMT3b and TET2 to hypermethylated and hypomethylated genes
plaindirect- Asserted: passes — The authors put it forward as true.
- Checkable: passes — It can be checked against evidence.
- Load-bearing: passes — The paper’s conclusions depend on it.
- Based: passes — The paper gives a reason why it holds.
A result the paper reports from its own data — it cites no other source for it, so there is none to check. The quote shows it is in the paper.
In the paper
“In the case of TM7SF4, one of the key genes undergoing hypomethylation, we did not detect an effect of PU.1 downregulation on its DNA methylation dynamics (Additional file 10).”
§ PU.1 target genes undergo Tet2-coupled demethylation and DNMT3b-mediated methylation in monocyte-to-osteoclast differentiation > Results > Dowregulation of PU.1 in MOs impairs activation of OC markers, hypomethylation, and recruitment of DNMT3b and TET2
plain- Asserted: passes — The authors put it forward as true.
- Checkable: passes — It can be checked against evidence.
- Load-bearing: unclear — It is unclear whether the paper’s conclusions depend on it.
- Based: passes — The paper gives a reason why it holds.
A result the paper reports from its own data — it cites no other source for it, so there is none to check. The quote shows it is in the paper.
In the paper
“ChIP assays demonstrated the interaction of these factors with most of the aforementioned promoters, even before the stimulation with M-CSF and RANKL”
§ PU.1 target genes undergo Tet2-coupled demethylation and DNMT3b-mediated methylation in monocyte-to-osteoclast differentiation > Results > Sequences undergoing DNA methylation changes are enriched for binding motifs for AP-1, NF-kB, and PU.1, key transcription factors in osteoclastogenesis
boostedcorrelational- Asserted: passes — The authors put it forward as true.
- Checkable: passes — It can be checked against evidence.
- Load-bearing: passes — The paper’s conclusions depend on it.
- Based: passes — The paper gives a reason why it holds.
A result the paper reports from its own data — it cites no other source for it, so there is none to check. The quote shows it is in the paper.
In the paper
“These numbers were similar when focusing on CpGs located in distal regions (Figure 4F).”
§ PU.1 target genes undergo Tet2-coupled demethylation and DNMT3b-mediated methylation in monocyte-to-osteoclast differentiation > Results > PU.1 recruits DNMT3b and TET2 to hypermethylated and hypomethylated genes
plain- Asserted: passes — The authors put it forward as true.
- Checkable: passes — It can be checked against evidence.
- Load-bearing: unclear — It is unclear whether the paper’s conclusions depend on it.
- Based: passes — The paper gives a reason why it holds.
The paper states this without a source or data behind it here, so there is nothing to check it against. The quote shows it is in the paper.
In the paper
“However, hypermethylation does not seem to be predominant over hypomethylation.”
§ PU.1 target genes undergo Tet2-coupled demethylation and DNMT3b-mediated methylation in monocyte-to-osteoclast differentiation > Discussion
hedged- Asserted: passes — The authors put it forward as true.
- Checkable: passes — It can be checked against evidence.
- Load-bearing: unclear — It is unclear whether the paper’s conclusions depend on it.
- Based: passes — The paper gives a reason why it holds.
A result the paper reports from its own data — it cites no other source for it, so there is none to check. The quote shows it is in the paper.
In the paper
“PU.1 revealed an increase at the mRNA levels, although there was no change at the protein level.”
§ PU.1 target genes undergo Tet2-coupled demethylation and DNMT3b-mediated methylation in monocyte-to-osteoclast differentiation > Results > PU.1 recruits DNMT3b and TET2 to hypermethylated and hypomethylated genes
plain- Asserted: passes — The authors put it forward as true.
- Checkable: passes — It can be checked against evidence.
- Load-bearing: unclear — It is unclear whether the paper’s conclusions depend on it.
- Based: passes — The paper gives a reason why it holds.
A result the paper reports from its own data — it cites no other source for it, so there is none to check. The quote shows it is in the paper.
In the paper
“Most importantly, it also reduced the association of DNMT3b and TET2 reinforcing the notion of the role of these factors and their association with PU.1 in the DNA methylation changes occurring at these CpG sites (Figure 5E).”
§ PU.1 target genes undergo Tet2-coupled demethylation and DNMT3b-mediated methylation in monocyte-to-osteoclast differentiation > Results > Dowregulation of PU.1 in MOs impairs activation of OC markers, hypomethylation, and recruitment of DNMT3b and TET2
plaindirect- Asserted: passes — The authors put it forward as true.
- Checkable: passes — It can be checked against evidence.
- Load-bearing: passes — The paper’s conclusions depend on it.
- Based: passes — The paper gives a reason why it holds.
A result the paper reports from its own data — it cites no other source for it, so there is none to check. The quote shows it is in the paper.
In the paper
“For several genes that become hypomethylated, like ACP5 and TM4SF19, we observed an initial increase in 5hmC levels followed by a slight but significant decrease”
§ PU.1 target genes undergo Tet2-coupled demethylation and DNMT3b-mediated methylation in monocyte-to-osteoclast differentiation > Results > Hypomethylation is replication-independent and involves changes in 5-hydroxymethylcytosine
plaincorrelational- Asserted: passes — The authors put it forward as true.
- Checkable: passes — It can be checked against evidence.
- Load-bearing: passes — The paper’s conclusions depend on it.
- Based: passes — The paper gives a reason why it holds.
A result the paper reports from its own data — it cites no other source for it, so there is none to check. The quote shows it is in the paper.
In the paper
“confirmed the PU.1 downregulation close to 60% (Figure 5B and 5C).”
§ PU.1 target genes undergo Tet2-coupled demethylation and DNMT3b-mediated methylation in monocyte-to-osteoclast differentiation > Results > Dowregulation of PU.1 in MOs impairs activation of OC markers, hypomethylation, and recruitment of DNMT3b and TET2
plaindirect- Asserted: passes — The authors put it forward as true.
- Checkable: passes — It can be checked against evidence.
- Load-bearing: passes — The paper’s conclusions depend on it.
- Based: passes — The paper gives a reason why it holds.
A result the paper reports from its own data — it cites no other source for it, so there is none to check. The quote shows it is in the paper.
In the paper
“In fact, the PU.1 binding motif is present in 15% of all hypermethylated genes”
§ PU.1 target genes undergo Tet2-coupled demethylation and DNMT3b-mediated methylation in monocyte-to-osteoclast differentiation > Results > Sequences undergoing DNA methylation changes are enriched for binding motifs for AP-1, NF-kB, and PU.1, key transcription factors in osteoclastogenesis
plain- Asserted: passes — The authors put it forward as true.
- Checkable: passes — It can be checked against evidence.
- Load-bearing: unclear — It is unclear whether the paper’s conclusions depend on it.
- Based: passes — The paper gives a reason why it holds.
A result the paper reports from its own data — it cites no other source for it, so there is none to check. The quote shows it is in the paper.
In the paper
“In the case of hypermethylated genes, we identified even greater enrichment of the binding motifs of ETS-related transcription factors, especially PU.1”
§ PU.1 target genes undergo Tet2-coupled demethylation and DNMT3b-mediated methylation in monocyte-to-osteoclast differentiation > Results > Sequences undergoing DNA methylation changes are enriched for binding motifs for AP-1, NF-kB, and PU.1, key transcription factors in osteoclastogenesis
plaincorrelational- Asserted: passes — The authors put it forward as true.
- Checkable: passes — It can be checked against evidence.
- Load-bearing: passes — The paper’s conclusions depend on it.
- Based: passes — The paper gives a reason why it holds.
A result the paper reports from its own data — it cites no other source for it, so there is none to check. The quote shows it is in the paper.
In the paper
“we found that 10.7% of all hypomethylated CpGs located in promoter regions genes and 25.1% of all hypermethylated CpGs located in promoter regions had PU.1 peaks within this 500-bp window (Figure 4F).”
§ PU.1 target genes undergo Tet2-coupled demethylation and DNMT3b-mediated methylation in monocyte-to-osteoclast differentiation > Results > PU.1 recruits DNMT3b and TET2 to hypermethylated and hypomethylated genes
plaincorrelational- Asserted: passes — The authors put it forward as true.
- Checkable: passes — It can be checked against evidence.
- Load-bearing: passes — The paper’s conclusions depend on it.
- Based: passes — The paper gives a reason why it holds.
A result the paper reports from its own data — it cites no other source for it, so there is none to check. The quote shows it is in the paper.
In the paper
“We did not observe association of PU.1, DNMT3b, and TET2 in the negative control for PU.1 binding, the MyoD promoter.”
§ PU.1 target genes undergo Tet2-coupled demethylation and DNMT3b-mediated methylation in monocyte-to-osteoclast differentiation > Results > PU.1 recruits DNMT3b and TET2 to hypermethylated and hypomethylated genes
plain- Asserted: passes — The authors put it forward as true.
- Checkable: passes — It can be checked against evidence.
- Load-bearing: passes — The paper’s conclusions depend on it.
- Based: passes — The paper gives a reason why it holds.
A result the paper reports from its own data — it cites no other source for it, so there is none to check. The quote shows it is in the paper.
In the paper
“observed that the overlap between the two sets of list was around 20.6% for hypomethylated genes and 46.9% for hypermethylated genes, again using the same 500 bp for both datasets (Figure 4F).”
§ PU.1 target genes undergo Tet2-coupled demethylation and DNMT3b-mediated methylation in monocyte-to-osteoclast differentiation > Results > PU.1 recruits DNMT3b and TET2 to hypermethylated and hypomethylated genes
plaincorrelational- Asserted: passes — The authors put it forward as true.
- Checkable: passes — It can be checked against evidence.
- Load-bearing: unclear — It is unclear whether the paper’s conclusions depend on it.
- Based: passes — The paper gives a reason why it holds.
A result the paper reports from its own data — it cites no other source for it, so there is none to check. The quote shows it is in the paper.
In the paper
“Changes in mRNA levels occurred at a similar pace or, in some cases, in an even more gradual manner and were slightly delayed with respect to changes in DNA methylation.”
§ PU.1 target genes undergo Tet2-coupled demethylation and DNMT3b-mediated methylation in monocyte-to-osteoclast differentiation > Results > Hypomethylation is replication-independent and involves changes in 5-hydroxymethylcytosine
plaincorrelationaln = 3- Asserted: passes — The authors put it forward as true.
- Checkable: passes — It can be checked against evidence.
- Load-bearing: unclear — It is unclear whether the paper’s conclusions depend on it.
- Based: passes — The paper gives a reason why it holds.
A result the paper reports from its own data — it cites no other source for it, so there is none to check. The quote shows it is in the paper.
In the paper
“Much lower or insignificant levels of enrichment were obtained for AP-1 family members and NF-kB subunits among the hypermethylated genes.”
§ PU.1 target genes undergo Tet2-coupled demethylation and DNMT3b-mediated methylation in monocyte-to-osteoclast differentiation > Results > Sequences undergoing DNA methylation changes are enriched for binding motifs for AP-1, NF-kB, and PU.1, key transcription factors in osteoclastogenesis
plain- Asserted: passes — The authors put it forward as true.
- Checkable: passes — It can be checked against evidence.
- Load-bearing: unclear — It is unclear whether the paper’s conclusions depend on it.
- Based: passes — The paper gives a reason why it holds.
A result the paper reports from its own data — it cites no other source for it, so there is none to check. The quote shows it is in the paper.
In the paper
“No binding was observed in control sequences like Sat2 repeats and the MYOD1 and TDRD1 promoters.”
§ PU.1 target genes undergo Tet2-coupled demethylation and DNMT3b-mediated methylation in monocyte-to-osteoclast differentiation > Results > Sequences undergoing DNA methylation changes are enriched for binding motifs for AP-1, NF-kB, and PU.1, key transcription factors in osteoclastogenesis
plain- Asserted: passes — The authors put it forward as true.
- Checkable: passes — It can be checked against evidence.
- Load-bearing: unclear — It is unclear whether the paper’s conclusions depend on it.
- Based: passes — The paper gives a reason why it holds.
A result the paper reports from its own data — it cites no other source for it, so there is none to check. The quote shows it is in the paper.
In the paper
“First, a detailed analysis of the sequences undergoing DNA methylation changes produced evidences of the participation of several transcription factors, given the specific over-representation of certain motifs in hypo- and hypermethylated genes.”
§ PU.1 target genes undergo Tet2-coupled demethylation and DNMT3b-mediated methylation in monocyte-to-osteoclast differentiation > Discussion
plaincorrelational- Asserted: passes — The authors put it forward as true.
- Checkable: passes — It can be checked against evidence.
- Load-bearing: passes — The paper’s conclusions depend on it.
- Based: passes — The paper gives a reason why it holds.
A result the paper reports from its own data — it cites no other source for it, so there is none to check. The quote shows it is in the paper.
In the paper
“In contrast, hypermethylated genes like PPP1R16B, CD6, and NR4A2 (Figure 2D, bottom) displayed loss of expression before experiencing an increase in DNA methylation”
§ PU.1 target genes undergo Tet2-coupled demethylation and DNMT3b-mediated methylation in monocyte-to-osteoclast differentiation > Results > Hypomethylation is replication-independent and involves changes in 5-hydroxymethylcytosine
plaincorrelationaln = 3- Asserted: passes — The authors put it forward as true.
- Checkable: passes — It can be checked against evidence.
- Load-bearing: passes — The paper’s conclusions depend on it.
- Based: passes — The paper gives a reason why it holds.
A result the paper reports from its own data — it cites no other source for it, so there is none to check. The quote shows it is in the paper.
In the paper
“In the case of genes like CX3CR1 and NR4A2 we determined that downregulation was also impaired in PU.1-siRNA treated MOs.”
§ PU.1 target genes undergo Tet2-coupled demethylation and DNMT3b-mediated methylation in monocyte-to-osteoclast differentiation > Results > Dowregulation of PU.1 in MOs impairs activation of OC markers, hypomethylation, and recruitment of DNMT3b and TET2
plaindirect- Asserted: passes — The authors put it forward as true.
- Checkable: passes — It can be checked against evidence.
- Load-bearing: passes — The paper’s conclusions depend on it.
- Based: passes — The paper gives a reason why it holds.
A result the paper reports from its own data — it cites no other source for it, so there is none to check. The quote shows it is in the paper.
In the paper
“we found that 10.7% of all hypomethylated CpGs located in promoter regions genes and 25.1% of all hypermethylated CpGs located in promoter regions had PU.1 peaks within this 500-bp window (Figure 4F).”
§ PU.1 target genes undergo Tet2-coupled demethylation and DNMT3b-mediated methylation in monocyte-to-osteoclast differentiation > Results > PU.1 recruits DNMT3b and TET2 to hypermethylated and hypomethylated genes
plaincorrelational- Asserted: passes — The authors put it forward as true.
- Checkable: passes — It can be checked against evidence.
- Load-bearing: passes — The paper’s conclusions depend on it.
- Based: passes — The paper gives a reason why it holds.
A result the paper reports from its own data — it cites no other source for it, so there is none to check. The quote shows it is in the paper.
In the paper
“In the case of p65 NF-kB we only observed a clear increase at the protein level (Figure 4B).”
§ PU.1 target genes undergo Tet2-coupled demethylation and DNMT3b-mediated methylation in monocyte-to-osteoclast differentiation > Results > PU.1 recruits DNMT3b and TET2 to hypermethylated and hypomethylated genes
boosteddirect- Asserted: passes — The authors put it forward as true.
- Checkable: passes — It can be checked against evidence.
- Load-bearing: unclear — It is unclear whether the paper’s conclusions depend on it.
- Based: passes — The paper gives a reason why it holds.
A result the paper reports from its own data — it cites no other source for it, so there is none to check. The quote shows it is in the paper.
In the paper
“An inverse relationship between DNA methylation and gene expression was mainly observed for changes occurring in CpGs in the proximity of the TSS and within the first exon (Figure 2C) and it was less frequent in those at gene bodies and 3′UTR”
§ PU.1 target genes undergo Tet2-coupled demethylation and DNMT3b-mediated methylation in monocyte-to-osteoclast differentiation > Results > Hypomethylation is replication-independent and involves changes in 5-hydroxymethylcytosine
plaincorrelational- Asserted: passes — The authors put it forward as true.
- Checkable: passes — It can be checked against evidence.
- Load-bearing: passes — The paper’s conclusions depend on it.
- Based: passes — The paper gives a reason why it holds.
A result the paper reports from its own data — it cites no other source for it, so there is none to check. The quote shows it is in the paper.
In the paper
“In other genes, like TM7SF4 and CD59, of there were high levels of 5hmC before the addition of RANKL/M-CSF as if these genes were already primed for demethylation.”
§ PU.1 target genes undergo Tet2-coupled demethylation and DNMT3b-mediated methylation in monocyte-to-osteoclast differentiation > Results > Hypomethylation is replication-independent and involves changes in 5-hydroxymethylcytosine
plain- Asserted: passes — The authors put it forward as true.
- Checkable: passes — It can be checked against evidence.
- Load-bearing: unclear — It is unclear whether the paper’s conclusions depend on it.
- Based: passes — The paper gives a reason why it holds.
In the paper
“treatment with 5-Aza-2′-deoxycytidine (5azadC), a pharmacological compound that results in replication-coupled DNA demethylation [33], had no significant effect on osteoclastogenesis”
§ PU.1 target genes undergo Tet2-coupled demethylation and DNMT3b-mediated methylation in monocyte-to-osteoclast differentiation > Results > Hypomethylation is replication-independent and involves changes in 5-hydroxymethylcytosine
What the sources say
- Not checked yetcites [33] Momparler RL: Pharmacology of 5-Aza-2′-deoxycytidine (decitabine). Semin Hematol. 2005, 42: S9-S16. source
plain- Asserted: passes — The authors put it forward as true.
- Checkable: passes — It can be checked against evidence.
- Load-bearing: passes — The paper’s conclusions depend on it.
- Based: passes — The paper gives a reason why it holds.
A result the paper reports from its own data — it cites no other source for it, so there is none to check. The quote shows it is in the paper.
In the paper
“We observed that the over-representation of binding motifs was very specific to the direction of the DNA methylation change (hypomethylation or hypermethylation).”
§ PU.1 target genes undergo Tet2-coupled demethylation and DNMT3b-mediated methylation in monocyte-to-osteoclast differentiation > Results > Sequences undergoing DNA methylation changes are enriched for binding motifs for AP-1, NF-kB, and PU.1, key transcription factors in osteoclastogenesis
plaincorrelational- Asserted: passes — The authors put it forward as true.
- Checkable: passes — It can be checked against evidence.
- Load-bearing: passes — The paper’s conclusions depend on it.
- Based: passes — The paper gives a reason why it holds.
A result the paper reports from its own data — it cites no other source for it, so there is none to check. The quote shows it is in the paper.
In the paper
“We also observed enrichment of PU.1 (FDR 1.07E-12).”
§ PU.1 target genes undergo Tet2-coupled demethylation and DNMT3b-mediated methylation in monocyte-to-osteoclast differentiation > Results > Sequences undergoing DNA methylation changes are enriched for binding motifs for AP-1, NF-kB, and PU.1, key transcription factors in osteoclastogenesis
plaincorrelational- Asserted: passes — The authors put it forward as true.
- Checkable: passes — It can be checked against evidence.
- Load-bearing: passes — The paper’s conclusions depend on it.
- Based: passes — The paper gives a reason why it holds.
A result the paper reports from its own data — it cites no other source for it, so there is none to check. The quote shows it is in the paper.
In the paper
“In fact, around 60% of the entire range of hypomethylation occurred between days 0 and 4.”
§ PU.1 target genes undergo Tet2-coupled demethylation and DNMT3b-mediated methylation in monocyte-to-osteoclast differentiation > Results > Hypomethylation is replication-independent and involves changes in 5-hydroxymethylcytosine
plaincorrelationaln = 3- Asserted: passes — The authors put it forward as true.
- Checkable: passes — It can be checked against evidence.
- Load-bearing: unclear — It is unclear whether the paper’s conclusions depend on it.
- Based: passes — The paper gives a reason why it holds.
A result the paper reports from its own data — it cites no other source for it, so there is none to check. The quote shows it is in the paper.
In the paper
“In fact, we found that hypermethylation affects genes that are specific to other cellular types.”
§ PU.1 target genes undergo Tet2-coupled demethylation and DNMT3b-mediated methylation in monocyte-to-osteoclast differentiation > Discussion
plaincorrelational- Asserted: passes — The authors put it forward as true.
- Checkable: passes — It can be checked against evidence.
- Load-bearing: unclear — It is unclear whether the paper’s conclusions depend on it.
- Based: passes — The paper gives a reason why it holds.
A result the paper reports from its own data — it cites no other source for it, so there is none to check. The quote shows it is in the paper.
In the paper
“we observed that PU.1 dowregulation resulted in a decrease of the levels of PU.1 associated with the promoters of both hypo- and hypermethylated genes.”
§ PU.1 target genes undergo Tet2-coupled demethylation and DNMT3b-mediated methylation in monocyte-to-osteoclast differentiation > Results > Dowregulation of PU.1 in MOs impairs activation of OC markers, hypomethylation, and recruitment of DNMT3b and TET2
plaindirect- Asserted: passes — The authors put it forward as true.
- Checkable: passes — It can be checked against evidence.
- Load-bearing: passes — The paper’s conclusions depend on it.
- Based: passes — The paper gives a reason why it holds.
A result the paper reports from its own data — it cites no other source for it, so there is none to check. The quote shows it is in the paper.
In the paper
“PU.1-siRNA treatment had only small effects on gene expression changes during osteoclast differentiation (perhaps due to indirect effects) when compared to control siRNA, confirming the specificity of the changes observed for the other genes (Figure 5D, bottom).”
§ PU.1 target genes undergo Tet2-coupled demethylation and DNMT3b-mediated methylation in monocyte-to-osteoclast differentiation > Results > Dowregulation of PU.1 in MOs impairs activation of OC markers, hypomethylation, and recruitment of DNMT3b and TET2
hedged- Asserted: passes — The authors put it forward as true.
- Checkable: passes — It can be checked against evidence.
- Load-bearing: passes — The paper’s conclusions depend on it.
- Based: passes — The paper gives a reason why it holds.
A result the paper reports from its own data — it cites no other source for it, so there is none to check. The quote shows it is in the paper.
In the paper
“In both cases, we observed that downregulation of PU.1 impaired the acquisition of DNA methylation changes, in contrast with the changes observed for control siRNA-treated MOs (Figure 5D).”
§ PU.1 target genes undergo Tet2-coupled demethylation and DNMT3b-mediated methylation in monocyte-to-osteoclast differentiation > Results > Dowregulation of PU.1 in MOs impairs activation of OC markers, hypomethylation, and recruitment of DNMT3b and TET2
plaindirect- Asserted: passes — The authors put it forward as true.
- Checkable: passes — It can be checked against evidence.
- Load-bearing: passes — The paper’s conclusions depend on it.
- Based: passes — The paper gives a reason why it holds.
A result the paper reports from its own data — it cites no other source for it, so there is none to check. The quote shows it is in the paper.
In the paper
“In the case of NF-kB, we did not observe binding with either of these factors (Figure 4C).”
§ PU.1 target genes undergo Tet2-coupled demethylation and DNMT3b-mediated methylation in monocyte-to-osteoclast differentiation > Results > PU.1 recruits DNMT3b and TET2 to hypermethylated and hypomethylated genes
plain- Asserted: passes — The authors put it forward as true.
- Checkable: passes — It can be checked against evidence.
- Load-bearing: unclear — It is unclear whether the paper’s conclusions depend on it.
- Based: passes — The paper gives a reason why it holds.
A result the paper reports from its own data — it cites no other source for it, so there is none to check. The quote shows it is in the paper.
In the paper
“Among these, PU.1 and other ETS-related binding motifs are highly enriched in both hypomethylated and hypermethylated genes.”
§ PU.1 target genes undergo Tet2-coupled demethylation and DNMT3b-mediated methylation in monocyte-to-osteoclast differentiation > Conclusions
plaincorrelational- Asserted: passes — The authors put it forward as true.
- Checkable: passes — It can be checked against evidence.
- Load-bearing: passes — The paper’s conclusions depend on it.
- Based: passes — The paper gives a reason why it holds.
A result the paper reports from its own data — it cites no other source for it, so there is none to check. The quote shows it is in the paper.
In the paper
“The analysis of over-representation of transcription factor binding motifs reveals the enrichment of specific motifs for hypomethylated and hypermethylated genes.”
§ PU.1 target genes undergo Tet2-coupled demethylation and DNMT3b-mediated methylation in monocyte-to-osteoclast differentiation > Conclusions
plaincorrelational- Asserted: passes — The authors put it forward as true.
- Checkable: passes — It can be checked against evidence.
- Load-bearing: passes — The paper’s conclusions depend on it.
- Based: passes — The paper gives a reason why it holds.
A result the paper reports from its own data — it cites no other source for it, so there is none to check. The quote shows it is in the paper.
In the paper
“Also, when comparing the dynamics of DNA methylation and expression changes, hypomethylation occurs concomitant or even earlier than expression changes.”
§ PU.1 target genes undergo Tet2-coupled demethylation and DNMT3b-mediated methylation in monocyte-to-osteoclast differentiation > Conclusions
plaincorrelational- Asserted: passes — The authors put it forward as true.
- Checkable: passes — It can be checked against evidence.
- Load-bearing: passes — The paper’s conclusions depend on it.
- Based: passes — The paper gives a reason why it holds.
A result the paper reports from its own data — it cites no other source for it, so there is none to check. The quote shows it is in the paper.
In the paper
“In contrast, for the majority of genes becoming hypermethylated, hypermethylation follows expression changes.”
§ PU.1 target genes undergo Tet2-coupled demethylation and DNMT3b-mediated methylation in monocyte-to-osteoclast differentiation > Conclusions
plaincorrelational- Asserted: passes — The authors put it forward as true.
- Checkable: passes — It can be checked against evidence.
- Load-bearing: passes — The paper’s conclusions depend on it.
- Based: passes — The paper gives a reason why it holds.
A result the paper reports from its own data — it cites no other source for it, so there is none to check. The quote shows it is in the paper.
In the paper
“Our study of the DNA methylation changes in monocyte-to-osteoclast differentiation reveals the occurrence of both hypomethylation and hypermethylation changes.”
§ PU.1 target genes undergo Tet2-coupled demethylation and DNMT3b-mediated methylation in monocyte-to-osteoclast differentiation > Conclusions
plain- Asserted: passes — The authors put it forward as true.
- Checkable: passes — It can be checked against evidence.
- Load-bearing: passes — The paper’s conclusions depend on it.
- Based: passes — The paper gives a reason why it holds.
What the paper did — it cites no source for this, so there is none to check. The quote shows it is in the paper.
In the paper
“In all cases, bisulfite pyrosequencing confirmed the results of the beadchip array”
§ PU.1 target genes undergo Tet2-coupled demethylation and DNMT3b-mediated methylation in monocyte-to-osteoclast differentiation > Results > Cell differentiation and fusion in osteoclastogenesis are accompanied by hypomethylation and hypermethylation of key functional pathways and genes
plaincorrelational- Asserted: passes — The authors put it forward as true.
- Checkable: passes — It can be checked against evidence.
- Load-bearing: unclear — It is unclear whether the paper’s conclusions depend on it.
- Based: passes — The paper gives a reason why it holds.
What the paper did — it cites no source for this, so there is none to check. The quote shows it is in the paper.
In the paper
“At 21 days, over 84% of the nuclei detected in these preparations could be considered to be osteoclastic nuclei”
§ PU.1 target genes undergo Tet2-coupled demethylation and DNMT3b-mediated methylation in monocyte-to-osteoclast differentiation > Results > Cell differentiation and fusion in osteoclastogenesis are accompanied by hypomethylation and hypermethylation of key functional pathways and genes
hedgedn = 3- Asserted: passes — The authors put it forward as true.
- Checkable: passes — It can be checked against evidence.
- Load-bearing: passes — The paper’s conclusions depend on it.
- Based: passes — The paper gives a reason why it holds.
A conclusion the paper draws from its own results — it cites no other source for it, so there is none to check. The quote shows it is in the paper.
In the paper
“Our results suggested that PU.1 may play a dual coupling transcription factor that can interact with the DNA methyltransferases and enzymes perhaps participating in, or leading to, demethylation.”
- Also stated in: § Discussion · hedged
“Our study shows that PU.1 may act as a dual adaptor during osteoclastogenesis, in the directions of hypomethylation and hypermethylation.”
- Also stated in: § Discussion · plain
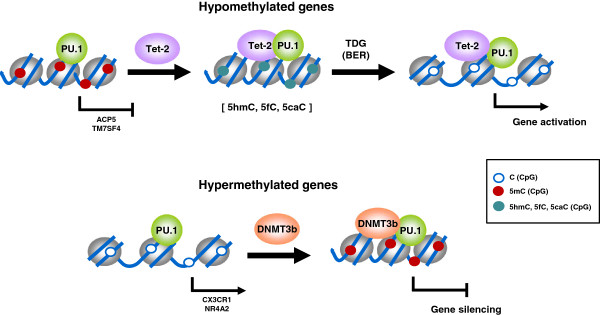
“Therefore, our data reveal a novel role of PU.1 as a dual adaptor with the ability to bind both epigenetically repressive and epigenetically activating events and targeting DNA methylation changes in both directions (Figure 6).”
§ PU.1 target genes undergo Tet2-coupled demethylation and DNMT3b-mediated methylation in monocyte-to-osteoclast differentiation > Results > PU.1 recruits DNMT3b and TET2 to hypermethylated and hypomethylated genes
plainconditional- Asserted: passes — The authors put it forward as true.
- Checkable: passes — It can be checked against evidence.
- Load-bearing: passes — The paper’s conclusions depend on it.
- Based: passes — The paper gives a reason why it holds.
- Also stated in: § Discussion · hedged
A conclusion the paper draws from its own results — it cites no other source for it, so there is none to check. The quote shows it is in the paper.
In the paper
“Our results provide evidence of the participation of transcription factors, focusing on PU.1, in determining changes in DNA methylation during monocyte-to-osteoclast differentiation.”
§ PU.1 target genes undergo Tet2-coupled demethylation and DNMT3b-mediated methylation in monocyte-to-osteoclast differentiation > Discussion
plainconditional- Asserted: passes — The authors put it forward as true.
- Checkable: passes — It can be checked against evidence.
- Load-bearing: passes — The paper’s conclusions depend on it.
- Based: passes — The paper gives a reason why it holds.
A conclusion the paper draws from its own results — it cites no other source for it, so there is none to check. The quote shows it is in the paper.
In the paper
“This implies that the large DNA methylation changes observed in this time period are independent of DNA replication.”
§ PU.1 target genes undergo Tet2-coupled demethylation and DNMT3b-mediated methylation in monocyte-to-osteoclast differentiation > Results > Hypomethylation is replication-independent and involves changes in 5-hydroxymethylcytosine
plain- Asserted: passes — The authors put it forward as true.
- Checkable: passes — It can be checked against evidence.
- Load-bearing: passes — The paper’s conclusions depend on it.
- Based: passes — The paper gives a reason why it holds.
A conclusion the paper draws from its own results — it cites no other source for it, so there is none to check. The quote shows it is in the paper.
In the paper
“Our study suggests that both hypomethylation and hypermethylation events are equally important.”
§ PU.1 target genes undergo Tet2-coupled demethylation and DNMT3b-mediated methylation in monocyte-to-osteoclast differentiation > Discussion
hedged- Asserted: passes — The authors put it forward as true.
- Checkable: passes — It can be checked against evidence.
- Load-bearing: passes — The paper’s conclusions depend on it.
- Based: passes — The paper gives a reason why it holds.
A conclusion the paper draws from its own results — it cites no other source for it, so there is none to check. The quote shows it is in the paper.
In the paper
“our data show that DNA methylation changes are involved in the differentiation dynamics and stabilization of the OC phenotype since they are concomitant with, or even precede, expression changes.”
§ PU.1 target genes undergo Tet2-coupled demethylation and DNMT3b-mediated methylation in monocyte-to-osteoclast differentiation > Discussion
boosteddirect- Asserted: passes — The authors put it forward as true.
- Checkable: passes — It can be checked against evidence.
- Load-bearing: passes — The paper’s conclusions depend on it.
- Based: passes — The paper gives a reason why it holds.
A conclusion the paper draws from its own results — it cites no other source for it, so there is none to check. The quote shows it is in the paper.
In the paper
“However, in relation with methylation changes, PU.1 appears to be better correlated with those changes in the direction of repression.”
§ PU.1 target genes undergo Tet2-coupled demethylation and DNMT3b-mediated methylation in monocyte-to-osteoclast differentiation > Results > Sequences undergoing DNA methylation changes are enriched for binding motifs for AP-1, NF-kB, and PU.1, key transcription factors in osteoclastogenesis
hedgedcorrelational- Asserted: passes — The authors put it forward as true.
- Checkable: passes — It can be checked against evidence.
- Load-bearing: passes — The paper’s conclusions depend on it.
- Based: passes — The paper gives a reason why it holds.
A conclusion the paper draws from its own results — it cites no other source for it, so there is none to check. The quote shows it is in the paper.
In the paper
“These analyses reinforced the notion of PU.1 associated with a high number of genes undergoing DNA methylation changes”
§ PU.1 target genes undergo Tet2-coupled demethylation and DNMT3b-mediated methylation in monocyte-to-osteoclast differentiation > Results > PU.1 recruits DNMT3b and TET2 to hypermethylated and hypomethylated genes
plaincorrelational- Asserted: passes — The authors put it forward as true.
- Checkable: passes — It can be checked against evidence.
- Load-bearing: passes — The paper’s conclusions depend on it.
- Based: passes — The paper gives a reason why it holds.
A conclusion the paper draws from its own results — it cites no other source for it, so there is none to check. The quote shows it is in the paper.
In the paper
“Second, further analyses on one these candidate transcription factors, PU.1, and manipulation of its levels revealed a novel role for this factor in mediating DNA methylation changes during osteoclastogenesis, by direct binding of both DNMT3B and TET2.”
§ PU.1 target genes undergo Tet2-coupled demethylation and DNMT3b-mediated methylation in monocyte-to-osteoclast differentiation > Discussion
plaindirect- Asserted: passes — The authors put it forward as true.
- Checkable: passes — It can be checked against evidence.
- Load-bearing: passes — The paper’s conclusions depend on it.
- Based: passes — The paper gives a reason why it holds.
None of the sources cited for this claim have been checked yet.
In the paper
“We focused on TET2 given their high levels in hematopoietic cells of myeloid origin [44,45].”
§ PU.1 target genes undergo Tet2-coupled demethylation and DNMT3b-mediated methylation in monocyte-to-osteoclast differentiation > Results > PU.1 recruits DNMT3b and TET2 to hypermethylated and hypomethylated genes
What the sources say
- Not checked yetcites [44] Kallin EM, Rodriguez-Ubreva J, Christensen J, Cimmino L, Aifantis I, Helin K, Ballestar E, Graf T: Tet2 facilitates the derepression of myeloid target genes during CEBPalpha-induced transdifferentiation of pre-B cells. Mol Cell. 2012, 48: 266-276. 10.1016/j.molcel.2012.08.007. source
- Not checked yetcites [45] Klug M, Schmidhofer S, Gebhard C, Andreesen R, Rehli M: 5-Hydroxymethylcytosine is an essential intermediate of active DNA demethylation processes in primary human monocytes. Genome Biol. 2013, 14: R46-10.1186/gb-2013-14-5-r46. source
plain- Asserted: passes — The authors put it forward as true.
- Checkable: passes — It can be checked against evidence.
- Load-bearing: passes — The paper’s conclusions depend on it.
- Based: passes — The paper gives a reason why it holds.
A conclusion the paper draws from its own results — it cites no other source for it, so there is none to check. The quote shows it is in the paper.
In the paper
“Hypomethylation events, in many cases associated with gene activation, affect genes that are specific to this differentiation process or are related with the function of differentiated OCs.”
§ PU.1 target genes undergo Tet2-coupled demethylation and DNMT3b-mediated methylation in monocyte-to-osteoclast differentiation > Discussion
plaincorrelational- Asserted: passes — The authors put it forward as true.
- Checkable: passes — It can be checked against evidence.
- Load-bearing: passes — The paper’s conclusions depend on it.
- Based: passes — The paper gives a reason why it holds.
A conclusion the paper draws from its own results — it cites no other source for it, so there is none to check. The quote shows it is in the paper.
In the paper
“our results suggested the participation of hydroxymethylation, and therefore the activity of Tet proteins, in genes that undergo a reduction in DNA methylation.”
§ PU.1 target genes undergo Tet2-coupled demethylation and DNMT3b-mediated methylation in monocyte-to-osteoclast differentiation > Results > Hypomethylation is replication-independent and involves changes in 5-hydroxymethylcytosine
hedgedconditional- Asserted: passes — The authors put it forward as true.
- Checkable: passes — It can be checked against evidence.
- Load-bearing: passes — The paper’s conclusions depend on it.
- Based: passes — The paper gives a reason why it holds.
A conclusion the paper draws from its own results — it cites no other source for it, so there is none to check. The quote shows it is in the paper.
In the paper
“Genes that become hypomethylated exchange PU.1-DNMT3b by PU.1-TET2 (although whether pre-existing subpopulations of these associations may exist or, alternatively, post-translational or another mechanisms may mediate exchange of TET2 and DNMT3b; this is not elucidated at present).”
§ PU.1 target genes undergo Tet2-coupled demethylation and DNMT3b-mediated methylation in monocyte-to-osteoclast differentiation > Discussion
hedgeddirect- Asserted: passes — The authors put it forward as true.
- Checkable: passes — It can be checked against evidence.
- Load-bearing: passes — The paper’s conclusions depend on it.
- Based: passes — The paper gives a reason why it holds.
A conclusion the paper draws from its own results — it cites no other source for it, so there is none to check. The quote shows it is in the paper.
In the paper
“However, this is the first report where the association between PU.1 and DNMTs in association with gene repression is shown in this context.”
§ PU.1 target genes undergo Tet2-coupled demethylation and DNMT3b-mediated methylation in monocyte-to-osteoclast differentiation > Discussion
plaincorrelational- Asserted: passes — The authors put it forward as true.
- Checkable: passes — It can be checked against evidence.
- Load-bearing: passes — The paper’s conclusions depend on it.
- Based: passes — The paper gives a reason why it holds.
A conclusion the paper draws from its own results — it cites no other source for it, so there is none to check. The quote shows it is in the paper.
In the paper
“Hypermethylated genes experience an increase in the binding of DNMT3b as differentiation to OCs is triggered.”
§ PU.1 target genes undergo Tet2-coupled demethylation and DNMT3b-mediated methylation in monocyte-to-osteoclast differentiation > Discussion
plaindirect- Asserted: passes — The authors put it forward as true.
- Checkable: passes — It can be checked against evidence.
- Load-bearing: passes — The paper’s conclusions depend on it.
- Based: passes — The paper gives a reason why it holds.
A conclusion the paper draws from its own results — it cites no other source for it, so there is none to check. The quote shows it is in the paper.
In the paper
“The manipulation of PU.1 levels by using siRNAs has shown that PU.1 has a direct role in recruiting DNMT3b and TET2 to its target promoters”
§ PU.1 target genes undergo Tet2-coupled demethylation and DNMT3b-mediated methylation in monocyte-to-osteoclast differentiation > Discussion
plaindirect- Asserted: passes — The authors put it forward as true.
- Checkable: passes — It can be checked against evidence.
- Load-bearing: passes — The paper’s conclusions depend on it.
- Based: passes — The paper gives a reason why it holds.
A conclusion the paper draws from its own results — it cites no other source for it, so there is none to check. The quote shows it is in the paper.
In the paper
“The incomplete impairment of DNA methylation and expression changes, as well as partial loss of Tet2 and DNMT3b following PU.1 knock-down indicates that additional transcription factors are also participating in this process.”
§ PU.1 target genes undergo Tet2-coupled demethylation and DNMT3b-mediated methylation in monocyte-to-osteoclast differentiation > Discussion
hedgeddirect- Asserted: passes — The authors put it forward as true.
- Checkable: passes — It can be checked against evidence.
- Load-bearing: unclear — It is unclear whether the paper’s conclusions depend on it.
- Based: passes — The paper gives a reason why it holds.
What the paper did — it cites no source for this, so there is none to check. The quote shows it is in the paper.
In the paper
“We used several methods to determine that on day 21 almost 85% of the nuclei detected were ‘osteoclastic nuclei’ (in polykaryons, nuclei and not cells were quantified).”
§ PU.1 target genes undergo Tet2-coupled demethylation and DNMT3b-mediated methylation in monocyte-to-osteoclast differentiation > Materials and methods > Differentiation of OCs from peripheral blood mononuclear cells
plain- Asserted: passes — The authors put it forward as true.
- Checkable: passes — It can be checked against evidence.
- Load-bearing: unclear — It is unclear whether the paper’s conclusions depend on it.
- Based: passes — The paper gives a reason why it holds.
A conclusion the paper draws from its own results — it cites no other source for it, so there is none to check. The quote shows it is in the paper.
In the paper
“Moreover, our findings constitute the first report where the binding of PU.1 to TET2 has been described.”
§ PU.1 target genes undergo Tet2-coupled demethylation and DNMT3b-mediated methylation in monocyte-to-osteoclast differentiation > Discussion
boostedcorrelational- Asserted: passes — The authors put it forward as true.
- Checkable: passes — It can be checked against evidence.
- Load-bearing: passes — The paper’s conclusions depend on it.
- Based: passes — The paper gives a reason why it holds.
- Probably not a substantial claim. 21
- It may state two separate claims as one. 31
- The quote only partly states this claim. 1
Every source the paper cites for this claim was checked and supports it.
In the paper
“TET proteins are responsible for conversion of 5mC in 5hmC [34], 5fC, and 5cac [36].”
§ PU.1 target genes undergo Tet2-coupled demethylation and DNMT3b-mediated methylation in monocyte-to-osteoclast differentiation > Results > PU.1 recruits DNMT3b and TET2 to hypermethylated and hypomethylated genes
What the sources say
- Supportedcites [34] Tahiliani M, Koh KP, Shen Y, Pastor WA, Bandukwala H, Brudno Y, Agarwal S, Iyer LM, Liu DR, Aravind L, Rao A: Conversion of 5-methylcytosine to 5-hydroxymethylcytosine in mammalian DNA by MLL partner TET1. Science. 2009, 324: 930-935. 10.1126/science.1170116. source
Citation [34] is attached to the conversion of 5mC to 5hmC, not to the later products cited to [36]. The paper’s Abstract and its account of the purified-protein experiments state that TET1 catalyzes that conversion; no page number is supplied in our copy. (LLM, conf=0.94)
- Supportedcites [36] Ito S, Shen L, Dai Q, Wu SC, Collins LB, Swenberg JA, He C, Zhang Y: Tet proteins can convert 5-methylcytosine to 5-formylcytosine and 5-carboxylcytosine. Science. 2011, 333: 1300-1303. 10.1126/science.1210597. source
The passage labeled Abstract states that Tet proteins convert 5mC not only to 5hmC but also to 5fC and 5caC. This directly supports the 5fC and 5caC portion attached to this citation; it also supports the broader paraphrase. (LLM, conf=0.94)
plaindirect- Asserted: passes — The authors put it forward as true.
- Checkable: passes — It can be checked against evidence.
- Load-bearing: passes — The paper’s conclusions depend on it.
- Based: passes — The paper gives a reason why it holds.
Probably not a substantial claim.
- Supported
A result the paper reports from its own data — it cites no other source for it, so there is none to check. The quote shows it is in the paper.
In the paper
“Specifically, we identified 1,895 hypomethylated genes (3,597 CpG sites) and 2,054 hypermethylated genes (4,429 CpGs)”
§ PU.1 target genes undergo Tet2-coupled demethylation and DNMT3b-mediated methylation in monocyte-to-osteoclast differentiation > Results > Cell differentiation and fusion in osteoclastogenesis are accompanied by hypomethylation and hypermethylation of key functional pathways and genes
plainn = 3- Asserted: passes — The authors put it forward as true.
- Checkable: passes — It can be checked against evidence.
- Load-bearing: passes — The paper’s conclusions depend on it.
- Based: passes — The paper gives a reason why it holds.
It may state two separate claims as one.
A result the paper reports from its own data — it cites no other source for it, so there is none to check. The quote shows it is in the paper.
In the paper
“siRNA-mediated PU.1 knockdown in primary monocytes impaired the acquisition of DNA methylation and expression changes, and reduced the association of TET2 and DNMT3b at PU.1 targets during osteoclast differentiation.”
§ PU.1 target genes undergo Tet2-coupled demethylation and DNMT3b-mediated methylation in monocyte-to-osteoclast differentiation > Abstract > Results
plaindirect- Asserted: passes — The authors put it forward as true.
- Checkable: passes — It can be checked against evidence.
- Load-bearing: passes — The paper’s conclusions depend on it.
- Based: passes — The paper gives a reason why it holds.
It may state two separate claims as one.
A result the paper reports from its own data — it cites no other source for it, so there is none to check. The quote shows it is in the paper.
In the paper
“We observed very high significance for terms like immune response (FDR = 4.25E-25) and signal transduction (FDR = 1.45E-21), but also more specific categories such as ruffle organization (FDR = 9.91E-2), calcium ion transport (FDR = 4.6E-2), and OC differentiation (FDR = 1.94E-1).”
§ PU.1 target genes undergo Tet2-coupled demethylation and DNMT3b-mediated methylation in monocyte-to-osteoclast differentiation > Results > Cell differentiation and fusion in osteoclastogenesis are accompanied by hypomethylation and hypermethylation of key functional pathways and genes
plaincorrelational- Asserted: passes — The authors put it forward as true.
- Checkable: passes — It can be checked against evidence.
- Load-bearing: passes — The paper’s conclusions depend on it.
- Based: passes — The paper gives a reason why it holds.
It may state two separate claims as one. The quote only partly states this claim.
In the paper
“The 0-to-20-day comparison showed that 2,895 genes were upregulated (FC >2; FDR <0.05) and 1,858 were downregulated (FC <0.5; FDR <0.05).”
§ PU.1 target genes undergo Tet2-coupled demethylation and DNMT3b-mediated methylation in monocyte-to-osteoclast differentiation > Results > Hypomethylation is replication-independent and involves changes in 5-hydroxymethylcytosine
What the sources say
- Not checked yetcites [32] Gallois A, Lachuer J, Yvert G, Wierinckx A, Brunet F, Rabourdin-Combe C, Delprat C, Jurdic P, Mazzorana M: Genome-wide expression analyses establish dendritic cells as a new osteoclast precursor able to generate bone-resorbing cells more efficiently than monocytes. J Bone Miner Res. 2010, 25: 661-672. 10.1359/jbmr.090829. source
plain- Asserted: passes — The authors put it forward as true.
- Checkable: passes — It can be checked against evidence.
- Load-bearing: unclear — It is unclear whether the paper’s conclusions depend on it.
- Based: passes — The paper gives a reason why it holds.
It may state two separate claims as one.
A result the paper reports from its own data — it cites no other source for it, so there is none to check. The quote shows it is in the paper.
In the paper
“In the case of hypermethylated genes, we also found highly significant enrichment of signal transduction (FDR = 4.09E-17), and enrichment of categories related to other hematopoietic cell types”
§ PU.1 target genes undergo Tet2-coupled demethylation and DNMT3b-mediated methylation in monocyte-to-osteoclast differentiation > Results > Cell differentiation and fusion in osteoclastogenesis are accompanied by hypomethylation and hypermethylation of key functional pathways and genes
plaincorrelational- Asserted: passes — The authors put it forward as true.
- Checkable: passes — It can be checked against evidence.
- Load-bearing: passes — The paper’s conclusions depend on it.
- Based: passes — The paper gives a reason why it holds.
It may state two separate claims as one.
A result the paper reports from its own data — it cites no other source for it, so there is none to check. The quote shows it is in the paper.
In the paper
“reveals that all relevant functional categories and the majority of key genes for differentiation or the activity of functional OCs undergo DNA methylation changes and that genes within all relevant functional categories undergo DNA methylation changes.”
§ PU.1 target genes undergo Tet2-coupled demethylation and DNMT3b-mediated methylation in monocyte-to-osteoclast differentiation > Discussion
plaincorrelational- Asserted: passes — The authors put it forward as true.
- Checkable: passes — It can be checked against evidence.
- Load-bearing: passes — The paper’s conclusions depend on it.
- Based: passes — The paper gives a reason why it holds.
It may state two separate claims as one.
A result the paper reports from its own data — it cites no other source for it, so there is none to check. The quote shows it is in the paper.
In the paper
“Interestingly, the analysis of the presence of transcription factor binding sites in sequences that undergo DNA methylation changes shows a significant enrichment in binding motifs of transcription factors that are key in OC differentiation, some of which we have validated for a selection of putative target genes.”
§ PU.1 target genes undergo Tet2-coupled demethylation and DNMT3b-mediated methylation in monocyte-to-osteoclast differentiation > Discussion
plaincorrelational- Asserted: passes — The authors put it forward as true.
- Checkable: passes — It can be checked against evidence.
- Load-bearing: unclear — It is unclear whether the paper’s conclusions depend on it.
- Based: passes — The paper gives a reason why it holds.
It may state two separate claims as one.
A result the paper reports from its own data — it cites no other source for it, so there is none to check. The quote shows it is in the paper.
In the paper
“Our results showed that PU.1 directly interacted with both DNMT3b and TET2 (Figure 4C).”
- Also stated in: § PU.1 recruits DNMT3b and TET2 to hypermethylated and hypomethylated genes · boosted
“These confirmed the direct interaction with PU.1 (Figure 4C).”
§ PU.1 target genes undergo Tet2-coupled demethylation and DNMT3b-mediated methylation in monocyte-to-osteoclast differentiation > Results > PU.1 recruits DNMT3b and TET2 to hypermethylated and hypomethylated genes
boosteddirect- Asserted: passes — The authors put it forward as true.
- Checkable: passes — It can be checked against evidence.
- Load-bearing: passes — The paper’s conclusions depend on it.
- Based: passes — The paper gives a reason why it holds.
It may state two separate claims as one.
- Also stated in: § PU.1 recruits DNMT3b and TET2 to hypermethylated and hypomethylated genes · boosted
A result the paper reports from its own data — it cites no other source for it, so there is none to check. The quote shows it is in the paper.
In the paper
“Comparing DNA methylation and expression data revealed that 452 genes were both hypomethylated and overexpressed and 280 genes were both hypermethylated and repressed at the selected thresholds”
§ PU.1 target genes undergo Tet2-coupled demethylation and DNMT3b-mediated methylation in monocyte-to-osteoclast differentiation > Results > Hypomethylation is replication-independent and involves changes in 5-hydroxymethylcytosine
plaincorrelational- Asserted: passes — The authors put it forward as true.
- Checkable: passes — It can be checked against evidence.
- Load-bearing: passes — The paper’s conclusions depend on it.
- Based: passes — The paper gives a reason why it holds.
It may state two separate claims as one.
A result the paper reports from its own data — it cites no other source for it, so there is none to check. The quote shows it is in the paper.
In the paper
“In fact, 39% of all hypomethylated genes had binding motifs for AP-1, 15% genes had NF-kB binding motifs, and another 15% genes had binding motifs for PU.1 or other ETS-related factors (PU.1 alone, 9%)”
§ PU.1 target genes undergo Tet2-coupled demethylation and DNMT3b-mediated methylation in monocyte-to-osteoclast differentiation > Results > Sequences undergoing DNA methylation changes are enriched for binding motifs for AP-1, NF-kB, and PU.1, key transcription factors in osteoclastogenesis
plaincorrelational- Asserted: passes — The authors put it forward as true.
- Checkable: passes — It can be checked against evidence.
- Load-bearing: passes — The paper’s conclusions depend on it.
- Based: passes — The paper gives a reason why it holds.
It may state two separate claims as one.
A result the paper reports from its own data — it cites no other source for it, so there is none to check. The quote shows it is in the paper.
In the paper
“In genes that become hypermethylated (CX3CR1 and NR4A2), we also observed association of PU.1 at both 0 and 2 days. However we again observed a slight decrease at 2 days together.”
§ PU.1 target genes undergo Tet2-coupled demethylation and DNMT3b-mediated methylation in monocyte-to-osteoclast differentiation > Results > PU.1 recruits DNMT3b and TET2 to hypermethylated and hypomethylated genes
plaincorrelational- Asserted: passes — The authors put it forward as true.
- Checkable: passes — It can be checked against evidence.
- Load-bearing: passes — The paper’s conclusions depend on it.
- Based: passes — The paper gives a reason why it holds.
It may state two separate claims as one.
A result the paper reports from its own data — it cites no other source for it, so there is none to check. The quote shows it is in the paper.
In the paper
“we also confirmed the presence of DNMT3b, a de novo DNA methyltransferase, and the ten eleven translocation (TET) protein TET2, as enzymatic activities potentially related with DNA demethylation (Figure 4A and 4B).”
§ PU.1 target genes undergo Tet2-coupled demethylation and DNMT3b-mediated methylation in monocyte-to-osteoclast differentiation > Results > PU.1 recruits DNMT3b and TET2 to hypermethylated and hypomethylated genes
hedged- Asserted: passes — The authors put it forward as true.
- Checkable: passes — It can be checked against evidence.
- Load-bearing: passes — The paper’s conclusions depend on it.
- Based: passes — The paper gives a reason why it holds.
It may state two separate claims as one.
A result the paper reports from its own data — it cites no other source for it, so there is none to check. The quote shows it is in the paper.
In the paper
“The two activities are very specific to particular gene sets and there are no indications of changes in repetitive elements.”
§ PU.1 target genes undergo Tet2-coupled demethylation and DNMT3b-mediated methylation in monocyte-to-osteoclast differentiation > Discussion
plain- Asserted: passes — The authors put it forward as true.
- Checkable: passes — It can be checked against evidence.
- Load-bearing: unclear — It is unclear whether the paper’s conclusions depend on it.
- Based: passes — The paper gives a reason why it holds.
It may state two separate claims as one.
A result the paper reports from its own data — it cites no other source for it, so there is none to check. The quote shows it is in the paper.
In the paper
“These data are closely correlated with gene expression changes, and a majority of genes that undergo hypomethylation or hypermethylation at their promoters or gene bodies also experience a change in expression, although the relationship varies between different gene sets.”
§ PU.1 target genes undergo Tet2-coupled demethylation and DNMT3b-mediated methylation in monocyte-to-osteoclast differentiation > Discussion
plaincorrelational- Asserted: passes — The authors put it forward as true.
- Checkable: passes — It can be checked against evidence.
- Load-bearing: passes — The paper’s conclusions depend on it.
- Based: passes — The paper gives a reason why it holds.
It may state two separate claims as one.
A result the paper reports from its own data — it cites no other source for it, so there is none to check. The quote shows it is in the paper.
In the paper
“At any rate, the observed effects only occurred in PU.1 targets. It did not affect genes that are not targeted by PU.1 (PLA2G4E, FSCN3).”
§ PU.1 target genes undergo Tet2-coupled demethylation and DNMT3b-mediated methylation in monocyte-to-osteoclast differentiation > Results > Dowregulation of PU.1 in MOs impairs activation of OC markers, hypomethylation, and recruitment of DNMT3b and TET2
plain- Asserted: passes — The authors put it forward as true.
- Checkable: passes — It can be checked against evidence.
- Load-bearing: passes — The paper’s conclusions depend on it.
- Based: passes — The paper gives a reason why it holds.
It may state two separate claims as one.
A result the paper reports from its own data — it cites no other source for it, so there is none to check. The quote shows it is in the paper.
In the paper
“In fact TET1 and TET3 were undetectable in western blot (not shown) and qRT-PCR evidenced their low levels in this cell type (Figure 4A, only shown for TET1).”
§ PU.1 target genes undergo Tet2-coupled demethylation and DNMT3b-mediated methylation in monocyte-to-osteoclast differentiation > Results > PU.1 recruits DNMT3b and TET2 to hypermethylated and hypomethylated genes
plain- Asserted: passes — The authors put it forward as true.
- Checkable: passes — It can be checked against evidence.
- Load-bearing: passes — The paper’s conclusions depend on it.
- Based: passes — The paper gives a reason why it holds.
It may state two separate claims as one.
A result the paper reports from its own data — it cites no other source for it, so there is none to check. The quote shows it is in the paper.
In the paper
“Hypomethylation takes place in relevant functional categories related with OC differentiation and most of the genes that are necessary for OC function undergo hypomethylation including ACP5, CTSK, and TM7SF4 among others.”
§ PU.1 target genes undergo Tet2-coupled demethylation and DNMT3b-mediated methylation in monocyte-to-osteoclast differentiation > Conclusions
plaincorrelational- Asserted: passes — The authors put it forward as true.
- Checkable: passes — It can be checked against evidence.
- Load-bearing: passes — The paper’s conclusions depend on it.
- Based: passes — The paper gives a reason why it holds.
It may state two separate claims as one.
None of the sources cited for this claim have been checked yet.
In the paper
“MOs stimulated with RANKL and M-CSF generate functional OCs [27], which degrade bone and express OC markers [28].”
§ PU.1 target genes undergo Tet2-coupled demethylation and DNMT3b-mediated methylation in monocyte-to-osteoclast differentiation > Background
What the sources say
- Not checked yetcites [27] Nicholson GC, Malakellis M, Collier FM, Cameron PU, Holloway WR, Gough TJ, Gregorio-King C, Kirkland MA, Myers DE: Induction of osteoclasts from CD14-positive human peripheral blood mononuclear cells by receptor activator of nuclear factor kappaB ligand (RANKL). Clin Sci (Lond). 2000, 99: 133-140. 10.1042/CS19990355. source
- Not checked yetcites [28] Sorensen MG, Henriksen K, Schaller S, Henriksen DB, Nielsen FC, Dziegiel MH, Karsdal MA: Characterization of osteoclasts derived from CD14+ monocytes isolated from peripheral blood. J Bone Miner Metab. 2007, 25: 36-45. source
plaindirect- Asserted: passes — The authors put it forward as true.
- Checkable: passes — It can be checked against evidence.
- Load-bearing: passes — The paper’s conclusions depend on it.
- Based: passes — The paper gives a reason why it holds.
Probably not a substantial claim. It may state two separate claims as one.
None of the sources cited for this claim have been checked yet.
In the paper
“however very few reports have analyzed the role of epigenetic changes during osteoclastogenesis, and these focus mainly on histone modifications [29,30].”
§ PU.1 target genes undergo Tet2-coupled demethylation and DNMT3b-mediated methylation in monocyte-to-osteoclast differentiation > Background
What the sources say
- Not checked yetcites [29] Youn MY, Takada I, Imai Y, Yasuda H, Kato S: Transcriptionally active nuclei are selective in mature multinucleated osteoclasts. Genes Cells. 2010, 15: 1025-1035. 10.1111/j.1365-2443.2010.01441.x. source
- Not checked yetcites [30] Saltman LH, Javed A, Ribadeneyra J, Hussain S, Young DW, Osdoby P, Amcheslavsky A, van Wijnen AJ, Stein JL, Stein GS, Lian JB, Bar-Shavit Z: Organization of transcriptional regulatory machinery in osteoclast nuclei: compartmentalization of Runx1. J Cell Physiol. 2005, 204: 871-880. 10.1002/jcp.20329. source
plain- Asserted: passes — The authors put it forward as true.
- Checkable: passes — It can be checked against evidence.
- Load-bearing: passes — The paper’s conclusions depend on it.
- Based: passes — The paper gives a reason why it holds.
It may state two separate claims as one.
What the paper did — it cites no source for this, so there is none to check. The quote shows it is in the paper.
In the paper
“The quality of mature, bone-resorbing OCs obtained under these conditions was confirmed by several methods, including the presence of more than three nuclei in TRAP-positive cells (in some cases, up to 40 nuclei per cell were counted), the upregulation of OC markers, such as CA2, CTSK, ACP5/TRACP, and MMP9, and downregulation of the monocytic gene CX3CR1”
§ PU.1 target genes undergo Tet2-coupled demethylation and DNMT3b-mediated methylation in monocyte-to-osteoclast differentiation > Results > Cell differentiation and fusion in osteoclastogenesis are accompanied by hypomethylation and hypermethylation of key functional pathways and genes
plaincorrelationaln = 3- Asserted: passes — The authors put it forward as true.
- Checkable: passes — It can be checked against evidence.
- Load-bearing: passes — The paper’s conclusions depend on it.
- Based: passes — The paper gives a reason why it holds.
It may state two separate claims as one.
None of the sources cited for this claim have been checked yet.
In the paper
“OCs differentiate from monocyte/macrophage progenitors following M-CSF [5] and RANKL [6] stimulation.”
§ PU.1 target genes undergo Tet2-coupled demethylation and DNMT3b-mediated methylation in monocyte-to-osteoclast differentiation > Background
What the sources say
- Not checked yetcites [5] Wiktor-Jedrzejczak W, Bartocci A, Ferrante AW, Ahmed-Ansari A, Sell KW, Pollard JW, Stanley ER: Total absence of colony-stimulating factor 1 in the macrophage-deficient osteopetrotic (op/op) mouse. Proc Natl Acad Sci USA. 1990, 87: 4828-4832. 10.1073/pnas.87.12.4828. source
- Not checked yetcites [6] Lacey DL, Timms E, Tan HL, Kelley MJ, Dunstan CR, Burgess T, Elliott R, Colombero A, Elliott G, Scully S, et al: Osteoprotegerin ligand is a cytokine that regulates osteoclast differentiation and activation. Cell. 1998, 93: 165-176. 10.1016/S0092-8674(00)81569-X. source
plaindirect- Asserted: passes — The authors put it forward as true.
- Checkable: passes — It can be checked against evidence.
- Load-bearing: passes — The paper’s conclusions depend on it.
- Based: passes — The paper gives a reason why it holds.
Probably not a substantial claim.
A conclusion the paper draws from its own results — it cites no other source for it, so there is none to check. The quote shows it is in the paper.
In the paper
“Together, these data indicate that DNA hypomethylation is targeted to genomic regions that are activated during osteoclastogenesis, and hypermethylation silences alternative lineage genes that are not expressed in OCs.”
§ PU.1 target genes undergo Tet2-coupled demethylation and DNMT3b-mediated methylation in monocyte-to-osteoclast differentiation > Results > Cell differentiation and fusion in osteoclastogenesis are accompanied by hypomethylation and hypermethylation of key functional pathways and genes
hedgeddirect- Asserted: passes — The authors put it forward as true.
- Checkable: passes — It can be checked against evidence.
- Load-bearing: passes — The paper’s conclusions depend on it.
- Based: passes — The paper gives a reason why it holds.
It may state two separate claims as one.
A conclusion the paper draws from its own results — it cites no other source for it, so there is none to check. The quote shows it is in the paper.
In the paper
“First, we have identified the association of PU.1 with genes that become repressed through hypermethylation and describe its direct interaction with DNMT3b in the context of osteoclastogenesis.”
§ PU.1 target genes undergo Tet2-coupled demethylation and DNMT3b-mediated methylation in monocyte-to-osteoclast differentiation > Discussion
plaincorrelational- Asserted: passes — The authors put it forward as true.
- Checkable: passes — It can be checked against evidence.
- Load-bearing: passes — The paper’s conclusions depend on it.
- Based: passes — The paper gives a reason why it holds.
It may state two separate claims as one.
None of the sources cited for this claim have been checked yet.
In the paper
“Recent evidences support a role for TET-dependent active DNA demethylation process [42,43].”
§ PU.1 target genes undergo Tet2-coupled demethylation and DNMT3b-mediated methylation in monocyte-to-osteoclast differentiation > Results > PU.1 recruits DNMT3b and TET2 to hypermethylated and hypomethylated genes
What the sources say
- Not checked yetcites [42] Shen L, Wu H, Diep D, Yamaguchi S, D’Alessio AC, Fung HL, Zhang K, Zhang Y: Genome-wide analysis reveals TET- and TDG-dependent 5-methylcytosine oxidation dynamics. Cell. 2013, 153: 692-706. 10.1016/j.cell.2013.04.002. source
- Not checked yetcites [43] Cortellino S, Xu J, Sannai M, Moore R, Caretti E, Cigliano A, Le Coz M, Devarajan K, Wessels A, Soprano D, Abramowitz LK, Bartolomei MS, Rambow F, Bassi MR, Bruno T, Fanciulli M, Renner C, Klein-Szanto AJ, Matsumoto Y, Kobi D, Davidson I, Alberti C, Larue L, Bellacosa A: Thymine DNA glycosylase is essential for active DNA demethylation by linked deamination-base excision repair. Cell. 2011, 146: 67-79. 10.1016/j.cell.2011.06.020. source
plain- Asserted: passes — The authors put it forward as true.
- Checkable: passes — It can be checked against evidence.
- Load-bearing: fails — The paper’s conclusions may not depend on it.
- Based: passes — The paper gives a reason why it holds.
Probably not a substantial claim. The paper’s conclusions may not depend on it.
In the paper
“recent data shows that TET2 is required for active DNA demethylation in primary human MOs [45].”
§ PU.1 target genes undergo Tet2-coupled demethylation and DNMT3b-mediated methylation in monocyte-to-osteoclast differentiation > Results > PU.1 recruits DNMT3b and TET2 to hypermethylated and hypomethylated genes
What the sources say
- Not checked yetcites [45] Klug M, Schmidhofer S, Gebhard C, Andreesen R, Rehli M: 5-Hydroxymethylcytosine is an essential intermediate of active DNA demethylation processes in primary human monocytes. Genome Biol. 2013, 14: R46-10.1186/gb-2013-14-5-r46. source
plaindirect- Asserted: passes — The authors put it forward as true.
- Checkable: passes — It can be checked against evidence.
- Load-bearing: passes — The paper’s conclusions depend on it.
- Based: passes — The paper gives a reason why it holds.
Probably not a substantial claim.
In the paper
“This is compatible with previous data on genome wide DNA methylation profiling comparing cell types across the hematopietic differentiation system where an over-representation of ETS transcription factor binding sites was found [2].”
§ PU.1 target genes undergo Tet2-coupled demethylation and DNMT3b-mediated methylation in monocyte-to-osteoclast differentiation > Discussion
What the sources say
- Not checked yetcites [2] Hogart A, Lichtenberg J, Ajay SS, Anderson S, Margulies EH, Bodine DM: Genome-wide DNA methylation profiles in hematopoietic stem and progenitor cells reveal overrepresentation of ETS transcription factor binding sites. Genome Res. 2012, 22: 1407-1418. 10.1101/gr.132878.111. source
plaincorrelational- Asserted: passes — The authors put it forward as true.
- Checkable: passes — It can be checked against evidence.
- Load-bearing: fails — The paper’s conclusions may not depend on it.
- Based: passes — The paper gives a reason why it holds.
Probably not a substantial claim. The paper’s conclusions may not depend on it.
A conclusion the paper draws from its own results — it cites no other source for it, so there is none to check. The quote shows it is in the paper.
In the paper
“however, it also reveals the weakness in the predictive power of TRANSFAC motif searches and the need of experimental validation of its results.”
§ PU.1 target genes undergo Tet2-coupled demethylation and DNMT3b-mediated methylation in monocyte-to-osteoclast differentiation > Results > PU.1 recruits DNMT3b and TET2 to hypermethylated and hypomethylated genes
plain- Asserted: passes — The authors put it forward as true.
- Checkable: passes — It can be checked against evidence.
- Load-bearing: passes — The paper’s conclusions depend on it.
- Based: passes — The paper gives a reason why it holds.
It may state two separate claims as one.
In the paper
“This initial analysis was validated in several candidate genes and using ChIPseq data for human primary monocytes [1].”
§ PU.1 target genes undergo Tet2-coupled demethylation and DNMT3b-mediated methylation in monocyte-to-osteoclast differentiation > Discussion
What the sources say
- Not checked yetcites [1] Pham TH, Benner C, Lichtinger M, Schwarzfischer L, Hu Y, Andreesen R, Chen W, Rehli M: Dynamic epigenetic enhancer signatures reveal key transcription factors associated with monocytic differentiation states. Blood. 2012, 119: e161-e171. 10.1182/blood-2012-01-402453. source
plain- Asserted: passes — The authors put it forward as true.
- Checkable: passes — It can be checked against evidence.
- Load-bearing: unclear — It is unclear whether the paper’s conclusions depend on it.
- Based: passes — The paper gives a reason why it holds.
It may state two separate claims as one.
In the paper
“we have recently reported that TET2 plays a role in derepressing genes in pre-B cell to macrophage differentiation [44]”
§ PU.1 target genes undergo Tet2-coupled demethylation and DNMT3b-mediated methylation in monocyte-to-osteoclast differentiation > Results > PU.1 recruits DNMT3b and TET2 to hypermethylated and hypomethylated genes
What the sources say
- Not checked yetcites [44] Kallin EM, Rodriguez-Ubreva J, Christensen J, Cimmino L, Aifantis I, Helin K, Ballestar E, Graf T: Tet2 facilitates the derepression of myeloid target genes during CEBPalpha-induced transdifferentiation of pre-B cells. Mol Cell. 2012, 48: 266-276. 10.1016/j.molcel.2012.08.007. source
plaindirect- Asserted: passes — The authors put it forward as true.
- Checkable: passes — It can be checked against evidence.
- Load-bearing: fails — The paper’s conclusions may not depend on it.
- Based: passes — The paper gives a reason why it holds.
Probably not a substantial claim. The paper’s conclusions may not depend on it.
A conclusion the paper draws from its own results — it cites no other source for it, so there is none to check. The quote shows it is in the paper.
In the paper
“Second, we identify a novel interaction between PU.1 and TET2 and their association with genes that become demethylated.”
§ PU.1 target genes undergo Tet2-coupled demethylation and DNMT3b-mediated methylation in monocyte-to-osteoclast differentiation > Discussion
plaincorrelational- Asserted: passes — The authors put it forward as true.
- Checkable: passes — It can be checked against evidence.
- Load-bearing: passes — The paper’s conclusions depend on it.
- Based: passes — The paper gives a reason why it holds.
It may state two separate claims as one.
What the paper did — it cites no source for this, so there is none to check. The quote shows it is in the paper.
In the paper
“These experiments were performed with three biological replicates.”
§ PU.1 target genes undergo Tet2-coupled demethylation and DNMT3b-mediated methylation in monocyte-to-osteoclast differentiation > Materials and methods > Transfection of primary human MOs
plain- Asserted: passes — The authors put it forward as true.
- Checkable: passes — It can be checked against evidence.
- Load-bearing: fails — The paper’s conclusions may not depend on it.
- Based: passes — The paper gives a reason why it holds.
Probably not a substantial claim. The paper’s conclusions may not depend on it.
What the paper did — it cites no source for this, so there is none to check. The quote shows it is in the paper.
In the paper
“In the case of repetitive elements (Sat2, D4Z4, NBL2, 18S rRNA, and 28 rRNA) we performed standard bisulfite sequencing of a minimum of 10 clones.”
§ PU.1 target genes undergo Tet2-coupled demethylation and DNMT3b-mediated methylation in monocyte-to-osteoclast differentiation > Materials and methods > Bisulfite sequencing and pyrosequencing
plain- Asserted: passes — The authors put it forward as true.
- Checkable: passes — It can be checked against evidence.
- Load-bearing: fails — The paper’s conclusions may not depend on it.
- Based: passes — The paper gives a reason why it holds.
Probably not a substantial claim. The paper’s conclusions may not depend on it.
In the paper
“PU.1 has been shown to act in concert with MITF to recruit co-repressors to osteoclast-specific in committed myeloid precursors capable of forming either macrophages or OC [50].”
§ PU.1 target genes undergo Tet2-coupled demethylation and DNMT3b-mediated methylation in monocyte-to-osteoclast differentiation > Discussion
What the sources say
- Not checked yetcites [50] Hu R, Sharma SM, Bronisz A, Srinivasan R, Sankar U, Ostrowski MC: Eos, MITF, and PU.1 recruit corepressors to osteoclast-specific genes in committed myeloid progenitors. Mol Cell Biol. 2007, 27: 4018-4027. 10.1128/MCB.01839-06. source
plaindirect- Asserted: passes — The authors put it forward as true.
- Checkable: passes — It can be checked against evidence.
- Load-bearing: fails — The paper’s conclusions may not depend on it.
- Based: passes — The paper gives a reason why it holds.
Probably not a substantial claim. The paper’s conclusions may not depend on it.
What the paper did — it cites no source for this, so there is none to check. The quote shows it is in the paper.
In the paper
“IgG was used as a negative control.”
§ PU.1 target genes undergo Tet2-coupled demethylation and DNMT3b-mediated methylation in monocyte-to-osteoclast differentiation > Materials and methods > Chromatin immunoprecipitation (ChIP) assays and immunoprecipitation experiments
plain- Asserted: passes — The authors put it forward as true.
- Checkable: passes — It can be checked against evidence.
- Load-bearing: fails — The paper’s conclusions may not depend on it.
- Based: passes — The paper gives a reason why it holds.
Probably not a substantial claim. The paper’s conclusions may not depend on it.
What the paper did — it cites no source for this, so there is none to check. The quote shows it is in the paper.
In the paper
“Validation of expression data was performed by quantitative RT-PCR.”
§ PU.1 target genes undergo Tet2-coupled demethylation and DNMT3b-mediated methylation in monocyte-to-osteoclast differentiation > Materials and methods > Gene expression data analysis and comparison of DNA expression data versus DNA methylation data
plain- Asserted: passes — The authors put it forward as true.
- Checkable: passes — It can be checked against evidence.
- Load-bearing: fails — The paper’s conclusions may not depend on it.
- Based: passes — The paper gives a reason why it holds.
Probably not a substantial claim. The paper’s conclusions may not depend on it.
In the paper
“previous studies have shown that PU.1 can form a complex with DNMT3a and DNMT3b [46].”
§ PU.1 target genes undergo Tet2-coupled demethylation and DNMT3b-mediated methylation in monocyte-to-osteoclast differentiation > Discussion
What the sources say
- Not checked yetcites [46] Suzuki M, Yamada T, Kihara-Negishi F, Sakurai T, Hara E, Tenen DG, Hozumi N, Oikawa T: Site-specific DNA methylation by a complex of PU.1 and Dnmt3a/b. Oncogene. 2006, 25: 2477-2488. 10.1038/sj.onc.1209272. source
plaincorrelational- Asserted: passes — The authors put it forward as true.
- Checkable: passes — It can be checked against evidence.
- Load-bearing: fails — The paper’s conclusions may not depend on it.
- Based: passes — The paper gives a reason why it holds.
Probably not a substantial claim. The paper’s conclusions may not depend on it.
A conclusion the paper draws from its own results — it cites no other source for it, so there is none to check. The quote shows it is in the paper.
In the paper
“Our study has allowed us to identify key DNA methylation changes during OC differentiation and has revealed an implication of PU.1 in the acquisition of DNA methylation and expression changes as well as identifying novel interactions with DNMT3b and TET2.”
§ PU.1 target genes undergo Tet2-coupled demethylation and DNMT3b-mediated methylation in monocyte-to-osteoclast differentiation > Discussion
plaincorrelational- Asserted: passes — The authors put it forward as true.
- Checkable: passes — It can be checked against evidence.
- Load-bearing: passes — The paper’s conclusions depend on it.
- Based: passes — The paper gives a reason why it holds.
It may state two separate claims as one.
In the paper
“Several recent reports have pointed at TET2-mediated hydroxylation of 5-methylcytosine as an intermediate step towards demethylation [51]”
§ PU.1 target genes undergo Tet2-coupled demethylation and DNMT3b-mediated methylation in monocyte-to-osteoclast differentiation > Discussion
What the sources say
- Not checked yetcites [51] Vincent JJ, Huang Y, Chen PY, Feng S, Calvopina JH, Nee K, Lee SA, Le T, Yoon AJ, Faull K, Fan G, Rao A, Jacobsen SE, Pellegrini M, Clark AT: Stage-specific roles for tet1 and tet2 in DNA demethylation in primordial germ cells. Cell Stem Cell. 2013, 12: 470-478. 10.1016/j.stem.2013.01.016. source
plaindirect- Asserted: passes — The authors put it forward as true.
- Checkable: passes — It can be checked against evidence.
- Load-bearing: passes — The paper’s conclusions depend on it.
- Based: passes — The paper gives a reason why it holds.
Probably not a substantial claim.
What the paper did — it cites no source for this, so there is none to check. The quote shows it is in the paper.
In the paper
“Multiple test correction to account for the multiple hypotheses tested (one for each GO term) was applied to reduce false-positive results.”
§ PU.1 target genes undergo Tet2-coupled demethylation and DNMT3b-mediated methylation in monocyte-to-osteoclast differentiation > Materials and methods > Gene ontology analysis
plaindirect- Asserted: passes — The authors put it forward as true.
- Checkable: passes — It can be checked against evidence.
- Load-bearing: fails — The paper’s conclusions may not depend on it.
- Based: passes — The paper gives a reason why it holds.
Probably not a substantial claim. The paper’s conclusions may not depend on it.
What the paper did — it cites no source for this, so there is none to check. The quote shows it is in the paper.
In the paper
“OCs (TRAP-positive cells with more than three nuclei) were also analyzed at the mRNA level: upregulation of key OC markers (TRAP/ACP5, CA2, MMP9, and CTSK) and the downregulation of the MO marker CX3CR1 were confirmed.”
§ PU.1 target genes undergo Tet2-coupled demethylation and DNMT3b-mediated methylation in monocyte-to-osteoclast differentiation > Materials and methods > Differentiation of OCs from peripheral blood mononuclear cells
plaincorrelational- Asserted: passes — The authors put it forward as true.
- Checkable: passes — It can be checked against evidence.
- Load-bearing: passes — The paper’s conclusions depend on it.
- Based: passes — The paper gives a reason why it holds.
It may state two separate claims as one.
A conclusion the paper draws from its own results — it cites no other source for it, so there is none to check. The quote shows it is in the paper.
In the paper
“our data show changes in 5hmC at genes that become demethylated in osteoclastogenesis, reinforcing the possibility that PU.1-mediated recruitment of TET2 is leading to 5hmC-mediated demethylation.”
§ PU.1 target genes undergo Tet2-coupled demethylation and DNMT3b-mediated methylation in monocyte-to-osteoclast differentiation > Discussion
hedgedconditional- Asserted: passes — The authors put it forward as true.
- Checkable: passes — It can be checked against evidence.
- Load-bearing: passes — The paper’s conclusions depend on it.
- Based: passes — The paper gives a reason why it holds.
It may state two separate claims as one.
In the paper
“however for statistics purposes it is more adequate the use of M values [54].”
§ PU.1 target genes undergo Tet2-coupled demethylation and DNMT3b-mediated methylation in monocyte-to-osteoclast differentiation > Materials and methods > DNA methylation profiling using universal bead arrays
What the sources say
- Not checked yetcites [54] Du P, Zhang X, Huang CC, Jafari N, Kibbe WA, Hou L, Lin SM: Comparison of Beta-value and M-value methods for quantifying methylation levels by microarray analysis. BMC Bioinforma. 2010, 11: 587-10.1186/1471-2105-11-587. source
plain- Asserted: passes — The authors put it forward as true.
- Checkable: passes — It can be checked against evidence.
- Load-bearing: fails — The paper’s conclusions may not depend on it.
- Based: passes — The paper gives a reason why it holds.
Probably not a substantial claim. The paper’s conclusions may not depend on it.
In the paper
“PU.1 is known to generate a repressive chromatin structure characterized by H3K9me3 in myeloid and erythroid differentiation [49].”
§ PU.1 target genes undergo Tet2-coupled demethylation and DNMT3b-mediated methylation in monocyte-to-osteoclast differentiation > Discussion
What the sources say
- Not checked yetcites [49] Stopka T, Amanatullah DF, Papetti M, Skoultchi AI: PU.1 inhibits the erythroid program by binding to GATA-1 on DNA and creating a repressive chromatin structure. EMBO J. 2005, 24: 3712-3723. 10.1038/sj.emboj.7600834. source
boosteddirect- Asserted: passes — The authors put it forward as true.
- Checkable: passes — It can be checked against evidence.
- Load-bearing: fails — The paper’s conclusions may not depend on it.
- Based: passes — The paper gives a reason why it holds.
Probably not a substantial claim. The paper’s conclusions may not depend on it.
A conclusion the paper draws from its own results — it cites no other source for it, so there is none to check. The quote shows it is in the paper.
In the paper
“These changes occur in the virtual absence of DNA replication suggesting the participation of active mechanisms, particularly relevant for hypomethylation events, for which the mechanisms are still subject of debate.”
§ PU.1 target genes undergo Tet2-coupled demethylation and DNMT3b-mediated methylation in monocyte-to-osteoclast differentiation > Conclusions
hedgedconditional- Asserted: passes — The authors put it forward as true.
- Checkable: passes — It can be checked against evidence.
- Load-bearing: passes — The paper’s conclusions depend on it.
- Based: passes — The paper gives a reason why it holds.
It may state two separate claims as one.
What the paper did — it cites no source for this, so there is none to check. The quote shows it is in the paper.
In the paper
“We used bisulfite pyrosequencing to validate CpG methylation changes resulting from the analysis with the Infinium HumanMethylation450 BeadChips.”
§ PU.1 target genes undergo Tet2-coupled demethylation and DNMT3b-mediated methylation in monocyte-to-osteoclast differentiation > Materials and methods > Bisulfite sequencing and pyrosequencing
plain- Asserted: passes — The authors put it forward as true.
- Checkable: passes — It can be checked against evidence.
- Load-bearing: fails — The paper’s conclusions may not depend on it.
- Based: passes — The paper gives a reason why it holds.
Probably not a substantial claim. The paper’s conclusions may not depend on it.
What the paper did — it cites no source for this, so there is none to check. The quote shows it is in the paper.
In the paper
“These experiments were performed with three biological replicates.”
§ PU.1 target genes undergo Tet2-coupled demethylation and DNMT3b-mediated methylation in monocyte-to-osteoclast differentiation > Materials and methods > Transfection of primary human MOs
plain- Asserted: fails — The authors may not put it forward as true.
- Checkable: passes — It can be checked against evidence.
- Load-bearing: fails — The paper’s conclusions may not depend on it.
- Based: fails — The paper may give no reason why it holds.
Probably not a substantial claim. The authors may not put it forward as true. The paper’s conclusions may not depend on it. The paper may give no reason why it holds.
What the paper did — it cites no source for this, so there is none to check. The quote shows it is in the paper.
In the paper
“We calculated two-tailed probabilities, and a final adjusted FDR P value (with 0.25 cutoff) was considered statistically significant.”
§ PU.1 target genes undergo Tet2-coupled demethylation and DNMT3b-mediated methylation in monocyte-to-osteoclast differentiation > Materials and methods > Analysis of transcription factor binding
plain- Asserted: passes — The authors put it forward as true.
- Checkable: passes — It can be checked against evidence.
- Load-bearing: fails — The paper’s conclusions may not depend on it.
- Based: passes — The paper gives a reason why it holds.
Probably not a substantial claim. The paper’s conclusions may not depend on it.
A conclusion the paper draws from its own results — it cites no other source for it, so there is none to check. The quote shows it is in the paper.
In the paper
“as well as showing how impaired association of PU.1 results in defective acquisition of DNA methylation changes in both directions as well as reduced effect on gene expression changes.”
§ PU.1 target genes undergo Tet2-coupled demethylation and DNMT3b-mediated methylation in monocyte-to-osteoclast differentiation > Discussion
plaindirect- Asserted: passes — The authors put it forward as true.
- Checkable: passes — It can be checked against evidence.
- Load-bearing: passes — The paper’s conclusions depend on it.
- Based: passes — The paper gives a reason why it holds.
It may state two separate claims as one.
In the paper
“Ser phosphorylation of PU.1 has already been shown to play a role in its recruitment to promoters [52]”
§ PU.1 target genes undergo Tet2-coupled demethylation and DNMT3b-mediated methylation in monocyte-to-osteoclast differentiation > Discussion
What the sources say
- Not checked yetcites [52] Azim AC, Wang X, Park GY, Sadikot RT, Cao H, Mathew B, Atchison M, van Breemen RB, Joo M, Christman JW: NF-kappaB-inducing kinase regulates cyclooxygenase 2 gene expression in macrophages by phosphorylation of PU.1. J Immunol. 2007, 179: 7868-7875. source
plaindirect- Asserted: passes — The authors put it forward as true.
- Checkable: passes — It can be checked against evidence.
- Load-bearing: fails — The paper’s conclusions may not depend on it.
- Based: passes — The paper gives a reason why it holds.
Probably not a substantial claim. The paper’s conclusions may not depend on it.
What the paper did — it cites no source for this, so there is none to check. The quote shows it is in the paper.
In the paper
“A phalloidin/DAPI stain allowed us to confirm that the populations were highly enriched in multinuclear cells, some of them containing more than 40 nuclei.”
§ PU.1 target genes undergo Tet2-coupled demethylation and DNMT3b-mediated methylation in monocyte-to-osteoclast differentiation > Materials and methods > Differentiation of OCs from peripheral blood mononuclear cells
plain- Asserted: passes — The authors put it forward as true.
- Checkable: passes — It can be checked against evidence.
- Load-bearing: unclear — It is unclear whether the paper’s conclusions depend on it.
- Based: passes — The paper gives a reason why it holds.
It may state two separate claims as one.
The paper relies on this without support.
PU.1 and NF-kB (p65) are representative examples of transcription factors involved in the acquisition of DNA methylation changes during osteoclastogenesis.
“To investigate the potential role of the aforementioned transcription factors in the acquisition of DNA methylation changes we chose PU.1 and NF-kB (p65 subunit) as two representative examples.”
The paper relies on this without support.
The Infinium HumanMethylation450 BeadChip interrogates >485,000 methylation sites per sample at single-nucleotide resolution, covering 99% of RefSeq genes, with an average of 17 CpG sites per gene region, and covers 96% of CpG islands plus additional coverage in CpG island shores and flanking regions.
“This array allows interrogating >485,000 methylation sites per sample at single-nucleotide resolution, covering 99% of RefSeq genes, with an average of 17 CpG sites per gene region distributed across the promoter, 5′UTR, first exon, gene body and 3′UTR. It covers 96% of CpG islands, with additional coverage in CpG island shores and the regions flanking them.”
The authors state this as an assumption.
Differentially methylated regions (DMRs) are more robust signals than differentially methylated probes (DMPs).
“We considered that DMR are more robust signals than DMPs.”
The paper relies on this without support.
In many cases, methylation changes are observed over a range of CpGs, which may be identified at shores close to transcription starting sites.
“It has been shown that in many cases methylation changes are observed over a range of CpGs, which may be identified for instance at shores close to transcription starting sites.”
The paper relies on this without support.
Under the conditions used to prepare monocytes for transfection, over 80% of the cells are monocytes.
“Under these conditions over 80% are MOs.”
Claims other papers make about this one
Each is checked against this paper’s own text: does it say what the citing paper says it does?
The source backs part of the claim, not all of it — or backs it for a different population, condition or comparison.
In the citing paper
“Considering PU.1 participates in the entire process of osteoclast differentiation and promotes osteoclast commitment and maturity of osteoclast33,57,58”
From Targeting Msx2 as a brake in the fusion fate of osteoclasts and an anabolic therapy in pre-clinical models of osteoporosis (2025) · cites this paper as [58]
Experimental — accuracy not yet measuredThe source backs part of the claim, not all of it — or backs it for a different population, condition or comparison.
In the citing paper
“Interestingly, PU.1 and TET2 have been reported to form a complex to co-regulate myeloid-specific genes25,26,32.”
From HIV-1 Vpr combats the PU.1-driven antiviral response in primary human macrophages (2024) · cites this paper as [32]
Experimental — accuracy not yet measuredThe cited source says what the claim attributes to it.
In the citing paper
“In monocytes, TET2 interacts with PU.1, leading to interaction with genetic targets32.”
From HIV-1 Vpr combats the PU.1-driven antiviral response in primary human macrophages (2024) · cites this paper as [32]
The cited source says what the claim attributes to it.
In the citing paper
“It is also reported to act as a repressor by direct recruitment of Dnmt3b (102).”
From Mechanisms of Action of Hematopoietic Transcription Factor PU.1 in Initiation of T-Cell Development (2019) · cites this paper as [102]
In the citing paper
“Distinct mechanisms according to haematopoietic lineages with direct or indirect binding to regulatory regions of repressed genes have been reported (12,14–16).”
From HDAC1 and PRC2 mediate combinatorial control in SPI1/PU.1-dependent gene repression in murine erythroleukaemia (2022) · cites this paper as [12]
In the citing paper
“We observe significant overlap between vitC-induced DMRs and PU.1-binding sites, consistent with previously described physical association between PU.1 and TET2.46”
From Vitamin C-induced epigenomic remodelling in IDH1 mutant acute myeloid leukaemia (2018) · cites this paper as [46]
In the citing paper
“These observations support a model in which PU.1 guides TET2 to a specific subset of genomic regions to facilitate the oxidation of 5mC to 5hmC, a reaction that is inhibited by 2-hydroxyglutarate47 and enhanced by vitamin C13 (Figure 5d).”
From Vitamin C-induced epigenomic remodelling in IDH1 mutant acute myeloid leukaemia (2018) · cites this paper as [46]
Self-check
Percentages, sums and reported differences re-computed from the paper’s own numbers.
Each contradiction between two passages listed here was confirmed by an independent check.
Rated minor: it would not touch a result — a value no result rests on, a p-value that stays on the same side of the significance level, or a conflict that is clerical, resolved elsewhere in the paper, or outside its own findings.
In the paper
§ PU.1 target genes undergo Tet2-coupled demethylation and DNMT3b-mediated methylation in monocyte-to-osteoclast differentiation > Results > Hypomethylation is replication-independent and involves changes in 5-hydroxymethylcytosine
“Effects of 5azadC treatment (50 nM, 500 nM) on osteoclastogenesis monitoring ACP5, CTSK, and CX3CR1 levels and TRAP staining over time.”
§ PU.1 target genes undergo Tet2-coupled demethylation and DNMT3b-mediated methylation in monocyte-to-osteoclast differentiation > Materials and methods > Treatment of MOs with 5-aza-2-deoxycytidine
“In some cases we performed monocyte-to-osteoclast differentiation experiments in the presence of different subtoxic concentrations of the DNA replication-coupled demethylating drug 5-aza-2-deoxycytidine (at 50 nM, 500 mM) for 72 h.”
Rated minor: it would not touch a result — a value no result rests on, a p-value that stays on the same side of the significance level, or a conflict that is clerical, resolved elsewhere in the paper, or outside its own findings.
In the paper
§ PU.1 target genes undergo Tet2-coupled demethylation and DNMT3b-mediated methylation in monocyte-to-osteoclast differentiation > Results > Hypomethylation is replication-independent and involves changes in 5-hydroxymethylcytosine
“Heatmap showing expression levels on 0, 5, and 20 days for genes displaying significant methylation and expression changes (4,753 in total with FC ≥2 or FC ≤0.5; P ≤0.01 and FDR ≤0.05)”
§ PU.1 target genes undergo Tet2-coupled demethylation and DNMT3b-mediated methylation in monocyte-to-osteoclast differentiation > Results > Cell differentiation and fusion in osteoclastogenesis are accompanied by hypomethylation and hypermethylation of key functional pathways and genes
“Statistical analysis of the combined data from the three pairs of samples revealed that 3,515 genes (8,028 CpGs) displayed differential methylation”
Rated minor: it would not touch a result — a value no result rests on, a p-value that stays on the same side of the significance level, or a conflict that is clerical, resolved elsewhere in the paper, or outside its own findings.
In the paper
§ PU.1 target genes undergo Tet2-coupled demethylation and DNMT3b-mediated methylation in monocyte-to-osteoclast differentiation > Results > Cell differentiation and fusion in osteoclastogenesis are accompanied by hypomethylation and hypermethylation of key functional pathways and genes
“Two examples of regions with more than nine consecutive CpGs differentially methylated are shown.”
§ PU.1 target genes undergo Tet2-coupled demethylation and DNMT3b-mediated methylation in monocyte-to-osteoclast differentiation > Results > Cell differentiation and fusion in osteoclastogenesis are accompanied by hypomethylation and hypermethylation of key functional pathways and genes
“including 10 CpGs at the promoter of the TM4SF19 gene, also known as OC maturation-associated gene 4 protein, and nine CpGs in the gene body of ARID5B, the AT-rich interactive domain 5B (MRF1-like) (Figure 1F).”
Rated minor: it would not touch a result — a value no result rests on, a p-value that stays on the same side of the significance level, or a conflict that is clerical, resolved elsewhere in the paper, or outside its own findings.
In the paper
§ PU.1 target genes undergo Tet2-coupled demethylation and DNMT3b-mediated methylation in monocyte-to-osteoclast differentiation > Results > Cell differentiation and fusion in osteoclastogenesis are accompanied by hypomethylation and hypermethylation of key functional pathways and genes
“Gene ontology analysis of hypomethylated CpGs revealed significant enrichment (FDR ≤0.05) for a variety of functional categories of relevance in OC differentiation and function (Figure 1D).”
§ PU.1 target genes undergo Tet2-coupled demethylation and DNMT3b-mediated methylation in monocyte-to-osteoclast differentiation > Results > Cell differentiation and fusion in osteoclastogenesis are accompanied by hypomethylation and hypermethylation of key functional pathways and genes
“but also more specific categories such as ruffle organization (FDR = 9.91E-2), calcium ion transport (FDR = 4.6E-2), and OC differentiation (FDR = 1.94E-1).”
Citations
Cites
R: A Language and Environment for Statistical Computing
R Core Team (2000) · doi:10.32614/r.manuals · Cited by 355,893
Conversion of 5-Methylcytosine to 5-Hydroxymethylcytosine in Mammalian DNA by MLL Partner TET1
Tahiliani, M., Koh, K. P., Shen, Y., Pastor, W. A., Bandukwala, H., Brudno, Y., Agarwal, S., Iyer, L. M., Liu, D. R., Aravind, L., et al. (2009) · Science · doi:10.1126/science.1170116 · Cited by 5,836 · cited 2×
“TET proteins are responsible for conversion of 5mC in 5hmC [34], 5fC, and 5cac [36].”
limma: Linear Models for Microarray Data
Smyth, G. K. (2005) · Statistics for Biology and Health · doi:10.1007/0-387-29362-0_23 · Cited by 5,796 · cited 3×
“In order to process Illumina Infinium HumanMethylation450 methylation data, we used the methods supplied in limma [56], genefilter, and lumi [57] packages from Bioconductor repository.”
Methylation-specific PCR: a novel PCR assay for methylation status of CpG islands.
Herman, J. G., Graff, J. R., Myöhänen, S., Nelkin, B. D., & Baylin, S. B. (1996) · Proceedings of the National Academy of Sciences · doi:10.1073/pnas.93.18.9821 · Cited by 5,634
Osteoprotegerin ligand is a cytokine that regulates osteoclast differentiation and activation.
Lacey, D. L., Timms, E., Tan, H.-L., Kelley, M. J., Dunstan, C. R., Burgess, T., Elliott, R., Colombero, A., Elliott, G., Scully, S., et al. (1998) · Cell · doi:10.1016/s0092-8674(00)81569-x · Cited by 5,439 · cited 21×
“We also observed increased recruitment of DNMT3b at 2 days after M - CSF / RANKL stimulation .”
Influentialaffy—analysis of Affymetrix GeneChip data at the probe level
Gautier, L., Cope, L., Bolstad, B. M., & Irizarry, R. A. (2004) · Bioinformatics · doi:10.1093/bioinformatics/btg405 · Cited by 5,221 · cited 1×
“0 expression data was processed using limma [56] and affy [62] packages from bioconductor.”
Summaries of Affymetrix GeneChip probe level data
Irizarry, R. A. (2003) · Nucleic Acids Research · doi:10.1093/nar/gng015 · Cited by 4,837
Bioinformatics and Computational Biology Solutions Using R and Bioconductor
Gentleman, R. C., Carey, V. J., Huber, W. K., Irizarry, R. A., & Dudoit, S. (2005) · Statistics in the health sciences · doi:10.1007/0-387-29362-0 · Cited by 3,470
Tet proteins can convert 5-methylcytosine to 5-formylcytosine and 5-carboxylcytosine
Ito, S., Shen, L., Dai, Q., Wu, S. C., Collins, L. B., Swenberg, J. A., He, C., & Zhang, Y. (2011) · Science · doi:10.1126/science.1210597 · Cited by 3,451 · cited 2×
“TET proteins are responsible for conversion of 5mC in 5hmC [34], 5fC, and 5cac [36].”
Scott, D. L., Wolfe, F., & Huizinga, T. W. J. (2010) · The Lancet · doi:10.1016/s0140-6736(10)60826-4 · Cited by 3,263
Cited by
Sorted by citations
TET-mediated active DNA demethylation: mechanism, function and beyond
Wu, X., & Zhang, Y. (2017) · Nature Reviews Genetics · doi:10.1038/nrg.2017.33 · Cited by 1,661
β-Glucan Reverses the Epigenetic State of LPS-Induced Immunological Tolerance
Novakovic, B., Habibi, E., Wang, S.-Y., Arts, R. J. W., Davar, R., Megchelenbrink, W., Kim, B., Kuznetsova, T., Kox, M., Zwaag, J., et al. (2016) · Cell · doi:10.1016/j.cell.2016.09.034 · Cited by 712
Oxidative stress alters global histone modification and DNA methylation
Niu, Y., DesMarais, T. L., Tong, Z., Yao, Y., & Costa, M. (2015) · Free Radical Biology and Medicine · doi:10.1016/j.freeradbiomed.2015.01.028 · Cited by 362
Sensitivity of transcription factors to DNA methylation
Héberlé, É., & Bardet, A. F. (2019) · Essays in Biochemistry · doi:10.1042/ebc20190033 · Cited by 347
Epigenetic control of myeloid cell differentiation, identity and function
Álvarez‐Errico, D., Vento‐Tormo, R., Sieweke, M. H., & Ballestar, E. (2014) · Nature reviews. Immunology · doi:10.1038/nri3777 · Cited by 343
Self-citation
Metadata
- Authors
- de la Rica, L., Rodríguez-Ubreva, J., García, M., Islam, A. B., Urquiza, J. M., Hernando, H., Christensen, J., Helin, K., Gómez-Vaquero, C., & Ballestar, E.
- Affiliations
- Bellvitge University Hospital (ES)
- Institut d'Investigació Biomédica de Bellvitge (ES)
- University of Copenhagen (DK)
- Corresponding author
- Ballestar, Esteban
- Venue
- Genome Biology
- Published
- 2013-09-12
- Volume
- 14
- Issue
- 9
- Pages
- R99-R99
- ISSN
- 1465-6906 (ISSN-L)
- 1474-760X
- PMC
- PMC4054781
- OpenAlex
- W2123115454
- Semantic Scholar
- 1bf13dc677b7a6bf2895c59587e6626186b9efa9
- Cited by
- 211
- References
- 70
- Citations by year
- 2026: 5 · 2025: 18 · 2024: 12 · 2023: 9 · 2022: 18 · 2021: 21 · 2020: 24 · 2019: 26 · 2018: 13 · 2017: 23 · 2016: 15 · 2015: 14 · 2014: 12 · 2013: 1
- FWCI
- 6.23
- Type
- journal article
- Language
- en
- Open access
- gold
- doi.org
- Locations
- Genome biology (publishedVersion, cc-by)
- Europe PMC (PubMed Central) (publishedVersion, cc-by)
- PubMed Central (publishedVersion, cc-by)
- PubMed (publishedVersion)
- RECERCAT (Consorci de Serveis Universitaris de Catalunya) (publishedVersion, other-oa)
- Dipòsit Digital de la Universitat de Barcelona (Universitat de Barcelona) (submittedVersion, cc-by)
- Research at the University of Copenhagen (University of Copenhagen) (submittedVersion)
- Repositori digital de la UPF (Universitat Pompeu Fabra) (submittedVersion, cc-by)
- Funders
- Fundación Ramón Areces
- Ministerio de Ciencia e Innovación (2009SGR184, SAF2011-29635)
- Agència de Gestió d'Ajuts Universitaris i de Recerca
- Topics
- Life Sciences › Biochemistry, Genetics and Molecular Biology › Molecular Biology › Epigenetics and DNA Methylation
- Life Sciences › Biochemistry, Genetics and Molecular Biology › Molecular Biology › Genomics and Chromatin Dynamics
- Life Sciences › Biochemistry, Genetics and Molecular Biology › Molecular Biology › Bone Metabolism and Diseases
- Keywords
- PU.1, TET2, DNMT3B, DNA methylation, 5-hydroxymethylcytosine, demethylation, osteoclastogenesis, monocyte differentiation, transcription factor binding motifs, epigenetic regulation, NF-κB, AP-1, transcription factor binding
- MeSH terms
- DNA Methyltransferase 3B, Proto-Oncogene Protein Spi-1, Binding Sites, Cell Differentiation, Cytosine, DNA (Cytosine-5-)-Methyltransferases, DNA-Binding Proteins, Humans, Monocytes, Osteoclasts, Protein Binding, Proto-Oncogene Proteins, Trans-Activators, NF-kappa B, Transcription Factor AP-1, CpG Islands, DNA Methylation, RNA, Small Interfering, Epigenesis, Genetic, 5-Methylcytosine, Dioxygenases, Protein Interaction Domains and Motifs
About these checks
Registry, retraction, Cites and statistics results are computed, not judged, with one exception: a printed reference that no index lists is read once by a model before it counts as a citation error. Claims are extracted by a model and kept only when their quote appears verbatim in the text; each cited source is then checked, with a model’s help, for whether it says what the claim relies on. Those verdicts can be wrong — read the claim’s quote and the cited source before relying on one.
A language model drew the claims from the paper on 2026-10-07, under version 3 of the claim definition (model deepseek-v4.1-flash, prompt extract-v3).
A second model labelled each claim on 2026-10-07 (model jev-1.13-20260917, definition revision gold-guideline-v0.2).
Cited sources are checked with a language model’s help (gpt-6-sol).
Statistics and arithmetic are recomputed, not judged.
Confidence bands are shown only for fields calibrated on our annotated test set. None is calibrated yet, so no band is shown.
What counts as a claim ›How we measure confidence ›How we check this ›
Are you an author, or do you see a problem with this page? Request a review
