

The DOI matches its Crossref record; 3 of the 3 references it cites were found in a registry or an index.
A comprehensive joint analysis of the long and short RNA transcriptomes of human erythrocytes.
Overview
The claims and statistics of this paper haven’t been checked yet.
Run the check — free, no account needed. It reads the open-access text and checks the sources it cites.
Integrity signals
Registry
Cites
Statistics
Figures
Verification
Claims the paper makes
The claims and statistics of this paper haven’t been checked yet.
Run the check — free, no account needed. It reads the open-access text and checks the sources it cites.
Claims other papers make about this one
Each is checked against this paper’s own text: does it say what the citing paper says it does?
The cited source says what the claim attributes to it.
In the citing paper
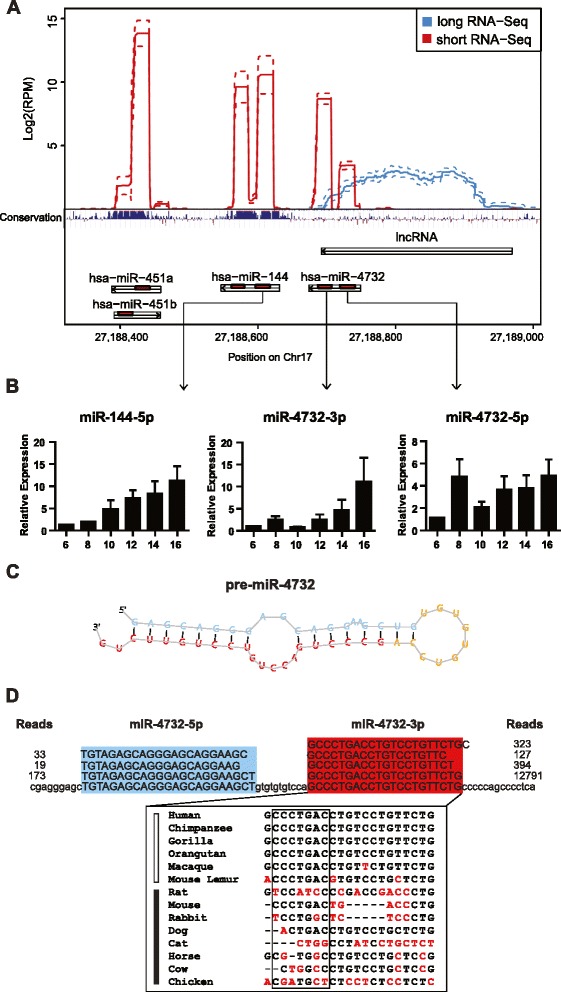
“miR-451, miR-144, and miR-486, which are abundant in red blood cells (RBCs), are involved in the process of erythropoiesis and disease occurrence.”
From Red Blood Cells as Potential Repositories of MicroRNAs in the Circulatory System (2020) · cites this paper as Doss et al., 2015
The cited source says what the claim attributes to it.
In the citing paper
“miR-451, miR-144, and miR-486, which are abundant in red blood cells (RBCs), are involved in the process of erythropoiesis and disease occurrence.”
From Red Blood Cells as Potential Repositories of MicroRNAs in the Circulatory System (2020) · cites this paper as Doss et al., 2015
The cited source says what the claim attributes to it.
In the citing paper
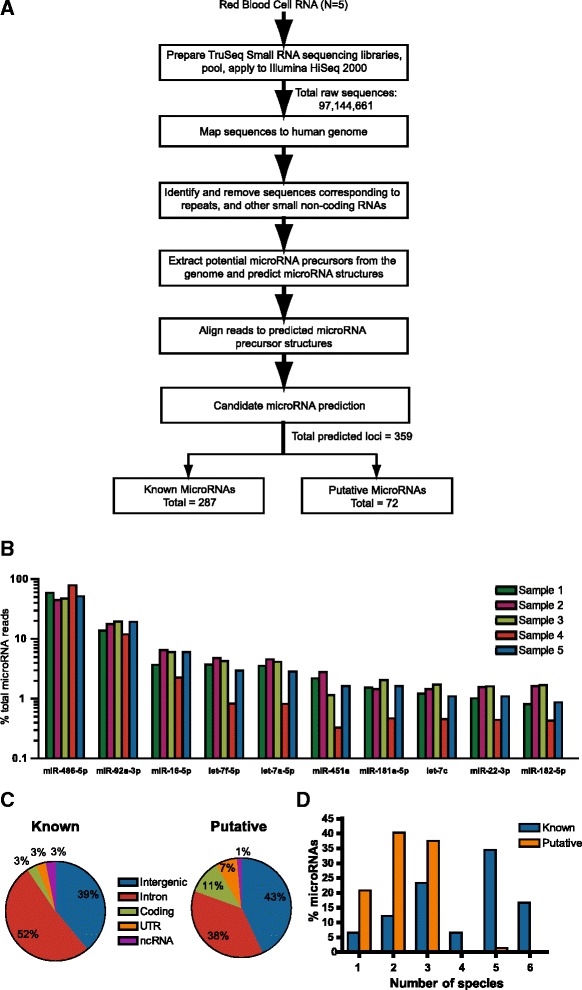
“287 known and 72 putative novel miRNAs were identified in erythrocytes”
From Red Blood Cells as Potential Repositories of MicroRNAs in the Circulatory System (2020) · cites this paper as Doss et al., 2015
In the citing paper
“miR-451, miR-144, and miR-486, which are abundant in red blood cells (RBCs), are involved in the process of erythropoiesis and disease occurrence.”
From Red Blood Cells as Potential Repositories of MicroRNAs in the Circulatory System (2020) · cites this paper as Doss et al., 2015
In the citing paper
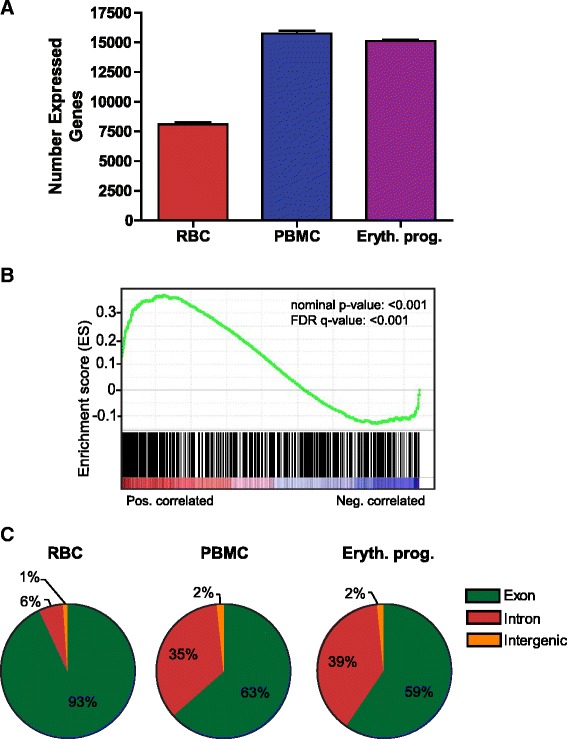
“However, current investigations have confirmed several different types of long RNAs in RBCs and have shown that the number of genes expressed in mature RBCs (∼8,092 genes) are far less than those of other nuclear blood cells such as peripheral blood mononuclear cells (∼15,743 genes) and erythroid progenitor cells (∼15,113 genes)”
From Red Blood Cells as Potential Repositories of MicroRNAs in the Circulatory System (2020) · cites this paper as Doss et al., 2015
In the citing paper
“The top 10 miRNAs with the highest expression levels in erythrocytes include miR-451a, miR-144-3p, miR-16, miR-92a, let-7, and miR-486-5p”
From Red Blood Cells as Potential Repositories of MicroRNAs in the Circulatory System (2020) · cites this paper as Doss et al., 2015
In the citing paper
“the number of genes expressed in mature RBCs (∼8,092 genes) are far less than those of other nuclear blood cells such as peripheral blood mononuclear cells (∼15,743 genes) and erythroid progenitor cells (∼15,113 genes)”
From Red Blood Cells as Potential Repositories of MicroRNAs in the Circulatory System (2020) · cites this paper as Doss et al., 2015
Self-check
Percentages, sums and reported differences re-computed from the paper’s own numbers.
The self-check needs the paper’s full text.
Citations
Cites
Subramanian, A., Tamayo, P., Mootha, V. K., Mukherjee, S., Ebert, B. L., Gillette, M. A., Paulovich, A., Pomeroy, S. L., Golub, T. R., Lander, E. S., et al. (2005) · Proceedings of the National Academy of Sciences · doi:10.1073/pnas.0506580102 · Cited by 53,625
Blood Cell Origin of Circulating MicroRNAs: A Cautionary Note for Cancer Biomarker Studies
Pritchard, C. C., Kroh, E., Wood, B., Arroyo, J. D., Dougherty, K. J., Miyaji, M. M., Tait, J. F., & Tewari, M. (2012) · Cancer Prevention Research · doi:10.1158/1940-6207.capr-11-0370 · Cited by 879
Mitoferrin is essential for erythroid iron assimilation
Shaw, G. C., Cope, J. J., Li, L., Corson, K., Hersey, C., Ackermann, G. E., Gwynn, B., Lambert, A. J., Wingert, R. A., Traver, D., et al. (2006) · Nature · doi:10.1038/nature04512 · Cited by 624
Research works printed but not linked: 62
- Zhao G, Yu D, Weiss MJ. MicroRNAs in erythropoiesis. Curr Opin Hematol. 2010;17:155–62.
- Hamilton AJ. MicroRNA in erythrocytes. Biochem Soc Trans. 2010;38:229–31. · DOI · Paper page
- O’Brien CA, Harley JB. A subset of hY RNAs is associated with erythrocyte Ro ribonucleoproteins. EMBO J. 1990;9:3683–9. · DOI
- Chen SY, Wang Y, Telen MJ, Chi JT. The genomic analysis of erythrocyte microRNA expression in sickle cell diseases. PLoS One. 2008;3:e2360. · DOI · Paper page
- Rathjen T, Nicol C, McConkey G, Dalmay T. Analysis of short RNAs in the malaria parasite and its red blood cell host. FEBS Lett. 2006;580:5185–8. · DOI · Paper page
- LaMonte G, Philip N, Reardon J, Lacsina JR, Majoros W, Chapman L, et al. Translocation of sickle cell erythrocyte microRNAs into Plasmodium falciparum inhibits parasite translation and contributes to malaria resistance. Cell Host Microbe. 2012;12:187–99. · DOI · Paper page
- Sangokoya C, Telen MJ, Chi JT. microRNA miR-144 modulates oxidative stress tolerance and associates with anemia severity in sickle cell disease. Blood. 2010;116:4338–48. · DOI
- Dore LC, Amigo JD, Dos Santos CO, Zhang Z, Gai X, Tobias JW, et al. A GATA-1-regulated microRNA locus essential for erythropoiesis. Proc Natl Acad Sci U S A. 2008;105:3333–8. · DOI · Paper page
- Kannan M, Atreya C. Differential profiling of human red blood cells during storage for 52 selected microRNAs. Transfusion. 2010;50:1581–8. · DOI · Paper page
- Azzouzi I, Moest H, Wollscheid B, Schmugge M, Eekels JJ, Speer O. Deep Sequencing and Proteomic Analysis of the MicroRNA-Induced Silencing Complex in Human Red Blood Cells. Exp Hematol. 2015;43(5):382–92. · DOI · Paper page
- Lewis BP, Burge CB, Bartel DP. Conserved seed pairing, often flanked by adenosines, indicates that thousands of human genes are microRNA targets. Cell. 2005;120:15–20. · DOI · Paper page
- He W, Dorn DC, Erdjument-Bromage H, Tempst P, Moore MA, Massague J. Hematopoiesis controlled by distinct TIF1gamma and Smad4 branches of the TGFbeta pathway. Cell. 2006;125:929–41. · DOI
- Sangokoya C, LaMonte G, Chi JT. Isolation and characterization of microRNAs of human mature erythrocytes. Methods Mol Biol. 2010;667:193–203. · DOI
- Wong JJ, Ritchie W, Ebner OA, Selbach M, Wong JW, Huang Y, et al. Orchestrated intron retention regulates normal granulocyte differentiation. Cell. 2013;154:583–95. · DOI · Paper page
- Pimentel H, Parra M, Gee S, Ghanem D, An X, Li J, et al. A dynamic alternative splicing program regulates gene expression during terminal erythropoiesis. Nucleic Acids Res. 2014;42:4031–42. · DOI
- Fried VA, Smith HT, Hildebrandt E, Weiner K. Ubiquitin has intrinsic proteolytic activity: implications for cellular regulation. Proc Natl Acad Sci U S A. 1987;84:3685–9. · DOI
- Thom CS, Traxler EA, Khandros E, Nickas JM, Zhou OY, Lazarus JE, et al. Trim58 degrades Dynein and regulates terminal erythropoiesis. Dev Cell. 2014;30:688–700. · DOI
- Song H, Luo J, Luo W, Weng J, Wang Z, Li B, et al. Inactivation of G-protein-coupled receptor 48 (Gpr48/Lgr4) impairs definitive erythropoiesis at midgestation through down-regulation of the ATF4 signaling pathway. J Biol Chem. 2008;283:36687–97. · DOI
- Cokic VP, Smith RD, Biancotto A, Noguchi CT, Puri RK, Schechter AN. Globin gene expression in correlation with G protein-related genes during erythroid differentiation. BMC Genomics. 2013;14:116. · DOI
- Zhang J, Loyd MR, Randall MS, Waddell MB, Kriwacki RW, Ney PA. A short linear motif in BNIP3L (NIX) mediates mitochondrial clearance in reticulocytes. Autophagy. 2012;8:1325–32. · DOI
- Ponka P, Beaumont C, Richardson DR. Function and regulation of transferrin and ferritin. Semin Hematol. 1998;35:35–54.
- Conboy J, Kan YW, Shohet SB, Mohandas N. Molecular cloning of protein 4.1, a major structural element of the human erythrocyte membrane skeleton. Proc Natl Acad Sci U S A. 1986;83:9512–6. · DOI · Paper page
- Kohno K, Narimatsu H, Shiono Y, Suzuki I, Kato Y, Fukao A, et al. Management of erythropoiesis: cross-sectional study of the relationships between erythropoiesis and nutrition, physical features, and adiponectin in 3519 Japanese people. Eur J Haematol. 2014;92:298–307. · DOI
- Friedlander MR, Mackowiak SD, Li N, Chen W, Rajewsky N. miRDeep2 accurately identifies known and hundreds of novel microRNA genes in seven animal clades. Nucleic Acids Res. 2012;40:37–52. · DOI · Paper page
- Swaminathan S, Hu X, Zheng X, Kriga Y, Shetty J, Zhao Y, et al. Interleukin-27 treated human macrophages induce the expression of novel microRNAs which may mediate anti-viral properties. Biochem Biophys Res Commun. 2013;434:228–34. · DOI
- Sharbati S, Friedlander MR, Sharbati J, Hoeke L, Chen W, Keller A, et al. Deciphering the porcine intestinal microRNA transcriptome. BMC Genomics. 2010;11:275. · DOI
- Jima DD, Zhang J, Jacobs C, Richards KL, Dunphy CH, Choi WW, et al. Deep sequencing of the small RNA transcriptome of normal and malignant human B cells identifies hundreds of novel microRNAs. Blood. 2010;116:e118–127. · DOI
- Wang LS, Li L, Li L, Chu S, Shiang KD, Li M, et al. MicroRNA-486 regulates normal erythropoiesis and enhances growth and modulates drug response in CML progenitors. Blood. 2014;125(8):1302–13. · DOI
- Shaham L, Vendramini E, Ge Y, Goren Y, Birger Y, Tijssen MR, et al. MicroRNA-486-5p is an erythroid oncomiR of the myeloid leukemias of Down syndrome. Blood. 2014;125(8):1292–301. · DOI · Paper page
- Yu D, dos Santos CO, Zhao G, Jiang J, Amigo JD, Khandros E, et al. miR-451 protects against erythroid oxidant stress by repressing 14-3-3zeta. Genes Dev. 2010;24:1620–33. · DOI
- Fu YF, Du TT, Dong M, Zhu KY, Jing CB, Zhang Y, et al. Mir-144 selectively regulates embryonic alpha-hemoglobin synthesis during primitive erythropoiesis. Blood. 2009;113:1340–9. · DOI
- Patrick DM, Zhang CC, Tao Y, Yao H, Qi X, Schwartz RJ, et al. Defective erythroid differentiation in miR-451 mutant mice mediated by 14-3-3zeta. Genes Dev. 2010;24:1614–9. · DOI
- Byon JC, Padilla SM, Papaynnopoulou T. Deletion of Dicer in late erythroid cells results in impaired stress erythropoiesis in mice. Exp Hematol. 2014;42(10):852–6. · DOI
- Noh SJ, Miller SH, Lee YT, Goh SH, Marincola FM, Stroncek DF, et al. Let-7 microRNAs are developmentally regulated in circulating human erythroid cells. J Transl Med. 2009;7:98. · DOI
- Teruel-Montoya R, Kong X, Abraham S, Ma L, Kunapuli SP, Holinstat M, et al. MicroRNA expression differences in human hematopoietic cell lineages enable regulated transgene expression. PLoS One. 2014;9:e102259. · DOI
- Kirschner MB, Kao SC, Edelman JJ, Armstrong NJ, Vallely MP, van Zandwijk N, et al. Haemolysis during sample preparation alters microRNA content of plasma. PLoS One. 2011;6:e24145. · DOI · Paper page
- Bruchova H, Yoon D, Agarwal AM, Mendell J, Prchal JT. Regulated expression of microRNAs in normal and polycythemia vera erythropoiesis. Exp Hematol. 2007;35:1657–67. · DOI · Paper page
- Chang JT, Nevins JR. GATHER: a systems approach to interpreting genomic signatures. Bioinformatics. 2006;22:2926–33. · DOI
- Nakao A, Imamura T, Souchelnytskyi S, Kawabata M, Ishisaki A, Oeda E, et al. TGF-beta receptor-mediated signalling through Smad2, Smad3 and Smad4. EMBO J. 1997;16:5353–62. · DOI
- Chen YG, Wang Z, Ma J, Zhang L, Lu Z. Endofin, a FYVE domain protein, interacts with Smad4 and facilitates transforming growth factor-beta signaling. J Biol Chem. 2007;282:9688–95. · DOI · Paper page
- Dong XM, Yin RH, Yang Y, Feng ZW, Ning HM, Dong L, et al. GATA-2 inhibits transforming growth factor-beta signaling pathway through interaction with Smad4. Cell Signal. 2014;26:1089–97. · DOI · Paper page
- Harada H, Grant S. Apoptosis regulators. Rev Clin Exp Hematol. 2003;7:117–38.
- Balsara RD, Ploplis VA. Plasminogen activator inhibitor-1: the double-edged sword in apoptosis. Thromb Haemost. 2008;100:1029–36. · DOI
- Ferrandiz N, Caraballo JM, Garcia-Gutierrez L, Devgan V, Rodriguez-Paredes M, Lafita MC, et al. p21 as a transcriptional co-repressor of S-phase and mitotic control genes. PLoS One. 2012;7:e37759. · DOI
- Zermati Y, Fichelson S, Valensi F, Freyssinier JM, Rouyer-Fessard P, Cramer E, et al. Transforming growth factor inhibits erythropoiesis by blocking proliferation and accelerating differentiation of erythroid progenitors. Exp Hematol. 2000;28:885–94. · DOI
- Randrianarison-Huetz V, Laurent B, Bardet V, Blobe GC, Huetz F, Dumenil D. Gfi-1B controls human erythroid and megakaryocytic differentiation by regulating TGF-beta signaling at the bipotent erythro-megakaryocytic progenitor stage. Blood. 2010;115:2784–95. · DOI · Paper page
- Choi SJ, Moon JH, Ahn YW, Ahn JH, Kim DU, Han TH. Tsc-22 enhances TGF-beta signaling by associating with Smad4 and induces erythroid cell differentiation. Mol Cell Biochem. 2005;271:23–8. · DOI · Paper page
- Dussiot M, Maciel TT, Fricot A, Chartier C, Negre O, Veiga J, et al. An activin receptor IIA ligand trap corrects ineffective erythropoiesis in beta-thalassemia. Nat Med. 2014;20:398–407. · DOI · Paper page
- Suragani RN, Cadena SM, Cawley SM, Sako D, Mitchell D, Li R, et al. Transforming growth factor-beta superfamily ligand trap ACE-536 corrects anemia by promoting late-stage erythropoiesis. Nat Med. 2014;20:408–14. · DOI · Paper page
- Dennler S, Itoh S, Vivien D, ten Dijke P, Huet S, Gauthier JM. Direct binding of Smad3 and Smad4 to critical TGF beta-inducible elements in the promoter of human plasminogen activator inhibitor-type 1 gene. EMBO J. 1998;17:3091–100. · DOI
- Beelman CA, Parker R. Degradation of mRNA in eukaryotes. Cell. 1995;81:179–83. · DOI
- He L, Hannon GJ. MicroRNAs: small RNAs with a big role in gene regulation. Nat Rev Genet. 2004;5:522–31. · DOI · Paper page
- Lin S, Cheung WK, Chen S, Lu G, Wang Z, Xie D, et al. Computational identification and characterization of primate-specific microRNAs in human genome. Comput Biol Chem. 2010;34:232–41. · DOI
- Lopez JP, Lim R, Cruceanu C, Crapper L, Fasano C, Labonte B, et al. miR-1202 is a primate-specific and brain-enriched microRNA involved in major depression and antidepressant treatment. Nat Med. 2014;20:764–8. · DOI · Paper page
- Pishesha N, Thiru P, Shi J, Eng JC, Sankaran VG, Lodish HF. Transcriptional divergence and conservation of human and mouse erythropoiesis. Proc Natl Acad Sci U S A. 2014;111:4103–8. · DOI
- Rasmussen KD, Simmini S, Abreu-Goodger C, Bartonicek N, Di Giacomo M, Bilbao-Cortes D, et al. The miR-144/451 locus is required for erythroid homeostasis. J Exp Med. 2010;207:1351–8. · DOI · Paper page
- Attie KM, Allison MJ, McClure T, Boyd IE, Wilson DM, Pearsall AE, et al. A phase 1 study of ACE-536, a regulator of erythroid differentiation, in healthy volunteers. Am J Hematol. 2014;89(7):766–70. · DOI
- Kersey PJ, Staines DM, Lawson D, Kulesha E, Derwent P, Humphrey JC, et al. Ensembl Genomes: an integrative resource for genome-scale data from non-vertebrate species. Nucleic Acids Res. 2012;40:D91–97. · DOI
- Dobin A, Davis CA, Schlesinger F, Drenkow J, Zaleski C, Jha S, et al. STAR: ultrafast universal RNA-seq aligner. Bioinformatics. 2013;29:15–21. · DOI · Paper page
- Wang L, Wang S, Li W. RSeQC: quality control of RNA-seq experiments. Bioinformatics. 2012;28:2184–5. · DOI
- Trapnell C, Hendrickson DG, Sauvageau M, Goff L, Rinn JL, Pachter L. Differential analysis of gene regulation at transcript resolution with RNA-seq. Nat Biotechnol. 2013;31:46–53. · DOI · Paper page
- Witt AE, Hines LM, Collins NL, Hu Y, Gunawardane RN, Moreira D, et al. Functional proteomics approach to investigate the biological activities of cDNAs implicated in breast cancer. J Proteome Res. 2006;5:599–610. · DOI
Cited by
Sorted by citations
Red Blood Cells as Potential Repositories of MicroRNAs in the Circulatory System
Sun, L., Yu, Y., Niu, B., & Wang, D. (2020) · Frontiers in Genetics · doi:10.3389/fgene.2020.00442 · Cited by 83
14q32 and let-7 microRNAs regulate transcriptional networks in fetal and adult human erythroblasts
Lessard, S., Beaudoin, M., Orkin, S. H., Bauer, D. E., & Lettre, G. (2018) · Human Molecular Genetics · doi:10.1093/hmg/ddy051 · Cited by 38
Storage Stability of Blood Samples for miRNAs in Glycosylated Extracellular Vesicles
Ma, C., Ding, R., Hao, K., Du, W., Xu, L., Gao, Q., & Yu, C. (2023) · Molecules · doi:10.3390/molecules29010103 · Cited by 22
Shvetcov, A., Thomson, S., Spathos, J., Cho, A.-N., Wilkins, H. M., Andrews, S. J., Delerue, F., Couttas, T. A., Issar, J. K., Isik, F., et al. (2023) · International Journal of Molecular Sciences · doi:10.3390/ijms241915011 · Cited by 12
Metadata
- Authors
- Doss, J. F., Corcoran, D. L., Jima, D. D., Telen, M. J., Dave, S. S., & Chi, J.-T.
- Venue
- BMC Genomics
- Published
- 2015-11-16
- Volume
- 16
- Issue
- 1
- ISSN
- 1471-2164
- PMC
- PMC4647483
- Cited by
- 113
- References
- 3
- Language
- en
- Funders
- Doris Duke Charitable Foundation (US) (2011098)
- World Anti-Doping Agency (CA) (13C31JC)
About these checks
Registry, retraction, Cites and statistics results are computed, not judged, with one exception: a printed reference that no index lists is read once by a model before it counts as a citation error. Claims are extracted by a model and kept only when their quote appears verbatim in the text; each cited source is then checked, with a model’s help, for whether it says what the claim relies on. Those verdicts can be wrong — read the claim’s quote and the cited source before relying on one.
Statistics and arithmetic are recomputed, not judged.
Confidence bands are shown only for fields calibrated on our annotated test set. None is calibrated yet, so no band is shown.
What counts as a claim ›How we measure confidence ›How we check this ›
Are you an author, or do you see a problem with this page? Request a review
