Cited by 34

The DOI matches its Crossref record; 4 of the 4 references it cites were found in a registry or an index.

An RNAi screen of Rho signalling networks identifies RhoH as a regulator of Rac1 in prostate cancer cell migration

Tajadura-Ortega, Virginia, Garg, Ritu, Allen, Richard, Owczarek, Claudia, Bright, Michael D., Kean, Samuel, Mohd-Noor, Aisyah, Grigoriadis, Anita, Elston, Timothy C., Hahn, Klaus M., Ridley, Anne J.·2018·BMC Biology

Overview

The claims and statistics of this paper haven’t been checked yet.

Run the check — free, no account needed. It reads the open-access text and checks the sources it cites.

A few free checks a day · papers already verified open instantly · results are public

Integrity signals

Registry

Crossref · 10.1186/s12915-018-0489-4

Cites

4 of 4 references verified0 citation errors · 0 not checkable

Statistics

Figures

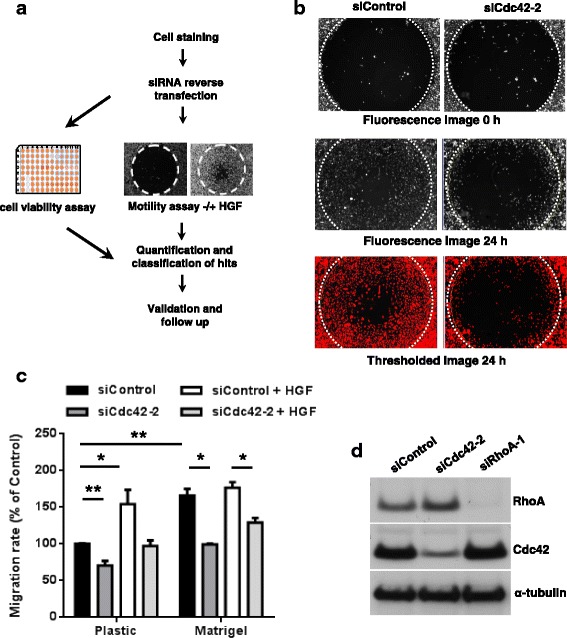
Fig. 1 Design and validation of siRNA screen. a Schematic representation of the screen design and implementation. PC3 cells were stained with carboxyfluorescein succinimidyl ester (CFSE) and reverse transfected with siRNAs. Cells were then divided and seeded into one 96-well plate to carry out cell viability analysis and two separate 96-well plates to measure migration by Oris™ assay with and without hepatocyte growth factor (HGF) (Table 1). Hits from the screen were quantified. b Conditions for the migration screen were tested using an siRNA targeting Cdc42 (siCdc42-2, Additional file 1: Table S1) and control siRNA. Images show examples of CFSE-labelled PC3 cells immediately after removal of the Oris™ stopper (0 h) and 24 h later. Bottom images are thresholded 24 h images (see Methods). White dotted circle indicates wound area at 0 h. c. Quantification of the effect of Cdc42 depletion on migration in the Oris™ assay using the screen conditions, comparing cells on uncoated plastic and Matrigel-coated plastic. n = 3, mean +/− standard error of the mean (SEM); **p ≤ 0.01, *p ≤ 0.05, Student’s t test. d Single siRNAs targeting Cdc42 (siCdc42-2), RhoA (siRhoA-1) or control siRNA were tested for knockdown of protein expression using the screen conditions. Cells were lysed 72 h after transfection, and cell lysates western blotted with antibodies to Cdc42 and RhoA, and α-tubulin as a loading control
Fig. 1 Design and validation of siRNA screen. a Schematic representation of the screen design and implementation. PC3 cells were stained with carboxyfluorescein succinimidyl ester (CFSE) and reverse transfected with siRNAs. Cells were then divided and seeded into one 96-well plate to carry out cell viability analysis and two separate 96-well plates to measure migration by Oris™ assay with and without hepatocyte growth factor (HGF) (Table 1). Hits from the screen were quantified. b Conditions for the migration screen were tested using an siRNA targeting Cdc42 (siCdc42-2, Additional file 1: Table S1) and control siRNA. Images show examples of CFSE-labelled PC3 cells immediately after removal of the Oris™ stopper (0 h) and 24 h later. Bottom images are thresholded 24 h images (see Methods). White dotted circle indicates wound area at 0 h. c. Quantification of the effect of Cdc42 depletion on migration in the Oris™ assay using the screen conditions, comparing cells on uncoated plastic and Matrigel-coated plastic. n = 3, mean +/− standard error of the mean (SEM); **p ≤ 0.01, *p ≤ 0.05, Student’s t test. d Single siRNAs targeting Cdc42 (siCdc42-2), RhoA (siRhoA-1) or control siRNA were tested for knockdown of protein expression using the screen conditions. Cells were lysed 72 h after transfection, and cell lysates western blotted with antibodies to Cdc42 and RhoA, and α-tubulin as a loading controlCC BY · PubMed Central
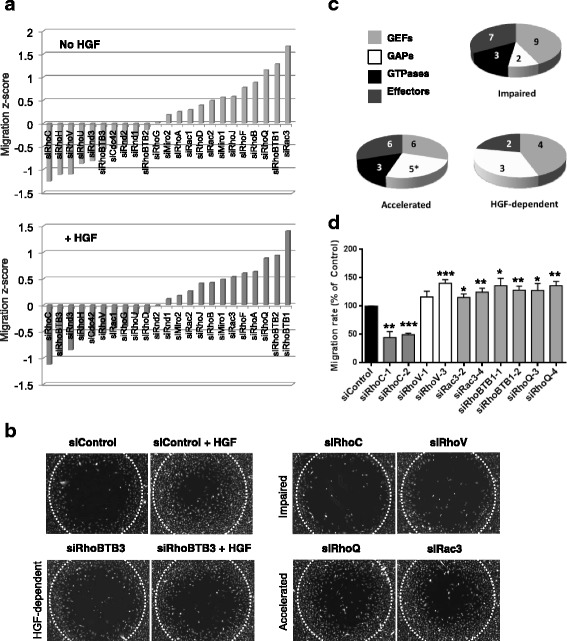
Fig. 2 Screen of Rho RNAi library identifies four cell migration phenotypes. The migration screen was performed with PC3 cells transfected with siRNA pools or single siRNAs targeting the indicated genes. After 24 h, cells were seeded at confluence into 96-well plates containing Oris™ stoppers. After 24 h, the stoppers were removed and cells were treated with or without 10 ng/ml HGF for 24 h. Images of cells were acquired immediately after removing the stoppers (0 h) and 24 h later. a Graph shows migration Z-scores (see Methods) for the GTPases included in the screen in normal medium (top panel) or medium containing HGF (bottom panel); n = 3. b Representative images of migration area (24 h after stopper removal) for representative hits from each phenotypic category: no effect on migration (siControl), accelerated migration (RhoQ, Rac3), impaired migration (RhoC, RhoV), impaired migration only in response to HGF (RhoBTB3). White dotted circle indicates wound area at 0 h. c Pie charts show number of genes giving each phenotype, based on type of gene (Rho GTPase, RhoGEF, RhoGAP, Rho effector). Note that BCR, which contains both a RhoGEF and a RhoGAP domain, was included as a GAP in the pie chart for accelerated migration and indicated with an asterisk. d Migration for cells transfected with the indicated single siRNAs is shown as percentage of control siRNA-transfected cells +/− SEM, n = 3; *p ≤ 0.05, **p ≤ 0.01, ***p ≤ 0.001, Student’s t test
Fig. 2 Screen of Rho RNAi library identifies four cell migration phenotypes. The migration screen was performed with PC3 cells transfected with siRNA pools or single siRNAs targeting the indicated genes. After 24 h, cells were seeded at confluence into 96-well plates containing Oris™ stoppers. After 24 h, the stoppers were removed and cells were treated with or without 10 ng/ml HGF for 24 h. Images of cells were acquired immediately after removing the stoppers (0 h) and 24 h later. a Graph shows migration Z-scores (see Methods) for the GTPases included in the screen in normal medium (top panel) or medium containing HGF (bottom panel); n = 3. b Representative images of migration area (24 h after stopper removal) for representative hits from each phenotypic category: no effect on migration (siControl), accelerated migration (RhoQ, Rac3), impaired migration (RhoC, RhoV), impaired migration only in response to HGF (RhoBTB3). White dotted circle indicates wound area at 0 h. c Pie charts show number of genes giving each phenotype, based on type of gene (Rho GTPase, RhoGEF, RhoGAP, Rho effector). Note that BCR, which contains both a RhoGEF and a RhoGAP domain, was included as a GAP in the pie chart for accelerated migration and indicated with an asterisk. d Migration for cells transfected with the indicated single siRNAs is shown as percentage of control siRNA-transfected cells +/− SEM, n = 3; *p ≤ 0.05, **p ≤ 0.01, ***p ≤ 0.001, Student’s t testCC BY · PubMed Central
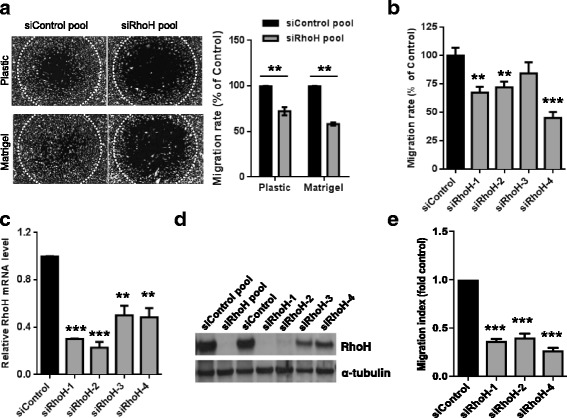
Fig. 3 RhoH depletion reduces cell migration. a RhoH depletion reduces migration on uncoated plastic or Matrigel-coated plastic. PC3 cells were transfected with a control siRNA pool or the pool of four siRNAs targeting RhoH. After 24 h, cells were seeded around Oris™ stoppers. After 24 h, stoppers were removed and migration was determined 24 h later. Left, example images of cells 24 h after removal of stoppers. White dotted circle indicates wound area at 0 h. Right, graph showing migration as % of siControl +/− SEM, n = 3; **p ≤ 0.01, Student’s t test. b Individual siRNAs targeting RhoH reduce migration. PC3 cells were transfected with indicated siRNAs. Cell migration was determined as in a. Graph shows migration as % of siControl +/− SEM, n = 3; **p ≤ 0.01, ***p ≤ 0.001, Student’s t test. c Relative mRNA expression levels following RhoH knockdown, compared to control siRNA-transfected cells. Levels were measured by quantitative real-time PCR (qPCR). n = 3; **p ≤ 0.01, ***p ≤ 0.001, Student’s t test. d Rho siRNAs reduce expression of exogenous RhoH. PC3 cells were transfected with the indicated siRNAs. Cells were transfected with human astrocyte (HA)-RhoH 48 h after siRNA transfection. After 24 h, cell lysates were analysed by western blotting with an anti-RhoH antibody. α-tubulin was used as a loading control. e RhoH depletion reduces migration through transwells. PC3 cells were transfected with the indicated siRNAs. Cell migration was determined through transwells with 1% fetal calf serum (FCS) as chemoattractant, and migration index calculated relative to siControl-transfected cells +/− SEM, n = 3; ***p ≤ 0.001, Student’s t test
Fig. 3 RhoH depletion reduces cell migration. a RhoH depletion reduces migration on uncoated plastic or Matrigel-coated plastic. PC3 cells were transfected with a control siRNA pool or the pool of four siRNAs targeting RhoH. After 24 h, cells were seeded around Oris™ stoppers. After 24 h, stoppers were removed and migration was determined 24 h later. Left, example images of cells 24 h after removal of stoppers. White dotted circle indicates wound area at 0 h. Right, graph showing migration as % of siControl +/− SEM, n = 3; **p ≤ 0.01, Student’s t test. b Individual siRNAs targeting RhoH reduce migration. PC3 cells were transfected with indicated siRNAs. Cell migration was determined as in a. Graph shows migration as % of siControl +/− SEM, n = 3; **p ≤ 0.01, ***p ≤ 0.001, Student’s t test. c Relative mRNA expression levels following RhoH knockdown, compared to control siRNA-transfected cells. Levels were measured by quantitative real-time PCR (qPCR). n = 3; **p ≤ 0.01, ***p ≤ 0.001, Student’s t test. d Rho siRNAs reduce expression of exogenous RhoH. PC3 cells were transfected with the indicated siRNAs. Cells were transfected with human astrocyte (HA)-RhoH 48 h after siRNA transfection. After 24 h, cell lysates were analysed by western blotting with an anti-RhoH antibody. α-tubulin was used as a loading control. e RhoH depletion reduces migration through transwells. PC3 cells were transfected with the indicated siRNAs. Cell migration was determined through transwells with 1% fetal calf serum (FCS) as chemoattractant, and migration index calculated relative to siControl-transfected cells +/− SEM, n = 3; ***p ≤ 0.001, Student’s t testCC BY · PubMed Central
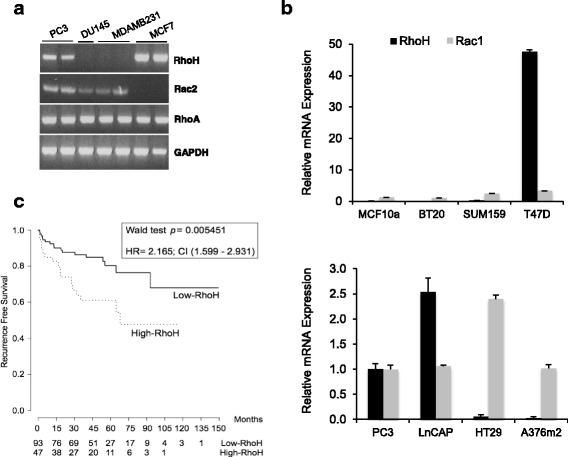
Fig. 4 RhoH is expressed in a subset of cancer cell lines and correlates with poor prognosis in prostate cancers. a, b Several epithelial cancer cell lines express RhoH. a RNA was analysed by reverse transcription (RT)-PCR to determine which cell types express mRNA for RhoH, RhoA and Rac2. GAPDH was used as a control. Gel is representative of three experiments. b RNA was analysed by qPCR for RhoH and Rac1 expression and normalised to GADPH mRNA. mRNA levels for each cell type are shown relative to levels in PC3 cells. Mean +/− standard deviation for the values of three technical replicates. c Expression of RhoH in prostate cancer correlates with poor prognosis. Publicly available RNA expression data from 140 prostate cancers from the Memorial Sloan Kettering Cancer Center (GSE21032) were analysed for RhoH expression. Samples were divided into those with high or low RhoH expression (see Methods). Kaplan-Meier curves show recurrence-free survival (RFS) measured by prostate-specific antigen (PSA) levels, indicating that high RhoH expression correlates with shorter RFS. Numbers under the graph show the number of patients without a recurrence event at a given time point, indicating that high RhoH expression correlates with earlier relapse and shorter time to relapse
Fig. 4 RhoH is expressed in a subset of cancer cell lines and correlates with poor prognosis in prostate cancers. a, b Several epithelial cancer cell lines express RhoH. a RNA was analysed by reverse transcription (RT)-PCR to determine which cell types express mRNA for RhoH, RhoA and Rac2. GAPDH was used as a control. Gel is representative of three experiments. b RNA was analysed by qPCR for RhoH and Rac1 expression and normalised to GADPH mRNA. mRNA levels for each cell type are shown relative to levels in PC3 cells. Mean +/− standard deviation for the values of three technical replicates. c Expression of RhoH in prostate cancer correlates with poor prognosis. Publicly available RNA expression data from 140 prostate cancers from the Memorial Sloan Kettering Cancer Center (GSE21032) were analysed for RhoH expression. Samples were divided into those with high or low RhoH expression (see Methods). Kaplan-Meier curves show recurrence-free survival (RFS) measured by prostate-specific antigen (PSA) levels, indicating that high RhoH expression correlates with shorter RFS. Numbers under the graph show the number of patients without a recurrence event at a given time point, indicating that high RhoH expression correlates with earlier relapse and shorter time to relapseCC BY · PubMed Central
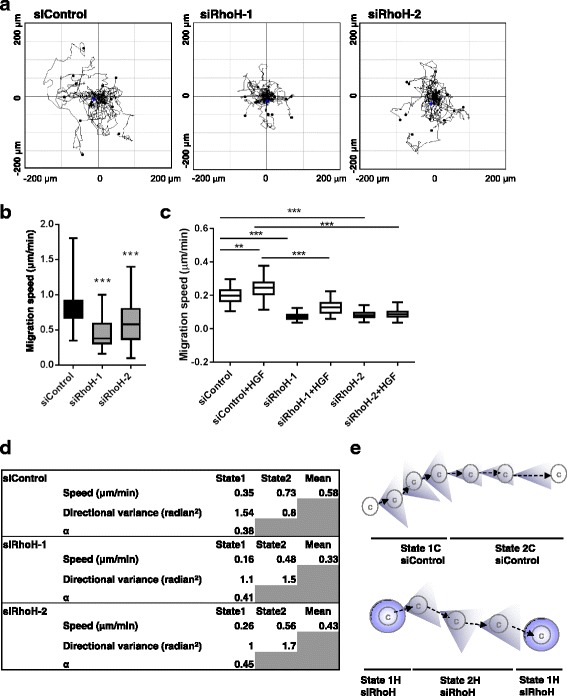
Fig. 5 RhoH depletion alters migration behaviour of PC3 cells. RhoH depletion reduces cell migration speed. PC3 cells were transfected with the indicated siRNAs targeting RhoH or control siRNA. Cells were seeded in 24-well dishes 48 h after transfection and monitored by time-lapse microscopy for 24 h. a Example cell tracks are shown for each condition, plotted with their starting point at the intersection of the x- and y-axes. b Quantification of PC3 cell migration speed. At least 50 cells were tracked from three independent experiments. Boxes of box and whisker plots show median, 25th and 75th percentiles; whiskers show minimum and maximum values; ***p ≤ 0.001, Student’s t test. c Effect of RhoH on HGF-induced migration. 48 h after siRNA transfection, cells were transferred to 0.1% FCS with or without 20 ng/ml HGF. Cells were monitored by time-lapse microscopy for 24 h, with an image taken every 4 min. At least 100 cells were tracked from three independent experiments. Boxes of box and whisker plots show median, 25th and 75th percentiles; whiskers show minimum and maximum values; **p ≤ 0.01, ***p ≤ 0.001, Student’s t test. d Data for State 1 and State 2, showing mean migration speed, directional variance (over a time period of 8 min) and proportion of total time spent in State 1 across all cells (α). e Analysis of cell tracks indicated two modes of migration, State 1 and State 2, with different migration speeds and persistence (directional variance)
Fig. 5 RhoH depletion alters migration behaviour of PC3 cells. RhoH depletion reduces cell migration speed. PC3 cells were transfected with the indicated siRNAs targeting RhoH or control siRNA. Cells were seeded in 24-well dishes 48 h after transfection and monitored by time-lapse microscopy for 24 h. a Example cell tracks are shown for each condition, plotted with their starting point at the intersection of the x- and y-axes. b Quantification of PC3 cell migration speed. At least 50 cells were tracked from three independent experiments. Boxes of box and whisker plots show median, 25th and 75th percentiles; whiskers show minimum and maximum values; ***p ≤ 0.001, Student’s t test. c Effect of RhoH on HGF-induced migration. 48 h after siRNA transfection, cells were transferred to 0.1% FCS with or without 20 ng/ml HGF. Cells were monitored by time-lapse microscopy for 24 h, with an image taken every 4 min. At least 100 cells were tracked from three independent experiments. Boxes of box and whisker plots show median, 25th and 75th percentiles; whiskers show minimum and maximum values; **p ≤ 0.01, ***p ≤ 0.001, Student’s t test. d Data for State 1 and State 2, showing mean migration speed, directional variance (over a time period of 8 min) and proportion of total time spent in State 1 across all cells (α). e Analysis of cell tracks indicated two modes of migration, State 1 and State 2, with different migration speeds and persistence (directional variance)CC BY · PubMed Central
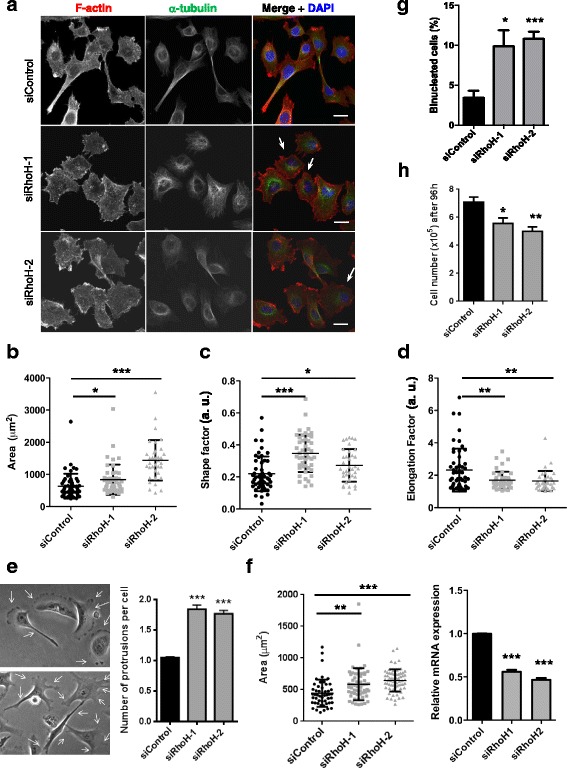
Fig. 6 RhoH affects cell shape in PC3 cells. Analysis of cell shape. PC3 cells were transfected with the indicated siRNAs targeting RhoH or control siRNA. After 48 h, cells were seeded on Matrigel-coated glass coverslips. 72 h after transfection, cells were fixed and stained for F-actin (Alexa Fluor 546 phalloidin), tubulin (fluorescein isothiocyanate (FITC)-labelled anti-tubulin antibody) and DNA (4′,6-diamidino-2-phenylindole (DAPI)). a Representative images of cells. Scale bar 10 μm. Arrows indicate examples of binucleated cells. b–d PC3 cell area, shape factor and elongation factor were measured using ImageJ from F-actin-stained images. Scatter dot plots show mean +/− SEM; at least 60 cells per condition were analysed from three independent experiments, *p ≤ 0.05, **p ≤ 0.01, ***p ≤ 0.001, Student’s t test. e Quantification of the number of extended protrusions during cell migration. Panels show representative images of siControl- or siRhoH-transfected cells. Arrows indicate protrusions on migrating cells. Graph shows the average number of protrusions per cell relative to control ***p ≤ 0.001. f T47D cells were transfected with the indicated siRNAs. After 72 h, cells were fixed and stained for F-actin (Alexa Fluor 546 phalloidin) and DNA (DAPI). Cell area was measured using ImageJ from F-actin-stained images. Scatter dot plots show mean +/− SEM; n = 3, **p ≤ 0.01, ***p ≤ 0.001, Student’s t test. Relative RhoH mRNA levels in T47D cells were determined by qPCR using GAPDH as control. Mean +/− SEM, n = 3, ***p ≤ 0.001, Student’s t test. g RhoH depletion leads to an increase in binucleated cells. Cells were fixed 72 h after siRNA transfection and stained for F-actin (Alexa Fluor 546 phalloidin) and DNA (DAPI). The % of cells with two or more nuclei were scored; at least 250 cells per condition were analysed from five independent experiments. Graphs show mean +/− SEM, n = 5, *p ≤ 0.05, ***p ≤ 0.001, Student’s t test. h RhoH depletion reduces cell number. PC3 cell numbers were counted 96 h after siRNA transfection. Graphs show mean +/− SEM, n = 3, *p ≤ 0.05, **p ≤ 0.01, Student’s t test
Fig. 6 RhoH affects cell shape in PC3 cells. Analysis of cell shape. PC3 cells were transfected with the indicated siRNAs targeting RhoH or control siRNA. After 48 h, cells were seeded on Matrigel-coated glass coverslips. 72 h after transfection, cells were fixed and stained for F-actin (Alexa Fluor 546 phalloidin), tubulin (fluorescein isothiocyanate (FITC)-labelled anti-tubulin antibody) and DNA (4′,6-diamidino-2-phenylindole (DAPI)). a Representative images of cells. Scale bar 10 μm. Arrows indicate examples of binucleated cells. b–d PC3 cell area, shape factor and elongation factor were measured using ImageJ from F-actin-stained images. Scatter dot plots show mean +/− SEM; at least 60 cells per condition were analysed from three independent experiments, *p ≤ 0.05, **p ≤ 0.01, ***p ≤ 0.001, Student’s t test. e Quantification of the number of extended protrusions during cell migration. Panels show representative images of siControl- or siRhoH-transfected cells. Arrows indicate protrusions on migrating cells. Graph shows the average number of protrusions per cell relative to control ***p ≤ 0.001. f T47D cells were transfected with the indicated siRNAs. After 72 h, cells were fixed and stained for F-actin (Alexa Fluor 546 phalloidin) and DNA (DAPI). Cell area was measured using ImageJ from F-actin-stained images. Scatter dot plots show mean +/− SEM; n = 3, **p ≤ 0.01, ***p ≤ 0.001, Student’s t test. Relative RhoH mRNA levels in T47D cells were determined by qPCR using GAPDH as control. Mean +/− SEM, n = 3, ***p ≤ 0.001, Student’s t test. g RhoH depletion leads to an increase in binucleated cells. Cells were fixed 72 h after siRNA transfection and stained for F-actin (Alexa Fluor 546 phalloidin) and DNA (DAPI). The % of cells with two or more nuclei were scored; at least 250 cells per condition were analysed from five independent experiments. Graphs show mean +/− SEM, n = 5, *p ≤ 0.05, ***p ≤ 0.001, Student’s t test. h RhoH depletion reduces cell number. PC3 cell numbers were counted 96 h after siRNA transfection. Graphs show mean +/− SEM, n = 3, *p ≤ 0.05, **p ≤ 0.01, Student’s t testCC BY · PubMed Central
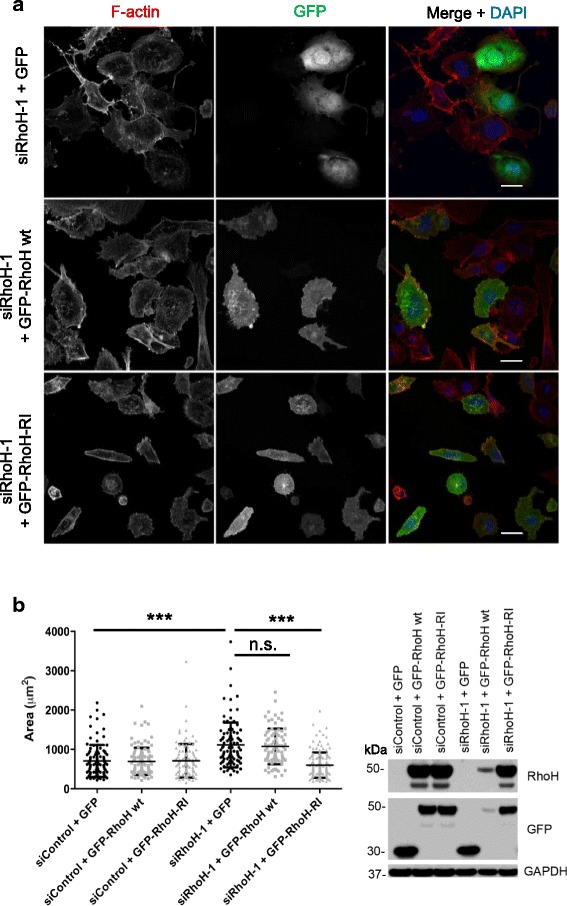
Fig. 7 GFP-RhoH rescues the morphological phenotype of RhoH-depleted cells. a Representative images of PC3 cells transfected with GFP, GFP-RhoH-wt or GFP-RhoH-R1 (resistant to siRhoH-1) 48 h after siRNA transfection with siRhoH-1 or control siRNA. Cells were fixed 24 h after plasmid transfection and stained for F-actin with Alexa Fluor 546 phalloidin and for DNA with DAPI. Scale bars 20 μm. b Left, cell area was measured using ImageJ from F-actin-stained images. Scatter dot plots show mean +/− SEM; at least 84 cells/condition were analysed from three independent experiments, n.s. not significant, ***p ≤ 0.001, by one-way analysis of variance (ANOVA). Right, representative immunoblot from cell lysates, probed with the indicated antibodies. GAPDH was used as a loading control
Fig. 7 GFP-RhoH rescues the morphological phenotype of RhoH-depleted cells. a Representative images of PC3 cells transfected with GFP, GFP-RhoH-wt or GFP-RhoH-R1 (resistant to siRhoH-1) 48 h after siRNA transfection with siRhoH-1 or control siRNA. Cells were fixed 24 h after plasmid transfection and stained for F-actin with Alexa Fluor 546 phalloidin and for DNA with DAPI. Scale bars 20 μm. b Left, cell area was measured using ImageJ from F-actin-stained images. Scatter dot plots show mean +/− SEM; at least 84 cells/condition were analysed from three independent experiments, n.s. not significant, ***p ≤ 0.001, by one-way analysis of variance (ANOVA). Right, representative immunoblot from cell lysates, probed with the indicated antibodies. GAPDH was used as a loading controlCC BY · PubMed Central
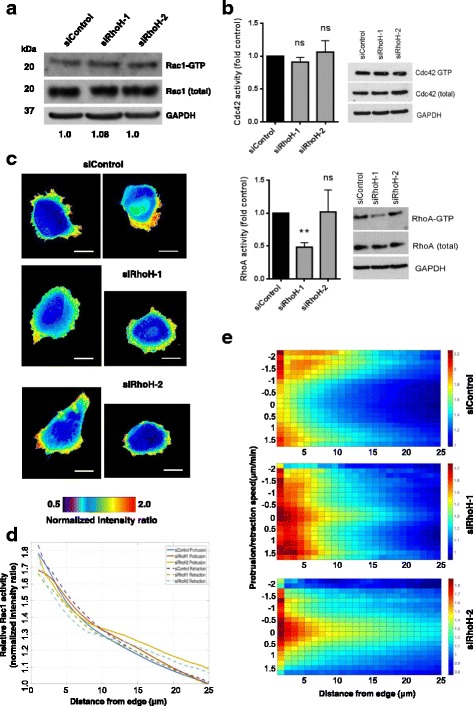
Fig. 8 RhoH alters the distribution of active Rac1. a RhoH does not affect total Rac1 activity. PC3 cells transfected with the indicated siRNAs were analysed for Rac1 activity using GST-PBD and pulldown assays. Blot is representative of three independent experiments. The ratio of GTP-Rac1/Total Rac1 (compared to siControl) is indicated under the blot panels. b RhoH does not affect RhoA or Cdc42 activity. PC3 cells transfected with the indicated siRNAs were analysed for Cdc42 (top) or RhoA (bottom) activity using GST-RBD or GST-PBD beads and pulldown assays. Blot is representative of three independent experiments. Graph shows the ratio of GTP-RhoA/Total RhoA or GTP-Cdc42/Total Cdc42 (compared to siControl); n = 3, ns non-significant, **p ≤ 0.01, Student’s t test. c–e RhoH affects Rac1 activity distribution. 24 h after transfection with the indicated siRNAs, cells were transfected with DNA encoding a Rac1 biosensor including YPet PAK1-PBD and CyPet Rac1. Cells were imaged 24 h later by time-lapse microscopy on a wide-field microscope by epifluorescence. c Two example images of Rac1 activity distribution are shown for each siRNA. Scale bars 20 μm. d Graph of line scans (12 cells × 60 frames per cell) showing Rac1 activity with respect to distance from the edge of the cell and also depending on whether the cell edge was protruding or retracting. e Rac1 activity as a function of distance from cell edge and speed of membrane protrusion or retraction, n = 12 cells per condition
Fig. 8 RhoH alters the distribution of active Rac1. a RhoH does not affect total Rac1 activity. PC3 cells transfected with the indicated siRNAs were analysed for Rac1 activity using GST-PBD and pulldown assays. Blot is representative of three independent experiments. The ratio of GTP-Rac1/Total Rac1 (compared to siControl) is indicated under the blot panels. b RhoH does not affect RhoA or Cdc42 activity. PC3 cells transfected with the indicated siRNAs were analysed for Cdc42 (top) or RhoA (bottom) activity using GST-RBD or GST-PBD beads and pulldown assays. Blot is representative of three independent experiments. Graph shows the ratio of GTP-RhoA/Total RhoA or GTP-Cdc42/Total Cdc42 (compared to siControl); n = 3, ns non-significant, **p ≤ 0.01, Student’s t test. c–e RhoH affects Rac1 activity distribution. 24 h after transfection with the indicated siRNAs, cells were transfected with DNA encoding a Rac1 biosensor including YPet PAK1-PBD and CyPet Rac1. Cells were imaged 24 h later by time-lapse microscopy on a wide-field microscope by epifluorescence. c Two example images of Rac1 activity distribution are shown for each siRNA. Scale bars 20 μm. d Graph of line scans (12 cells × 60 frames per cell) showing Rac1 activity with respect to distance from the edge of the cell and also depending on whether the cell edge was protruding or retracting. e Rac1 activity as a function of distance from cell edge and speed of membrane protrusion or retraction, n = 12 cells per conditionCC BY · PubMed Central
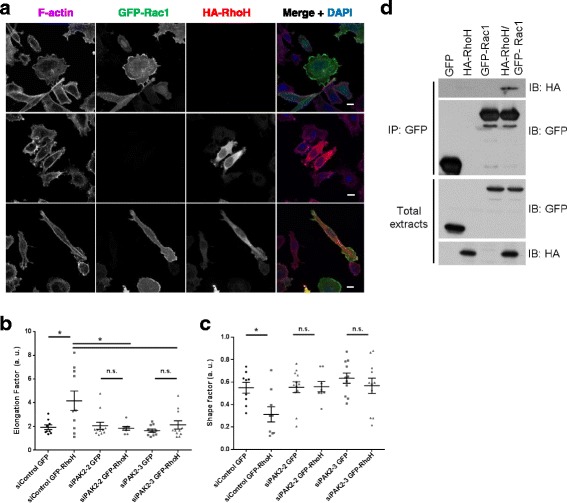
Fig. 9 RhoH co-localizes and interacts with Rac1. a RhoH partially co-localizes with Rac1. Cells were seeded on Matrigel-coated coverslips and transfected with GFP-Rac1 and/or HA-RhoH as indicated. After 24 h cells were fixed and stained for F-actin with Alexa Fluor 633 phalloidin, for anti-HA antibodies for HA-RhoH and for DNA with DAPI. Images were acquired by confocal microscopy. Scale bar 10 μm. b, c RhoH promotes cell elongation, which is not affected by PAK2. 48 h after siRNA transfection with siPAK2-2/3 or control siRNA, cells were transfected with GFP or GFP-RhoH. Cells were fixed and stained for F-actin with Alexa Fluor 546 phalloidin and DNA with DAPI. Cell elongation factor and shape factor were measured using ImageJ from F-actin-stained images. Scatter dot plots show mean +/− SEM; cells were analysed from three independent experiments, n.s. non-significant, *p ≤ 0.05, Student’s t test. d Rac1 and RhoH co-immunoprecipitate. COS7 cells were transfected with constructs encoding GFP, HA-RhoH and/or GFP-Rac1 as indicated. After 24 h, lysates were immunoprecipitated with anti-GFP and analysed by western blotting with the indicated antibodies
Fig. 9 RhoH co-localizes and interacts with Rac1. a RhoH partially co-localizes with Rac1. Cells were seeded on Matrigel-coated coverslips and transfected with GFP-Rac1 and/or HA-RhoH as indicated. After 24 h cells were fixed and stained for F-actin with Alexa Fluor 633 phalloidin, for anti-HA antibodies for HA-RhoH and for DNA with DAPI. Images were acquired by confocal microscopy. Scale bar 10 μm. b, c RhoH promotes cell elongation, which is not affected by PAK2. 48 h after siRNA transfection with siPAK2-2/3 or control siRNA, cells were transfected with GFP or GFP-RhoH. Cells were fixed and stained for F-actin with Alexa Fluor 546 phalloidin and DNA with DAPI. Cell elongation factor and shape factor were measured using ImageJ from F-actin-stained images. Scatter dot plots show mean +/− SEM; cells were analysed from three independent experiments, n.s. non-significant, *p ≤ 0.05, Student’s t test. d Rac1 and RhoH co-immunoprecipitate. COS7 cells were transfected with constructs encoding GFP, HA-RhoH and/or GFP-Rac1 as indicated. After 24 h, lysates were immunoprecipitated with anti-GFP and analysed by western blotting with the indicated antibodiesCC BY · PubMed Central
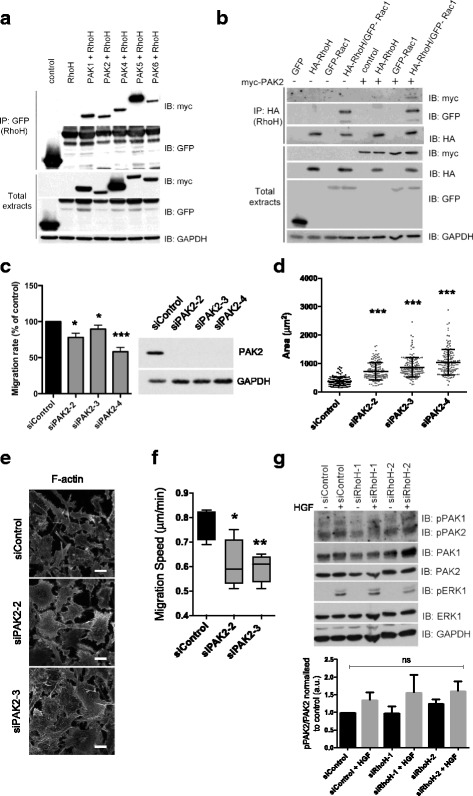
Fig. 10 PAK2 mediates the effects of RhoH on cell shape. a, b RhoH co-immunoprecipitates with PAKs. COS7 cells were transfected with constructs encoding GFP-RhoH and myc epitope-tagged PAKs (a) or HA-RhoH, GFP-Rac1, Myc-PAK2 or GFP alone (b). After 24 h, lysates were incubated with GFP-Trap beads (GFP IP) followed by western blotting with the indicated antibodies. Results shown are representative of three independent experiments. c PAK2 depletion reduces cell migration. PC3 cells were transfected with the indicated siRNAs and Oris™ migration assay carried out as in Fig. 2. Migration is shown as a percentage of siControl +/− SEM, n = 3; *p ≤ 0.5, ***p ≤ 0.001, Student’s t test. Representative immunoblot from cell lysates probed with the indicated antibodies. GAPDH was used as loading control. d–f PAK2 depletion increases cell area and decreases migration. PC3 cells were transfected with the indicated siRNAs. d After 72 h, cells were fixed and stained for F-actin (Alexa Fluor 546 phalloidin) and DNA (DAPI). Cell area was measured from F-actin-stained images. Scatter dot plots show mean +/− SEM; n = 3 (> 125 cells/condition), ***p ≤ 0.001, Student’s t test. e Representative images used for d; scale bar 10 μm. f Cells were seeded 48 h after transfection in RPMI containing 0.1% FCS and monitored by time-lapse microscopy for 24 h, images taken every 5 min. At least 50 cells were tracked from two independent experiments. Boxes of box and whisker plots show median, 25th and 75th percentiles; whiskers show minimum and maximum values; *p ≤ 0.05, **p ≤ 0.01, Student’s t test. g RhoH does not alter PAK activity. PC3 cells were transfected with the indicated siRNAs, cultured for 24 h in medium containing 0.1% FCS then stimulated with 20 ng/ml HGF for 10 min. Cell lysates were probed with the indicated antibodies. Anti-phospho-PAK recognises PAK1, PAK2 and PAK3. GAPDH was used as loading control. Graph shows densitometric quantification of western blots. n = 3; ns non-significant, Student’s t test
Fig. 10 PAK2 mediates the effects of RhoH on cell shape. a, b RhoH co-immunoprecipitates with PAKs. COS7 cells were transfected with constructs encoding GFP-RhoH and myc epitope-tagged PAKs (a) or HA-RhoH, GFP-Rac1, Myc-PAK2 or GFP alone (b). After 24 h, lysates were incubated with GFP-Trap beads (GFP IP) followed by western blotting with the indicated antibodies. Results shown are representative of three independent experiments. c PAK2 depletion reduces cell migration. PC3 cells were transfected with the indicated siRNAs and Oris™ migration assay carried out as in Fig. 2. Migration is shown as a percentage of siControl +/− SEM, n = 3; *p ≤ 0.5, ***p ≤ 0.001, Student’s t test. Representative immunoblot from cell lysates probed with the indicated antibodies. GAPDH was used as loading control. d–f PAK2 depletion increases cell area and decreases migration. PC3 cells were transfected with the indicated siRNAs. d After 72 h, cells were fixed and stained for F-actin (Alexa Fluor 546 phalloidin) and DNA (DAPI). Cell area was measured from F-actin-stained images. Scatter dot plots show mean +/− SEM; n = 3 (> 125 cells/condition), ***p ≤ 0.001, Student’s t test. e Representative images used for d; scale bar 10 μm. f Cells were seeded 48 h after transfection in RPMI containing 0.1% FCS and monitored by time-lapse microscopy for 24 h, images taken every 5 min. At least 50 cells were tracked from two independent experiments. Boxes of box and whisker plots show median, 25th and 75th percentiles; whiskers show minimum and maximum values; *p ≤ 0.05, **p ≤ 0.01, Student’s t test. g RhoH does not alter PAK activity. PC3 cells were transfected with the indicated siRNAs, cultured for 24 h in medium containing 0.1% FCS then stimulated with 20 ng/ml HGF for 10 min. Cell lysates were probed with the indicated antibodies. Anti-phospho-PAK recognises PAK1, PAK2 and PAK3. GAPDH was used as loading control. Graph shows densitometric quantification of western blots. n = 3; ns non-significant, Student’s t testCC BY · PubMed Central
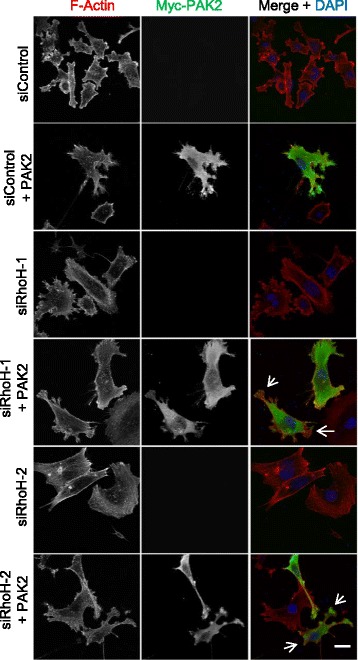
Fig. 11 RhoH depletion alters PAK2 localisation and PAK2-induced lamellipodia. PC3 cells were transfected with the indicated siRNAs. After 48 h, cells were transfected with empty vector or vector encoding myc-PAK2. Cells were fixed 24 h later and stained for F-actin with Alexa Fluor 546 phalloidin, anti-myc antibodies for Myc-PAK2 and DNA (DAPI). Representative images of cells are shown. Scale bar 10 μm. Arrows indicate protrusions with no PAK2 or in which PAK2 does not overlap with F-actin
Fig. 11 RhoH depletion alters PAK2 localisation and PAK2-induced lamellipodia. PC3 cells were transfected with the indicated siRNAs. After 48 h, cells were transfected with empty vector or vector encoding myc-PAK2. Cells were fixed 24 h later and stained for F-actin with Alexa Fluor 546 phalloidin, anti-myc antibodies for Myc-PAK2 and DNA (DAPI). Representative images of cells are shown. Scale bar 10 μm. Arrows indicate protrusions with no PAK2 or in which PAK2 does not overlap with F-actinCC BY · PubMed Central

Verification

Claims the paper makes

The claims and statistics of this paper haven’t been checked yet.

Run the check — free, no account needed. It reads the open-access text and checks the sources it cites.

A few free checks a day · papers already verified open instantly · results are public

Claims other papers make about this one

Each is checked against this paper’s own text: does it say what the citing paper says it does?

Self-check

Percentages, sums and reported differences re-computed from the paper’s own numbers.

The self-check needs the paper’s full text.

Citations

Cites

Research works printed but not linked: 48

  1. Friedl P, Alexander S. Cancer invasion and the microenvironment: plasticity and reciprocity. Cell. 2011;147:992–1009. · DOI · Paper page
  2. Chi Z, Melendez AJ. Role of cell adhesion molecules and immune-cell migration in the initiation, onset and development of atherosclerosis. Cell Adh Migr. 2007;1:171–5. · DOI
  3. Barreiro O, Martin P, Gonzalez-Amaro R, Sanchez-Madrid F. Molecular cues guiding inflammatory responses. Cardiovasc Res. 2010;86:174–82. · DOI
  4. Ridley AJ. Life at the leading edge. Cell. 2011;145:1012–22. · DOI
  5. Mardilovich K, Olson MF, Baugh M. Targeting Rho GTPase signaling for cancer therapy. Future Oncol. 2012;8:165–77. · DOI
  6. Cherfils J, Zeghouf M. Regulation of small GTPases by GEFs, GAPs, and GDIs. Physiol Rev. 2013;93:269–309. · DOI · Paper page
  7. Garcia-Mata R, Boulter E, Burridge K. The 'invisible hand': regulation of RHO GTPases by RHOGDIs. Nat Rev Mol Cell Biol. 2011;12:493–504. · DOI · Paper page
  8. Aspenstrom P, Ruusala A, Pacholsky D. Taking Rho GTPases to the next level: the cellular functions of atypical Rho GTPases. Exp Cell Res. 2007;313:3673–9. · DOI · Paper page
  9. Riou P, Villalonga P, Ridley AJ. Rnd proteins: multifunctional regulators of the cytoskeleton and cell cycle progression. Bioessays. 2010;32:986–92. · DOI
  10. Riou P, Kjaer S, Garg R, Purkiss A, George R, Cain RJ, Bineva G, Reymond N, McColl B, Thompson AJ, et al. 14-3-3 proteins interact with a hybrid prenyl-phosphorylation motif to inhibit G proteins. Cell. 2013;153:640–53. · DOI
  11. Matsumoto M, Oyamada K, Takahashi H, Sato T, Hatakeyama S, Nakayama KI. Large-scale proteomic analysis of tyrosine-phosphorylation induced by T-cell receptor or B-cell receptor activation reveals new signaling pathways. Proteomics. 2009;9:3549–63. · DOI
  12. Rohn JL, Sims D, Liu T, Fedorova M, Schock F, Dopie J, Vartiainen MK, Kiger AA, Perrimon N, Baum B. Comparative RNAi screening identifies a conserved core metazoan actinome by phenotype. J Cell Biol. 2011;194:789–805. · DOI
  13. Bai SW, Herrera-Abreu MT, Rohn JL, Racine V, Tajadura V, Suryavanshi N, Bechtel S, Wiemann S, Baum B, Ridley AJ. Identification and characterization of a set of conserved and new regulators of cytoskeletal organization, cell morphology and migration. BMC Biol. 2011;9:54. · DOI
  14. Simpson KJ, Selfors LM, Bui J, Reynolds A, Leake D, Khvorova A, Brugge JS. Identification of genes that regulate epithelial cell migration using an siRNA screening approach. Nat Cell Biol. 2008;10:1027–38. · DOI
  15. Yang J, Fan J, Li Y, Li F, Chen P, Fan Y, Xia X, Wong ST. Genome-wide RNAi screening identifies genes inhibiting the migration of glioblastoma cells. PLoS One. 2013;8:e61915. · DOI
  16. Smolen GA, Zhang J, Zubrowski MJ, Edelman EJ, Luo B, Yu M, Ng LW, Scherber CM, Schott BJ, Ramaswamy S, et al. A genome-wide RNAi screen identifies multiple RSK-dependent regulators of cell migration. Genes Dev. 2010;24:2654–65. · DOI
  17. Valderrama F, Thevapala S, Ridley AJ. Radixin regulates cell migration and cell-cell adhesion through Rac1. J Cell Sci. 2012;125:3310–9. · DOI
  18. Vega FM, Thomas M, Reymond N, Ridley AJ. The Rho GTPase RhoB regulates cadherin expression and epithelial cell-cell interaction. Cell Commun Signal. 2015;13:6. · DOI
  19. Trusolino L, Bertotti A, Comoglio PM. MET signalling: principles and functions in development, organ regeneration and cancer. Nat Rev Mol Cell Biol. 2010;11:834–48. · DOI
  20. Reymond N, Im JH, Garg R, Vega FM, Borda d'Agua B, Riou P, Cox S, Valderrama F, Muschel RJ, Ridley AJ. Cdc42 promotes transendothelial migration of cancer cells through beta1 integrin. J Cell Biol. 2012;199:653–68. · DOI
  21. Boureux A, Vignal E, Faure S, Fort P. Evolution of the Rho family of ras-like GTPases in eukaryotes. Mol Biol Evol. 2007;24:203–16. · DOI · Paper page
  22. Lu A, Pfeffer SR. Golgi-associated RhoBTB3 targets cyclin E for ubiquitylation and promotes cell cycle progression. J Cell Biol. 2013;203:233–50. · DOI
  23. Matthys A, Van Craenenbroeck K, Lintermans B, Haegeman G, Vanhoenacker P. RhoBTB3 interacts with the 5-HT7a receptor and inhibits its proteasomal degradation. Cell Signal. 2012;24:1053–63. · DOI
  24. Ridley AJ. Rho GTPase signalling in cell migration. Curr Opin Cell Biol. 2015;36:103–12. · DOI
  25. Ding F, Yin Z, Wang HR. Ubiquitination in Rho signaling. Curr Top Med Chem. 2011;11:2879–87. · DOI
  26. Spang A, Shiba Y, Randazzo PA. Arf GAPs gatekeepers of vesicle generation. FEBS Lett. 2010;584:2646–51. · DOI
  27. Vega FM, Fruhwirth G, Ng T, Ridley AJ. RhoA and RhoC have distinct roles in migration and invasion by acting through different targets. J Cell Biol. 2011;193:655–65. · DOI
  28. Taylor BS, Schultz N, Hieronymus H, Gopalan A, Xiao Y, Carver BS, Arora VK, Kaushik P, Cerami E, Reva B, et al. Integrative genomic profiling of human prostate cancer. Cancer Cell. 2010;18:11–22. · DOI
  29. Eggert US, Kiger AA, Richter C, Perlman ZE, Perrimon N, Mitchison TJ, Field CM. Parallel chemical genetic and genome-wide RNAi screens identify cytokinesis inhibitors and targets. PLoS Biol. 2004;2:e379. · DOI
  30. Castoreno AB, Smurnyy Y, Torres AD, Vokes MS, Jones TR, Carpenter AE, Eggert US. Small molecules discovered in a pathway screen target the Rho pathway in cytokinesis. Nat Chem Biol. 2010;6:457–63. · DOI
  31. Machacek M, Hodgson L, Welch C, Elliott H, Pertz O, Nalbant P, Abell A, Johnson GL, Hahn KM, Danuser G. Coordination of Rho GTPase activities during cell protrusion. Nature. 2009;461:99–103. · DOI
  32. Hinde E, Yokomori K, Gaus K, Hahn KM, Gratton E. Fluctuation-based imaging of nuclear Rac1 activation by protein oligomerisation. Sci Rep. 2014;4:4219. · DOI
  33. Allen RJ, Tsygankov D, Zawistowski JS, Elston TC, Hahn KM. Automated line scan analysis to quantify biosensor activity at the cell edge. Methods. 2014;66:162–7. · DOI
  34. Wang H, Zeng X, Fan Z, Lim B. RhoH plays distinct roles in T-cell migrations induced by different doses of SDF1 alpha. Cell Signal. 2010;22:1022–32. · DOI · Paper page
  35. Wu X, Frost JA. Multiple Rho proteins regulate the subcellular targeting of PAK5. Biochem Biophys Res Commun. 2006;351:328–35. · DOI
  36. Bright MD, Garner AP, Ridley AJ. PAK1 and PAK2 have different roles in HGF-induced morphological responses. Cell Signal. 2009;21:1738–47. · DOI
  37. Dharmawardhane S, Sanders LC, Martin SS, Daniels RH, Bokoch GM. Localization of p21-activated kinase 1 (PAK1) to pinocytic vesicles and cortical actin structures in stimulated cells. J Cell Biol. 1997;138:1265–78. · DOI
  38. Gu Y, Jasti AC, Jansen M, Siefring JE. RhoH, a hematopoietic-specific Rho GTPase, regulates proliferation, survival, migration, and engraftment of hematopoietic progenitor cells. Blood. 2005;105:1467–75. · DOI · Paper page
  39. Baker CM, Comrie WA, Hyun YM, Chung HL, Fedorchuk CA, Lim K, Brakebusch C, McGrath JL, Waugh RE, Meier-Schellersheim M, et al. Opposing roles for RhoH GTPase during T-cell migration and activation. Proc Natl Acad Sci U S A. 2012;109:10474–9. · DOI · Paper page
  40. Dorn T, Kuhn U, Bungartz G, Stiller S, Bauer M, Ellwart J, Peters T, Scharffetter-Kochanek K, Semmrich M, Laschinger M, et al. RhoH is important for positive thymocyte selection and T-cell receptor signaling. Blood. 2007;109:2346–55. · DOI · Paper page
  41. Steffen A, Ladwein M, Dimchev GA, Hein A, Schwenkmezger L, Arens S, Ladwein KI, Margit Holleboom J, Schur F, Victor Small J, et al. Rac function is crucial for cell migration but is not required for spreading and focal adhesion formation. J Cell Sci. 2013;126:4572–88. · DOI
  42. Hajdo-Milasinovic A, Ellenbroek SI, van Es S, van der Vaart B, Collard JG. Rac1 and Rac3 have opposing functions in cell adhesion and differentiation of neuronal cells. J Cell Sci. 2007;120:555–66. · DOI
  43. Chan AY, Coniglio SJ, Chuang YY, Michaelson D, Knaus UG, Philips MR, Symons M. Roles of the Rac1 and Rac3 GTPases in human tumor cell invasion. Oncogene. 2005;24:7821–9. · DOI · Paper page
  44. Jiang N, Hjorth-Jensen K, Hekmat O, Iglesias-Gato D, Kruse T, Wang C, Wei W, Ke B, Yan B, Niu Y, et al. In vivo quantitative phosphoproteomic profiling identifies novel regulators of castration-resistant prostate cancer growth. Oncogene. 2015;34:2764–76. · DOI
  45. Lawson CD, Burridge K. The on-off relationship of Rho and Rac during integrin-mediated adhesion and cell migration. Small GTPases 2014;5:e27958. · DOI
  46. de Felipe P. Skipping the co-expression problem: the new 2A "CHYSEL" technology. Genet Vaccines Ther. 2004;2:13. · DOI
  47. Hodgson L, Shen F, Hahn K. Biosensors for characterizing the dynamics of rho family GTPases in living cells. Curr Protoc Cell Biol. 2010;14(Unit 14.11):1–26.
  48. Cerami E, Gao J, Dogrusoz U, Gross BE, Sumer SO, Aksoy BA, Jacobsen A, Byrne CJ, Heuer ML, Larsson E, et al. The cBio cancer genomics portal: an open platform for exploring multidimensional cancer genomics data. Cancer Discov. 2012;2:401–4. · DOI · Paper page

Cited by

See all 34

Metadata

Authors
Tajadura-Ortega, V., Garg, R., Allen, R., Owczarek, C., Bright, M. D., Kean, S., Mohd-Noor, A., Grigoriadis, A., Elston, T. C., Hahn, K. M., & Ridley, A. J.
Venue
BMC Biology
Published
2018-03-06
Volume
16
Issue
1
ISSN
1741-7007
Cited by
34
References
4
Language
en
Funders
  • Cancer Research UK (C6220/A8833, C6620/A15961, C41786/A132)
  • Fundacion Ramon Areces
  • National Institutes of Health (PO1-GM103723, U01-EB018816, R01-GM079271)

About these checks

Registry, retraction, Cites and statistics results are computed, not judged, with one exception: a printed reference that no index lists is read once by a model before it counts as a citation error. Claims are extracted by a model and kept only when their quote appears verbatim in the text; each cited source is then checked, with a model’s help, for whether it says what the claim relies on. Those verdicts can be wrong — read the claim’s quote and the cited source before relying on one.

Statistics and arithmetic are recomputed, not judged.

Confidence bands are shown only for fields calibrated on our annotated test set. None is calibrated yet, so no band is shown.

What counts as a claim ›How we measure confidence ›How we check this ›

Are you an author, or do you see a problem with this page? Request a review