

The DOI matches its Crossref record; 37 of the 39 references it cites were found in a registry or an index; none of the 6 sources its claims cite is checked for support yet.
Objectively measured physical activity and sedentary time in youth: the International Children's Accelerometry Database (ICAD)
Open accessAbstract
BACKGROUND: Physical activity and sedentary behaviour in youth have been reported to vary by sex, age, weight status and country. However, supporting data are often self-reported and/or do not encompass a wide range of ages or geographical locations. This study aimed to describe objectively-measured physical activity and sedentary time patterns in youth. METHODS: The International Children's Accelerometry Database (ICAD) consists of ActiGraph accelerometer data from 20 studies in ten countries, processed using common data reduction procedures. Analyses were conducted on 27,637 participants (2.8-18.4 years) who provided at least three days of valid accelerometer data. Linear regression was used to examine associations between age, sex, weight status, country and physical activity outcomes. RESULTS: Boys were less sedentary and more active than girls at all ages. After 5 years of age there was an average cross-sectional decrease of 4.2% in total physical activity with each additional year of age, due mainly to lower levels of light-intensity physical activity and greater time spent sedentary. Physical activity did not differ by weight status in the youngest children, but from age seven onwards, overweight/obese participants were less active than their normal weight counterparts. Physical activity varied between samples from different countries, with a 15-20% difference between the highest and lowest countries at age 9-10 and a 26-28% difference at age 12-13. CONCLUSIONS: Physical activity differed between samples from different countries, but the associations between demographic characteristics and physical activity were consistently observed. Further research is needed to explore environmental and sociocultural explanations for these differences.
Overview
AI snapshot
Written from the paper’s full text.
TL;DR
This pooled analysis of ActiGraph accelerometer data from 20 studies in ten countries described physical activity and sedentary time in 27,637 youth aged 2.8–18.4 years. It found consistent sex, age, and weight-status differences, plus substantial between-country variation, despite use of common data-reduction procedures.
Key findings
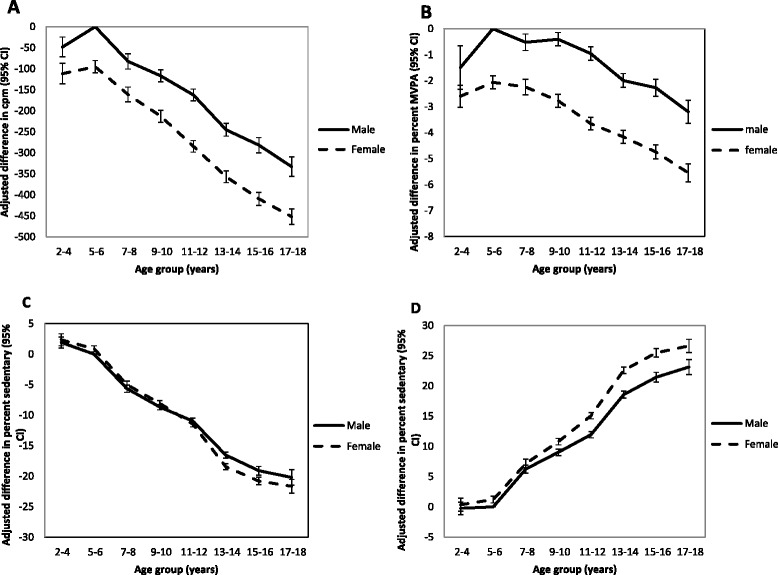
- Boys were less sedentary and more active than girls at all ages. After age 5, total physical activity decreased cross-sectionally by an average of 4.2% per additional year (3.7% in boys, 4.6% in girls), mainly through lower light-intensity activity and greater sedentary time.
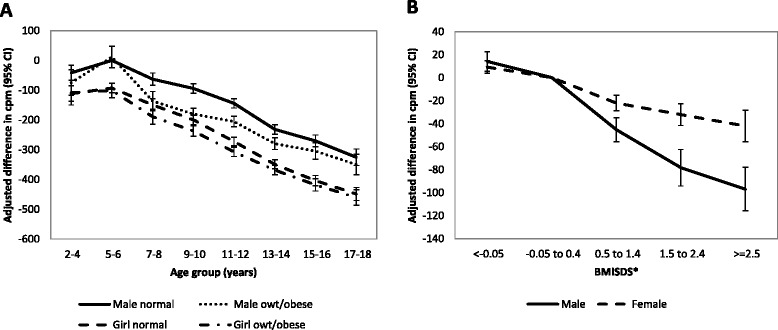
- Physical activity did not differ by weight status in the youngest children, but from age seven onwards overweight/obese participants were less active than normal-weight peers; this showed a dose–response relationship in both sexes and was particularly large in boys.
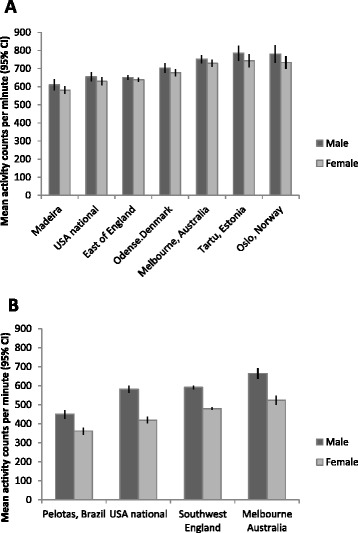
- Between-country differences were substantial: at age 9–10 the difference between the least active population (Madeira) and most active (Oslo, Norway) was 15–20% (156 cpm in boys, 613 vs. 769; 99 cpm in girls, 561 vs. 660), and at age 12–13 it was 26–28%.
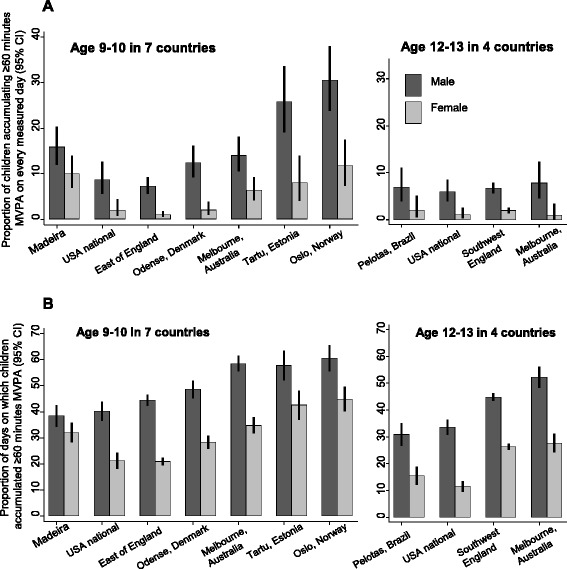
- Among 5–17 year olds in ICAD, only 9.0% of boys and 1.9% of girls achieved ≥60 min MVPA every valid day; ≥60 min MVPA was accumulated on 46% of valid days for boys and 22% for girls, with Norwegian boys aged 9–10 recording the highest values (60.5% of measured days).
Methods
- ICAD pooled ActiGraph accelerometer data from 20 studies in ten countries using a standard data-reduction procedure. Analyses included 27,637 participants (92% of 29,967 potential participants) aged 2.8–18.4 years with at least 3 valid days (mean 5.3, range 3–7), providing 188,416 valid days across 35,360 time points.
- Linear regression examined cross-sectional associations between age, sex, weight status, and physical activity outcomes, adjusted for study and season; robust standard errors accounted for repeated measures within participants. Country comparisons were restricted to ages 9–15 and ten studies from eight countries, using standardized within-country outcomes and random-effects meta-analysis.
- Physical activity outcomes included average accelerometer counts per minute (cpm) and percentage time sedentary (≤100 cpm), light (101–2295 cpm), and moderate-to-vigorous (≥2296 cpm). Guideline achievement was presented as ≥60 min MVPA on every valid day and as the percentage of valid days with ≥60 min MVPA.
Limitations
- The paper states that the sample was skewed toward ages 9–15 (82% of measurement time points) and the UK and USA (73% of measurement time points); some countries had too few participants for country-level analysis, countries were not globally representative, and low- and middle-income countries were underrepresented. Most samples were not nationally representative, though generally at least regionally representative.
- The paper states accelerometer limitations: waist-worn accelerometers poorly record upper-body activity and cycling, potentially underestimating activity in high-cycling countries such as Denmark; they misclassify motionless-standing as sedentary, potentially overestimating sedentary time; and the MVPA thresholds perform poorly for ages 4–6 and are not validated under age 4.
- The paper notes that direction of causation between weight status and physical activity was not investigated and may be bidirectional, and that individual, social, and environmental explanations for between-country differences were not explored. Evident from the text: girls were over-represented (59%, falling to 52% after excluding one large study of adolescent girls), which may affect descriptive proportions.
Model-written summary. Check it against the paper before relying on it.
Integrity signals
Registry
Cites
Statistics
Figures
Verification
Claims the paper makes
19 Own result · 12 Own method · 5 Not checked yet · 4 Own interpretation
A result the paper reports from its own data — it cites no other source for it, so there is none to check. The quote shows it is in the paper.
In the paper
“At age 9–10, the difference between the least active population (Madeira) and the most active (Oslo, Norway) was 15–20 % (156 cpm in boys (613 vs. 769) and 99 cpm in girls (561 vs. 660)).”
§ Objectively measured physical activity and sedentary time in youth: the International children’s accelerometry database (ICAD) > Results > Cross-country comparisons of physical activity
plain- Asserted: passes — The authors put it forward as true.
- Checkable: passes — It can be checked against evidence.
- Load-bearing: unclear — It is unclear whether the paper’s conclusions depend on it.
- Based: passes — The paper gives a reason why it holds.
A result the paper reports from its own data — it cites no other source for it, so there is none to check. The quote shows it is in the paper.
In the paper
“At age 12–13, even larger differences were seen (26–28 % between the highest and lowest countries).”
§ Objectively measured physical activity and sedentary time in youth: the International children’s accelerometry database (ICAD) > Results > Cross-country comparisons of physical activity
plain- Asserted: passes — The authors put it forward as true.
- Checkable: passes — It can be checked against evidence.
- Load-bearing: unclear — It is unclear whether the paper’s conclusions depend on it.
- Based: passes — The paper gives a reason why it holds.
A result the paper reports from its own data — it cites no other source for it, so there is none to check. The quote shows it is in the paper.
In the paper
“due mainly to lower levels of light-intensity physical activity and greater time spent sedentary”
- Also stated in: § Physical activity by sex, age and weight status · plain
“Simultaneous with the reduction in total physical activity and percentage time in MVPA between increasing age groups, light physical activity (Fig. 1c) declined and sedentary time increased (Fig. 1d).”
- Also stated in: § Discussion · plain
“the lower levels of overall physical activity with increasing age were reflected by a progressive increase in the volume of sedentary time and an almost equivalent ‘displacement’ of light-intensity physical activity.”
§ Objectively measured physical activity and sedentary time in youth: the International children’s accelerometry database (ICAD) > Abstract > Results
plaindirect- Asserted: passes — The authors put it forward as true.
- Checkable: passes — It can be checked against evidence.
- Load-bearing: passes — The paper’s conclusions depend on it.
- Based: passes — The paper gives a reason why it holds.
- Also stated in: § Physical activity by sex, age and weight status · plain
A result the paper reports from its own data — it cites no other source for it, so there is none to check. The quote shows it is in the paper.
In the paper
“Overweight/obesity was not associated with total physical activity in the youngest age groups (age 2–6)”
- Also stated in: § Results · plain
“Physical activity did not differ by weight status in the youngest children”
§ Objectively measured physical activity and sedentary time in youth: the International children’s accelerometry database (ICAD) > Results > Physical activity by sex, age and weight status
plain- Asserted: passes — The authors put it forward as true.
- Checkable: passes — It can be checked against evidence.
- Load-bearing: passes — The paper’s conclusions depend on it.
- Based: passes — The paper gives a reason why it holds.
- Also stated in: § Results · plain
A result the paper reports from its own data — it cites no other source for it, so there is none to check. The quote shows it is in the paper.
In the paper
“but from age seven onwards, overweight/obese participants were less active than their normal weight counterparts.”
- Also stated in: § Physical activity by sex, age and weight status · plain
“but was consistently associated with lower total physical activity in older age groups (Fig. 2a).”
§ Objectively measured physical activity and sedentary time in youth: the International children’s accelerometry database (ICAD) > Abstract > Results
plaincorrelational- Asserted: passes — The authors put it forward as true.
- Checkable: passes — It can be checked against evidence.
- Load-bearing: passes — The paper’s conclusions depend on it.
- Based: passes — The paper gives a reason why it holds.
- Also stated in: § Physical activity by sex, age and weight status · plain
A result the paper reports from its own data — it cites no other source for it, so there is none to check. The quote shows it is in the paper.
In the paper
“When calculated relative to the average activity level at age 12, the annual difference was 5.8 % (4.7 % in boys, 6.8 % in girls; data not shown).”
§ Objectively measured physical activity and sedentary time in youth: the International children’s accelerometry database (ICAD) > Discussion
plaincorrelational- Asserted: passes — The authors put it forward as true.
- Checkable: passes — It can be checked against evidence.
- Load-bearing: passes — The paper’s conclusions depend on it.
- Based: passes — The paper gives a reason why it holds.
A result the paper reports from its own data — it cites no other source for it, so there is none to check. The quote shows it is in the paper.
In the paper
“After 5 years of age there was an average cross-sectional decrease of 4.2 % in total physical activity with each additional year of age”
- Also stated in: § Physical activity by sex, age and weight status · plain
“Overall, this is equivalent to an average annual reduction in total physical activity of 4.2 % relative to age five (3.7 % decrease in boys, 4.6 % decrease in girls).”
- Also stated in: § Discussion · plain
“The present study found a difference of 4.2 % per annum in overall physical activity when calculated with reference to the activity level at age five.”
§ Objectively measured physical activity and sedentary time in youth: the International children’s accelerometry database (ICAD) > Abstract > Results
plaincorrelationaln = 27,637- Asserted: passes — The authors put it forward as true.
- Checkable: passes — It can be checked against evidence.
- Load-bearing: passes — The paper’s conclusions depend on it.
- Based: passes — The paper gives a reason why it holds.
- Also stated in: § Physical activity by sex, age and weight status · plain
A result the paper reports from its own data — it cites no other source for it, so there is none to check. The quote shows it is in the paper.
In the paper
“comparison of data from Norway and the US shows that Norwegian 9–10 year old girls were, on average, as active as American boys (658 vs. 655 cpm).”
§ Objectively measured physical activity and sedentary time in youth: the International children’s accelerometry database (ICAD) > Discussion
plain- Asserted: passes — The authors put it forward as true.
- Checkable: passes — It can be checked against evidence.
- Load-bearing: passes — The paper’s conclusions depend on it.
- Based: passes — The paper gives a reason why it holds.
A result the paper reports from its own data — it cites no other source for it, so there is none to check. The quote shows it is in the paper.
In the paper
“Among 5–17 year olds in the ICAD database as a whole only, 9.0 % of boys and 1.9 % of girls achieved this”
§ Objectively measured physical activity and sedentary time in youth: the International children’s accelerometry database (ICAD) > Results > Cross-country comparisons of physical activity
plain- Asserted: passes — The authors put it forward as true.
- Checkable: passes — It can be checked against evidence.
- Load-bearing: passes — The paper’s conclusions depend on it.
- Based: passes — The paper gives a reason why it holds.
A result the paper reports from its own data — it cites no other source for it, so there is none to check. The quote shows it is in the paper.
In the paper
“≥60 min of MVPA were accumulated on a substantially higher percentage of days (46 % of valid days for boys and 22 % for girls)”
§ Objectively measured physical activity and sedentary time in youth: the International children’s accelerometry database (ICAD) > Results > Cross-country comparisons of physical activity
plain- Asserted: passes — The authors put it forward as true.
- Checkable: passes — It can be checked against evidence.
- Load-bearing: unclear — It is unclear whether the paper’s conclusions depend on it.
- Based: passes — The paper gives a reason why it holds.
- It may state two separate claims as one. 21
- Probably not a substantial claim. 6
A result the paper reports from its own data — it cites no other source for it, so there is none to check. The quote shows it is in the paper.
In the paper
“This association showed a dose–response relationship in both sexes, and was particularly large in boys (Fig. 2b).”
§ Objectively measured physical activity and sedentary time in youth: the International children’s accelerometry database (ICAD) > Results > Physical activity by sex, age and weight status
plaincorrelational- Asserted: passes — The authors put it forward as true.
- Checkable: passes — It can be checked against evidence.
- Load-bearing: passes — The paper’s conclusions depend on it.
- Based: passes — The paper gives a reason why it holds.
It may state two separate claims as one.
A result the paper reports from its own data — it cites no other source for it, so there is none to check. The quote shows it is in the paper.
In the paper
“there was no country in which this difference was not significant or where the point estimate for the difference was less than 0.2 standard deviations.”
§ Objectively measured physical activity and sedentary time in youth: the International children’s accelerometry database (ICAD) > Results > Cross-country comparisons of physical activity
plain- Asserted: passes — The authors put it forward as true.
- Checkable: passes — It can be checked against evidence.
- Load-bearing: passes — The paper’s conclusions depend on it.
- Based: passes — The paper gives a reason why it holds.
It may state two separate claims as one.
A result the paper reports from its own data — it cites no other source for it, so there is none to check. The quote shows it is in the paper.
In the paper
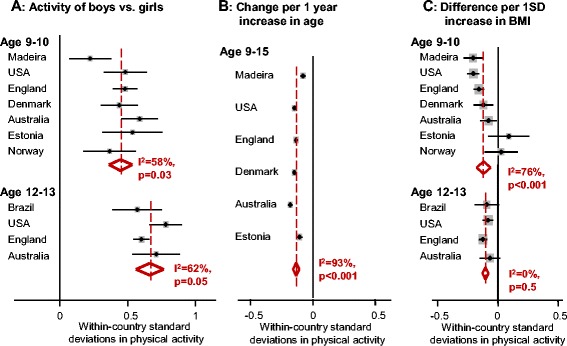
“Higher BMI was associated with lower physical activity in most countries, but this difference was not significant in all samples, including the two most active samples at age 9–10 (Fig 5c).”
§ Objectively measured physical activity and sedentary time in youth: the International children’s accelerometry database (ICAD) > Results > Cross-country comparisons of physical activity
plaincorrelationaln = 2- Asserted: passes — The authors put it forward as true.
- Checkable: passes — It can be checked against evidence.
- Load-bearing: unclear — It is unclear whether the paper’s conclusions depend on it.
- Based: passes — The paper gives a reason why it holds.
It may state two separate claims as one.
A result the paper reports from its own data — it cites no other source for it, so there is none to check. The quote shows it is in the paper.
In the paper
“The three countries that were represented twice were ranked in the same order, with the USA least active, England intermediate and Australia most active.”
§ Objectively measured physical activity and sedentary time in youth: the International children’s accelerometry database (ICAD) > Results > Cross-country comparisons of physical activity
plaincorrelational- Asserted: passes — The authors put it forward as true.
- Checkable: passes — It can be checked against evidence.
- Load-bearing: unclear — It is unclear whether the paper’s conclusions depend on it.
- Based: passes — The paper gives a reason why it holds.
It may state two separate claims as one.
A result the paper reports from its own data — it cites no other source for it, so there is none to check. The quote shows it is in the paper.
In the paper
“Boys were less sedentary and more active than girls at all ages.”
- Also stated in: § Physical activity by sex, age and weight status · plain
“Boys were more active and less sedentary than girls at all ages.”
- Also stated in: § Discussion · plain
“Physical activity was consistently lower in girls than boys”
§ Objectively measured physical activity and sedentary time in youth: the International children’s accelerometry database (ICAD) > Abstract > Results
plaincorrelationaln = 27,637- Asserted: passes — The authors put it forward as true.
- Checkable: passes — It can be checked against evidence.
- Load-bearing: passes — The paper’s conclusions depend on it.
- Based: passes — The paper gives a reason why it holds.
It may state two separate claims as one.
- Also stated in: § Physical activity by sex, age and weight status · plain
A result the paper reports from its own data — it cites no other source for it, so there is none to check. The quote shows it is in the paper.
In the paper
“In all countries, boys were more active than girls. On average, activity levels among boys were 0.45 standard deviations higher than in girls at age 9–10 and 0.66 standard deviations higher at age 12–13 (Fig. 5a).”
§ Objectively measured physical activity and sedentary time in youth: the International children’s accelerometry database (ICAD) > Results > Cross-country comparisons of physical activity
plaincorrelational- Asserted: passes — The authors put it forward as true.
- Checkable: passes — It can be checked against evidence.
- Load-bearing: passes — The paper’s conclusions depend on it.
- Based: passes — The paper gives a reason why it holds.
It may state two separate claims as one.
A result the paper reports from its own data — it cites no other source for it, so there is none to check. The quote shows it is in the paper.
In the paper
“Physical activity varied between samples from different countries, with a 15–20 % difference between the highest and lowest countries at age 9–10 and a 26–28 % difference at age 12–13.”
- Also stated in: § Cross-country comparisons of physical activity · plain
“Average accelerometer counts per minute varied substantially between countries, both at age 9–10 (Fig. 3a) and age 12–13 (Fig. 3b).”
§ Objectively measured physical activity and sedentary time in youth: the International children’s accelerometry database (ICAD) > Abstract > Results
plaincorrelational- Asserted: passes — The authors put it forward as true.
- Checkable: passes — It can be checked against evidence.
- Load-bearing: passes — The paper’s conclusions depend on it.
- Based: passes — The paper gives a reason why it holds.
It may state two separate claims as one.
- Also stated in: § Cross-country comparisons of physical activity · plain
What the paper did — it cites no source for this, so there is none to check. The quote shows it is in the paper.
In the paper
“There are many possible individual, social and environmental explanations for these differences that were not explored in this study.”
§ Objectively measured physical activity and sedentary time in youth: the International children’s accelerometry database (ICAD) > Discussion
hedged- Asserted: passes — The authors put it forward as true.
- Checkable: passes — It can be checked against evidence.
- Load-bearing: fails — The paper’s conclusions may not depend on it.
- Based: passes — The paper gives a reason why it holds.
Probably not a substantial claim. The paper’s conclusions may not depend on it.
What the paper did — it cites no source for this, so there is none to check. The quote shows it is in the paper.
In the paper
“The ICAD provides a large volume of accelerometer data reduced using a common protocol, which allows comparison of study samples from a number of countries.”
§ Objectively measured physical activity and sedentary time in youth: the International children’s accelerometry database (ICAD) > Conclusions
plaindirect- Asserted: passes — The authors put it forward as true.
- Checkable: passes — It can be checked against evidence.
- Load-bearing: passes — The paper’s conclusions depend on it.
- Based: passes — The paper gives a reason why it holds.
It may state two separate claims as one.
What the paper did — it cites no source for this, so there is none to check. The quote shows it is in the paper.
In the paper
“the countries included are not globally representative, with the US, UK and Northern Europe over-represented, few data from other geographical regions, and a dearth of data from low and middle-income countries.”
§ Objectively measured physical activity and sedentary time in youth: the International children’s accelerometry database (ICAD) > Discussion
plain- Asserted: passes — The authors put it forward as true.
- Checkable: passes — It can be checked against evidence.
- Load-bearing: unclear — It is unclear whether the paper’s conclusions depend on it.
- Based: passes — The paper gives a reason why it holds.
It may state two separate claims as one.
In the paper
“In addition, waist-worn accelerometers mis-classify time spent in motionless-standing as sedentary, which is not considered to be a sedentary behaviour (defined as “any waking behaviour characterised by an energy expenditure ≤1.5 metabolic equivalents (METs) while in a sitting or reclining posture” [35]), potentially leading to over estimates of the true volume of sedentary time.”
§ Objectively measured physical activity and sedentary time in youth: the International children’s accelerometry database (ICAD) > Discussion
What the sources say
- Not checked yetcites [35] Network SBR. Letter to the Editor: Standardized use of the terms “sedentary” and “sedentary behaviours”. Appl Physiol Nutr Metab. 2012;37:540–2. source
hedgedconditional- Asserted: passes — The authors put it forward as true.
- Checkable: passes — It can be checked against evidence.
- Load-bearing: unclear — It is unclear whether the paper’s conclusions depend on it.
- Based: passes — The paper gives a reason why it holds.
It may state two separate claims as one.
What the paper did — it cites no source for this, so there is none to check. The quote shows it is in the paper.
In the paper
“the number of participants in some countries did not allow analysis by country, and overall the sample is skewed towards two main age groups.”
§ Objectively measured physical activity and sedentary time in youth: the International children’s accelerometry database (ICAD) > Discussion
plain- Asserted: passes — The authors put it forward as true.
- Checkable: passes — It can be checked against evidence.
- Load-bearing: unclear — It is unclear whether the paper’s conclusions depend on it.
- Based: passes — The paper gives a reason why it holds.
It may state two separate claims as one.
What the paper did — it cites no source for this, so there is none to check. The quote shows it is in the paper.
In the paper
“most samples are not nationally representative, although studies have generally sampled to be at least regionally representative.”
§ Objectively measured physical activity and sedentary time in youth: the International children’s accelerometry database (ICAD) > Discussion
plain- Asserted: passes — The authors put it forward as true.
- Checkable: passes — It can be checked against evidence.
- Load-bearing: unclear — It is unclear whether the paper’s conclusions depend on it.
- Based: passes — The paper gives a reason why it holds.
It may state two separate claims as one.
What the paper did — it cites no source for this, so there is none to check. The quote shows it is in the paper.
In the paper
“The direction of causation in the association between weight status and physical activity was not investigated in this analysis”
§ Objectively measured physical activity and sedentary time in youth: the International children’s accelerometry database (ICAD) > Discussion
plain- Asserted: passes — The authors put it forward as true.
- Checkable: passes — It can be checked against evidence.
- Load-bearing: fails — The paper’s conclusions may not depend on it.
- Based: passes — The paper gives a reason why it holds.
Probably not a substantial claim. The paper’s conclusions may not depend on it.
In the paper
“a review of European studies using Actigraph accelerometers reported that 3–5 % of children met guidelines using an accelerometer threshold of >3000 cpm increasing to up to 87 % meeting guidelines using a threshold of >2000 cpm [20].”
§ Objectively measured physical activity and sedentary time in youth: the International children’s accelerometry database (ICAD) > Discussion
What the sources say
- Not checked yetcites [20] Guinhouya BC, Samouda H, de Beaufort C. Level of physical activity among children and adolescents in Europe: a review of physical activity assessed objectively by accelerometry. Public Health. 2013;127(4):301–11. source
plaindirect- Asserted: passes — The authors put it forward as true.
- Checkable: passes — It can be checked against evidence.
- Load-bearing: passes — The paper’s conclusions depend on it.
- Based: passes — The paper gives a reason why it holds.
It may state two separate claims as one.
What the paper did — it cites no source for this, so there is none to check. The quote shows it is in the paper.
In the paper
“In analyses comparing activity levels between countries, we restricted our analyses to children 9–10 or 12–13, resulting in a sample of 10,741 participants from ten studies in eight countries.”
§ Objectively measured physical activity and sedentary time in youth: the International children’s accelerometry database (ICAD) > Methods > Participants
plainn = 10,741- Asserted: passes — The authors put it forward as true.
- Checkable: passes — It can be checked against evidence.
- Load-bearing: passes — The paper’s conclusions depend on it.
- Based: passes — The paper gives a reason why it holds.
Probably not a substantial claim. It may state two separate claims as one.
In the paper
“A systematic review and pooled analysis [10] concluded that physical activity declined by approximately 7 % per year after the age of ten.”
§ Objectively measured physical activity and sedentary time in youth: the International children’s accelerometry database (ICAD) > Discussion
What the sources say
- Not checked yetcites [10] Dumith SC, Gigante DP, Domingues MR, HW K l. Physical activity change during adolescence: a systematic review and pooled analysis. Int J Epidemiol. 2011;40:685–98. source
plaincorrelational- Asserted: passes — The authors put it forward as true.
- Checkable: passes — It can be checked against evidence.
- Load-bearing: fails — The paper’s conclusions may not depend on it.
- Based: passes — The paper gives a reason why it holds.
Probably not a substantial claim. The paper’s conclusions may not depend on it.
What the paper did — it cites no source for this, so there is none to check. The quote shows it is in the paper.
In the paper
“All analyses were adjusted for the ICAD study from which the data was drawn and also for time of year (May-October vs. November-April, with the months inverted for the three studies from the Southern hemisphere).”
§ Objectively measured physical activity and sedentary time in youth: the International children’s accelerometry database (ICAD) > Methods > Measurements
plain- Asserted: passes — The authors put it forward as true.
- Checkable: passes — It can be checked against evidence.
- Load-bearing: passes — The paper’s conclusions depend on it.
- Based: passes — The paper gives a reason why it holds.
Probably not a substantial claim. It may state two separate claims as one.
What the paper did — it cites no source for this, so there is none to check. The quote shows it is in the paper.
In the paper
“Strengths of this study include a substantial sample of young people across a wide age range, a consistent measurement instrument and data reduction procedures, and physical activity data from a wide variety of countries.”
§ Objectively measured physical activity and sedentary time in youth: the International children’s accelerometry database (ICAD) > Discussion
plain- Asserted: passes — The authors put it forward as true.
- Checkable: passes — It can be checked against evidence.
- Load-bearing: passes — The paper’s conclusions depend on it.
- Based: passes — The paper gives a reason why it holds.
It may state two separate claims as one.
A conclusion the paper draws from its own results — it cites no other source for it, so there is none to check. The quote shows it is in the paper.
In the paper
“The consistent differences by age and sex persist even though the countries differ in total physical activity levels, suggesting that these differences may to an extent be biological.”
§ Objectively measured physical activity and sedentary time in youth: the International children’s accelerometry database (ICAD) > Discussion
hedgedconditional- Asserted: passes — The authors put it forward as true.
- Checkable: passes — It can be checked against evidence.
- Load-bearing: passes — The paper’s conclusions depend on it.
- Based: passes — The paper gives a reason why it holds.
It may state two separate claims as one.
What the paper did — it cites no source for this, so there is none to check. The quote shows it is in the paper.
In the paper
“The ICAD begins to address this issue by providing accelerometer data from a substantial sample of youth reduced using a standard methodology.”
- Also stated in: § Conclusions · plain
“The ICAD provides a large volume of accelerometer data reduced using a common protocol, which allows comparison of study samples from a number of countries.”
§ Objectively measured physical activity and sedentary time in youth: the International children’s accelerometry database (ICAD) > Discussion
plain- Asserted: passes — The authors put it forward as true.
- Checkable: passes — It can be checked against evidence.
- Load-bearing: passes — The paper’s conclusions depend on it.
- Based: passes — The paper gives a reason why it holds.
It may state two separate claims as one.
- Also stated in: § Conclusions · plain
A conclusion the paper draws from its own results — it cites no other source for it, so there is none to check. The quote shows it is in the paper.
In the paper
“Nevertheless, all countries were alike in showing the same differences in physical activity by sex, by age and (almost always) by weight status.”
§ Objectively measured physical activity and sedentary time in youth: the International children’s accelerometry database (ICAD) > Discussion
plaincorrelationaln = 27,637- Asserted: passes — The authors put it forward as true.
- Checkable: passes — It can be checked against evidence.
- Load-bearing: passes — The paper’s conclusions depend on it.
- Based: passes — The paper gives a reason why it holds.
It may state two separate claims as one.
What the paper did — it cites no source for this, so there is none to check. The quote shows it is in the paper.
In the paper
“When performing cross-sectional analyses, robust standard errors were used to adjust for the clustering of measurement waves within participants.”
§ Objectively measured physical activity and sedentary time in youth: the International children’s accelerometry database (ICAD) > Methods > Measurements
plain- Asserted: passes — The authors put it forward as true.
- Checkable: passes — It can be checked against evidence.
- Load-bearing: passes — The paper’s conclusions depend on it.
- Based: passes — The paper gives a reason why it holds.
Probably not a substantial claim.
In the paper
“When worn on the waist, as in the studies comprising the ICAD, they poorly record upper body physical activity and physical activity when cycling [34]. Thus, in countries with a high prevalence of cycling for transportation (e.g. Denmark), physical activity may be under-estimated.”
§ Objectively measured physical activity and sedentary time in youth: the International children’s accelerometry database (ICAD) > Discussion
What the sources say
- Not checked yetcites [34] Corder K, Brage S, Ekelund U. Accelerometers and pedometers: methodology and clinical application. Curr Opin Clin Nutr Metab Care. 2007;10:597–603. source
hedgedconditional- Asserted: passes — The authors put it forward as true.
- Checkable: passes — It can be checked against evidence.
- Load-bearing: unclear — It is unclear whether the paper’s conclusions depend on it.
- Based: passes — The paper gives a reason why it holds.
It may state two separate claims as one.
None of the sources cited for this claim have been checked yet.
In the paper
“Whilst the thresholds used have been shown to provide valid estimates of physical activity intensity for youth aged 5 years and above [36], more recently they have been shown to perform poorly for MVPA in children aged 4–6 years [37] and have not been validated in children under 4 years.”
§ Objectively measured physical activity and sedentary time in youth: the International children’s accelerometry database (ICAD) > Discussion
What the sources say
- Not checked yetcites [36] Trost SG, Loprinzi PD, Moore R, Pfeiffer KA. Comparison of accelerometer cut points for predicting activity intensity in youth. Med Sci Sports Exerc. 2011;43(7):1360–8. source
- Not checked yetcites [37] Janssen X, Cliff DP, Reilly JJ, Hinkley T, Jones RA, Batterham M, et al. Predictive validity and classification accuracy of Actigraph energy expenditure equations and cut-points in young children. PLoS ONE. 2013;8(11):e79124. 10.1371/journal.pone.0079124. source
plain- Asserted: passes — The authors put it forward as true.
- Checkable: passes — It can be checked against evidence.
- Load-bearing: passes — The paper’s conclusions depend on it.
- Based: passes — The paper gives a reason why it holds.
It may state two separate claims as one.
The paper relies on this without support.
No prior child and adolescent physical activity data pooling study had incorporated samples from such a diverse range of countries using consistent measures and methodology.
“No child and adolescent physical activity data pooling studies have incorporated samples from such a diverse range of countries using consistent measures and methodology.”
Claims other papers make about this one
Each is checked against this paper’s own text: does it say what the citing paper says it does?
The cited source says what the claim attributes to it.
In the citing paper
“Males are reportedly more active than females at all ages from youth to adolescence [18, 20, 58].”
From Barriers to voluntary participation in sport for children: a systematic review (2018) · cites this paper as [58]
The cited source says what the claim attributes to it.
In the citing paper
“Evidence shows that girls are less physically active than boys regardless of age [18, 19, 58].”
From Barriers to voluntary participation in sport for children: a systematic review (2018) · cites this paper as [58]
In the citing paper
“evidence suggests a decline in MVPA after early childhood,8, 9, 10”
From A mixed-studies systematic review and meta-analysis of school-based interventions to promote physical activity and/or reduce sedentary time in children (2020) · cites this paper as [9]
In the citing paper
“a recent review finding that 10 countries had an annual decrease of 4.2% in PA and an increase in ST after the age of 5 years.11”
From A mixed-studies systematic review and meta-analysis of school-based interventions to promote physical activity and/or reduce sedentary time in children (2020) · cites this paper as [11]
In the citing paper
“The International Children’s Accelerometry Database, though cross-sectional, suggests that objectively measured physical activity may be in decline in both sexes from around the age of school entry.13”
From Timing of the decline in physical activity in childhood and adolescence: gateshead millennium cohort study (2018) · cites this paper as [13]
In the citing paper
“A low proportion of children from China, India and the USA met the recommendation of being physically active at least 60 min per day, data in line with the 15 to 28% prevalence coming from the International Children’s Accelerometry database [36].”
From Proportion of children meeting recommendations for 24-hour movement guidelines and associations with adiposity in a 12-country study (2016) · cites this paper as [36]
Self-check
Percentages, sums and reported differences re-computed from the paper’s own numbers.
Each contradiction between two passages listed here was confirmed by an independent check.
Rated minor: it would not touch a result — a value no result rests on, a p-value that stays on the same side of the significance level, or a conflict that is clerical, resolved elsewhere in the paper, or outside its own findings.
In the paper
§ Objectively measured physical activity and sedentary time in youth: the International children’s accelerometry database (ICAD) > Results > Physical activity by sex, age and weight status
“Overweight/obesity was not associated with total physical activity in the youngest age groups (age 2–6) but was consistently associated with lower total physical activity in older age groups (Fig. 2a).”
§ Objectively measured physical activity and sedentary time in youth: the International children’s accelerometry database (ICAD) > Discussion
“differences in physical activity by weight status are seen from 6 years of age.”
Rated minor: it would not touch a result — a value no result rests on, a p-value that stays on the same side of the significance level, or a conflict that is clerical, resolved elsewhere in the paper, or outside its own findings.
In the paper
§ Objectively measured physical activity and sedentary time in youth: the International children’s accelerometry database (ICAD) > Results
“The prevalence of overweight/obesity (defined as an age and sex adjusted BMI equivalent to >30 kg/m2) was 26 % in the sample as a whole”
§ Objectively measured physical activity and sedentary time in youth: the International children’s accelerometry database (ICAD) > Results
“| Weightstatus† ‡ | Overweight | 4939 (18 %) | 6238 (18 %) | | Weightstatus† ‡ | Obese | 2048 (7 %) | 2450 (7 %) |”
Citations
Cites
Establishing a standard definition for child overweight and obesity worldwide: international survey
Cole, T. J. (2000) · BMJ · doi:10.1136/bmj.320.7244.1240 · Cited by 16,500 · cited 1×
“Body mass index (BMI) was calculated as weight (kg)/height (m)(2) and participants were categorised into normal weight, overweight and obese groups according to age and sex-specific cut points [23].”
Method‘Small Changes' to Diet and Physical Activity Behaviors for Weight Management
Hills, A. P., Byrne, N. M., Lindstrom, R. C., & Hill, J. O. (2013) · Obesity Facts · doi:10.1159/000345030 · Cited by 9,526
Physical Activity in the United States Measured by Accelerometer
TROIANO, R. P., BERRIGAN, D., DODD, K. W., MÂSSE, L. C., TILERT, T., & MCDOWELL, M. (2008) · Medicine & Science in Sports & Exercise · doi:10.1249/mss.0b013e31815a51b3 · Cited by 7,638 · cited 1×
“Nonwear time was defined as 60 min of consecutive zeros allowing for 2 min of non-zero interruptions [7].”
Global physical activity levels: surveillance progress, pitfalls, and prospects
Hallal, P. C., Andersen, L. B., Bull, F. C., Guthold, R., Haskell, W., & Ekelund, U. (2012) · The Lancet · doi:10.1016/s0140-6736(12)60646-1 · Cited by 5,711 · cited 1×
“Widely accepted public health recommendations are that young people should accumulate at least 60 min of moderate to vigorous intensity physical activity (MVPA) daily [4]; however, data suggest that the majority of youth do not meet these guidelines, with approximately 80 % of 13–15 year olds worldwide insufficiently…”
BackgroundSelf-citationJanssen, I., & LeBlanc, A. G. (2010) · International Journal of Behavioral Nutrition and Physical Activity · doi:10.1186/1479-5868-7-40 · Cited by 4,829 · cited 1×
“Background Physical activity in youth is associated with many health benefits [1, 2] and physical activity behaviours established in youth are likely to be carried through into adulthood [3].”
BackgroundEvidence Based Physical Activity for School-age Youth
Strong, W. B., Malina, R. M., Blimkie, C. J. R., Daniels, S. R., Dishman, R. K., Gutin, B., Hergenroeder, A. C., Must, A., Nixon, P. A., Pivarnik, J. M., et al. (2005) · The Journal of Pediatrics · doi:10.1016/j.jpeds.2005.01.055 · Cited by 4,222 · cited 1×
“Background Physical activity in youth is associated with many health benefits [1, 2] and physical activity behaviours established in youth are likely to be carried through into adulthood [3].”
BackgroundCalibration of two objective measures of physical activity for children
Evenson, K. R., Catellier, D. J., Gill, K., Ondrak, K. S., & McMurray, R. G. (2008) · Journal of Sports Sciences · doi:10.1080/02640410802334196 · Cited by 2,677 · cited 1×
“Standard cut-points were used to define the mean daily percentage of time spent at various intensities: sedentary (≤100 cpm), light (101–2295 cpm), and moderate to vigorous (≥2296 cpm) [22].”
MethodLetter to the Editor: Standardized use of the terms “sedentary” and “sedentary behaviours”
Networ, S. B. R. (2012) · Applied Physiology, Nutrition, and Metabolism · doi:10.1139/h2012-024 · Cited by 1,873
Currie, C. E., Zanotti, C., Morgan, A. M., Currie, D. B., de Looze, M. E., Roberts, C., Samdal, O., Smith, O. R. F., & Barnekow, V. (2012) · Cited by 1,591
Physical activity from childhood to adulthood
Telama, R., Yang, X., Viikari, J., Välimäki, I., Wanne, O., & Raitakari, O. (2005) · American Journal of Preventive Medicine · doi:10.1016/j.amepre.2004.12.003 · Cited by 1,585 · cited 1×
“Background Physical activity in youth is associated with many health benefits [1, 2] and physical activity behaviours established in youth are likely to be carried through into adulthood [3].”
Background
Research works printed but not linked: 1
- WHO. Global recommendations on physical activity for health. Geneva: World Health Organisation; 2010.
Cited by
Sorted by citations
Items 401–500 of 785
Bachner, J., Sturm, D. J., & Demetriou, Y. (2020) · International Journal of Environmental Research and Public Health · doi:10.3390/ijerph18010032 · Cited by 10
“This school type was chosen because of its higher portion of students with a lower SES compared to other types of secondary schools in Germany [32].”
BackgroundInfluentialKim, A., Lee, S., & Park, J. (2022) · PLoS ONE · doi:10.1371/journal.pone.0263923 · Cited by 9
Larouche, R., Abadi, M. R. H., Aubert, S., Bhawra, J., Brazo‐Sayavera, J., Carson, V., Colley, R. C., Nyström, C. D., Esliger, D., Harper-Brown, R., et al. (2024) · BMJ Open · doi:10.1136/bmjopen-2023-082275 · Cited by 13
Self-citationAdolescents, menstruation, and physical activity: insights from a global scoping review
Harvey, J., Western, M. J., Townsend, N. P., Francombe-Webb, J., Sebire, S. J., Malkowski, O. S., Remskar, M., Burfitt, E., & Solomon-Moore, E. (2025) · BMC Women s Health · doi:10.1186/s12905-025-03825-w · Cited by 19
“[5].”
Bachner, J., Sturm, D. J., García‐Massó, X., Molina‐García, J., & Demetriou, Y. (2020) · Frontiers in Psychology · doi:10.3389/fpsyg.2020.580563 · Cited by 9
The impact of resistance training on strength and correlates of physical activity in youth
Collins, H. M., Fawkner, S. G., Booth, J. N., & Duncan, A. (2021) · Journal of Sports Sciences · doi:10.1080/02640414.2021.1976487 · Cited by 15
“A 60-s epoch was used and nonwear time was defined as strings of consecutive zeros lasting 60 min or more (Cooper et al., 2015).”
MethodPyšná, J., Pyšný, L., Cihlář, D., Petrů, D., Müllerová, L. H., Čtvrtečka, L., Čechová, A., & Suchý, J. (2022) · International Journal of Environmental Research and Public Health · doi:10.3390/ijerph19053068 · Cited by 8
Hermassi, S., Ketelhut, S., Konukman, F., Ayari, M. A., Al-Marri, S. S., Al-Rawahi, N., Bouhafs, E. G., Nigg, C. R., & Schwesig, R. (2024) · Journal of Clinical Medicine · doi:10.3390/jcm13041057 · Cited by 9
Balthasar, M. R., Roelants, M., Brannsether‐Ellingsen, B., et al. (2024) · Acta Paediatrica · doi:10.1111/apa.17323 · Cited by 9
“28 Reduced physical activity following the closure of sports facilities may have exacerbated obesogenic behaviour more in boys than girls.”
Liu, F., Kong, B., Zhang, Z., Chen, L., Li, Y., Xiong, J., Yao, P., Li, Y., & Tang, Y. (2024) · Public Health · doi:10.1016/j.puhe.2024.08.005 · Cited by 9
Pagels, P., Wester, U., Mårtensson, F., Guban, P., Raustorp, A., Fröberg, A., Söderström, M., & Boldemann, C. (2020) · Photodermatology Photoimmunology & Photomedicine · doi:10.1111/phpp.12558 · Cited by 11
Fan, H., & Zhang, X. (2021) · Frontiers in Pediatrics · doi:10.3389/fped.2021.664828 · Cited by 9
Prochnow, T. M., Patterson, M. S., Hamilton, C. N. B., et al. (2021) · Child & Youth Services · doi:10.1080/0145935x.2021.1926228 · Cited by 9
Zago, M., Lovecchio, N., & Galli, M. (2021) · International Journal of Sports Science & Coaching · doi:10.1177/17479541211041703 · Cited by 12
Jago, R., Tibbitts, B., Porter, A., Sanderson, E., Bird, E. L., Powell, J. E., Metcalfe, C., & Sebire, S. J. (2019) · Public Health Research · doi:10.3310/phr07190 · Cited by 10
Castro-Lemus, N., Romero, C., Coll, M. V. G., et al. (2021) · International Journal of Environmental Research and Public Health · doi:10.3390/ijerph18115520 · Cited by 8
“Therefore, physical activity guidelines state that all children and young people should engage in at least an hour per day of moderate-to-vigorous-intensity physical activity (MVPA) and limit sedentary time [5]; however, considerable proportions of children do not meet these guidelines [6].”
BackgroundWright, K. E., Jackson, B., Licari, M. K., Dimmock, J. A., & Furzer, B. J. (2023) · Mental health and physical activity · doi:10.1016/j.mhpa.2023.100558 · Cited by 9
Investigating young children’s physical activity through time and place
Remmers, T., Koolwijk, P., Fassaert, I., Nolles, J., de Groot, W., Vos, S. B., de Vries, S. I., Mombarg, R., & van Kann, D. (2024) · International Journal of Health Geographics · doi:10.1186/s12942-024-00373-8 · Cited by 8
Kracht, C. L., Tate, A. D., de Brito, J. N., Trofholz, A. C., & Berge, J. M. (2025) · BMC Public Health · doi:10.1186/s12889-025-21738-z · Cited by 9
“Unfortunately, children’s physical activity begins to decline starting at seven years of age, and time spent in sedentary activities increases [4].”
Hu, Y., Zhao, L., Sui, W., & Gao, Y. F. (2025) · Frontiers in Psychology · doi:10.3389/fpsyg.2025.1577987 · Cited by 16
García, J. L., Aadland, E., Berger, N., Hansen, B. H., Benadjaoud, M. A., van Hees, V. T., Danilevicz, I. M., & Sabia, S. (2025) · Scientific Reports · doi:10.1038/s41598-025-03866-z · Cited by 8
Kidokoro, T., Tian, X., Fuku, N., Waiganjo, L. B., Rintaugu, E. G., Kigaru, M. D., & Mwangi, F. M. (2021) · American Journal of Human Biology · doi:10.1002/ajhb.23649 · Cited by 9
Sleep and physical activity: results from a long-term actigraphy study in adolescents
Fontanellaz-Castiglione, C. E. G., Timmers, T. T., Lerch, S., Hamann, C., Kaess, M., & Tarokh, L. (2022) · BMC Public Health · doi:10.1186/s12889-022-13657-0 · Cited by 12
Changes in sleep disturbance among Chinese adolescents: A population-based online survey
Liu, W., Wang, D., Fan, Y., Ye, H., Bu, L., & Fan, F. (2023) · Journal of Psychosomatic Research · doi:10.1016/j.jpsychores.2023.111515 · Cited by 8
Royo, E., Latorre-Peña, J., Denoni-Buján, M., & Hernández, S. O. (2023) · Sustainability · doi:10.3390/su152316327 · Cited by 8
Korcz, A., Cieśla, E., & Urbański, P. K. (2024) · Scientific Reports · doi:10.1038/s41598-024-55933-6 · Cited by 23
“Our research also identified additional sex-related differences in PA levels, aligning with findings from other studies 31–34 .”
ResultTelford, D. M., Meiring, R. M., & Gusso, S. (2024) · Journal of science and medicine in sport · doi:10.1016/j.jsams.2024.10.002 · Cited by 9
Physical activity and overweight/obesity among academic stressed adolescents
Li, C., Yuan, Z., Clements-Nolle, K. D., Fu, Y., Deadmond, M., & Yang, W. (2018) · Biostatistics and Epidemiology International Journal · doi:10.30881/beij.00011 · Cited by 8
“The survey consisted of 84 questions in eight categories: (1) Demographic characteristics; (2) Harm behavior; (3) Smoking behavior; (4) Drinking behavior; (5) Eating behavior and body weight; (6) Physical activity; (7) Sexual behavior and other health-related behaviors; (8) Academic stress.”
BackgroundValidity and Reliability of Chinese Physical Activity Questionnaire for Children Aged 10-17 Years.
Yang, X., Jago, R., Zhai, Y., Yang, Z. Y., Wang, Y. Y., Si, X., Wang, J., Gao, J. F., Chen, J. R., Yu, Y., et al. (2019) · PubMed · doi:10.3967/bes2019.084 · Cited by 8
“, 2002 Freedson et al.([31]), 1998 Cut-points rho P Cut-points rho P Cut-points rho P Cut-points rho P”
BackgroundResultInfluentialTaylor, S., & Owen, M. B. (2020) · Health Education Journal · doi:10.1177/0017896920959092 · Cited by 9
“Children and young people often engage in low levels of physical activity (PA) (Cooper et al., 2015), and a drop in PA engagement is evident as children cross the primary (4–11 years) to secondary (11–16 years) school transition (Lau et al., 2017).”
BackgroundLeduc, G., Gilbert, J., Ayotte, A., Moreau, N., Drapeau, V., Lemoyne, J., Monthuy‐Blanc, J., Tremblay, J., & Mathieu, M.-E. (2021) · BMC Public Health · doi:10.1186/s12889-021-10200-5 · Cited by 7
“Systematic reviews and original research support that the decline in PA levels can be first observed in childhood, even though girls tend to disengage from active pursuits at a steeper rate as they reach puberty and progress through adolescence [8, 9].”
BackgroundActive Play Network Influences on Physical Activity Among Children Living in Texas Colonias
Prochnow, T. M., Meyer, M. R. U., Patterson, M. S., Trost, S. G., Gómez, L. A., & Sharkey, J. R. (2021) · Family & Community Health · doi:10.1097/fch.0000000000000296 · Cited by 8
Sacheck, J. M., Wright, C. M., Amin, S. A., Anzman‐Frasca, S., Chomitz, V. R., Chui, K. K. H., Duquesnay, P. J., Nelson, M. E., & Economos, C. D. (2021) · American Journal of Preventive Medicine · doi:10.1016/j.amepre.2021.01.002 · Cited by 9
Joensuu, L., Rautiainen, I., Äyrämö, S., Syväoja, H. J., Kauppi, J., Kujala, U. M., & Tammelin, T. (2021) · BMJ Open Sport & Exercise Medicine · doi:10.1136/bmjsem-2021-001053 · Cited by 8
Videira-Silva, A., Hetherington-Rauth, M., Sardinha, L., & Fonseca, H. (2021) · Clinical Obesity · doi:10.1111/cob.12484 · Cited by 9
“Weight management, however, is particularly challenging in adolescence, not only because of the complex nature of weight gain, but also because of the physiological and psychological changes inherent to this period of growth and development,(2) such as decreased resting metabolic rate,(3) changes in adipocyte differen…”
BackgroundSelf-citationWerneck, A. O., Jago, R., Kriemler, S., Andersen, L. B., Wedderkopp, N., Northstone, K., Salmon, J., & van Sluijs, E. M. F. (2021) · Preventive Medicine · doi:10.1016/j.ypmed.2021.106862 · Cited by 10
Self-citationLarrínaga-Undabarrena, A., Albisua, N., Río, X., Angulo-Garay, G., González-Santamaría, X., Atxa, I. E., Aguirre, G. M. D. L., Larrinaga, M. R. D. A., Aguirre-Betolaza, A. M., Gorostegi-Anduaga, I., et al. (2022) · JMIR Research Protocols · doi:10.2196/31325 · Cited by 7
“To determine the level of PA in the school population aged between 6 and 17 years in the BAC, and considering the benefits of PA for children and adolescents [17,18], this protocol aims to determine whether this group meets the established parameters of daily PA recommended by the WHO [2].”
BackgroundFilho, A. ́., Barbosa, A. O., Mendonça, G., & Júnior, J. C. D. F. (2017) · Brazilian Journal of Kinanthropometry and Human Performance · doi:10.5007/1980-0037.2017v19n3p270 · Cited by 8
Barriers and Determinants of Active Commuting to School in Slovenia
Jurak, G., Sorić, M., Ocvirk, T., Potočnik, Ž. L., Meh, K., Đurić, S., Sember, V., & Starc, G. (2021) · Sustainability · doi:10.3390/su132413808 · Cited by 8
Videira‐Silva, A., Sardinha, L. B., & Fonseca, H. (2018) · BMJ Paediatrics Open · doi:10.1136/bmjpo-2017-000214 · Cited by 8
Self-citationIrwin, J., van Sluijs, E. M. F., Panter, J., & Jones, A. (2021) · Health & Place · doi:10.1016/j.healthplace.2021.102667 · Cited by 8
Self-citationMalek, M. E., Norman, Å., Elinder, L. S., Patterson, E., & Nyberg, G. (2022) · Children · doi:10.3390/children9020248 · Cited by 7
“is recognized that a significant reduction in the level of physical activity occurs between the age of 6–12 years [6].”
BackgroundA numerical model for fibril remodeling in articular cartilage
Kakavand, R., Rasoulian, A., Otoo, B. S., Herzog, W., & Komeili, A. (2023) · The Knee · doi:10.1016/j.knee.2022.12.009 · Cited by 7
The Nexus of Sports-Based Development and Education of Mental Health and Physical Fitness
Zhang, T., Liu, H., Lu, Y., & Wang, Q. (2023) · International Journal of Environmental Research and Public Health · doi:10.3390/ijerph20043737 · Cited by 7
“Mental disorders and other consequences of physical inactivity are profound in children, especially during adolescence [21].”
BackgroundChallenges and barriers in conducting school-based physical activity research: A narrative review
Nagrale, S., & Jiandani, M. (2024) · Journal of Family Medicine and Primary Care · doi:10.4103/jfmpc.jfmpc_364_24 · Cited by 8
Demirci, N., Karaca, A., Çağlar, E., Aksen, P., Küçükkubaş, N., Çelebi, M. M., Karabulut, E., Demirhan, G., Kirazcı, S., & Özmert, E. N. (2024) · The Turkish Journal of Pediatrics · doi:10.24953/turkjpediatr.2024.5300 · Cited by 11
“37 These studies are consistent with our study, which found higher sedentary time but lower light-intensity physical activity in adolescents than in children.”
Fröberg, A., Larsson, C. L., Berg, C., et al. (2016) · International Journal of Adolescent Medicine and Health · doi:10.1515/ijamh-2016-0061 · Cited by 7
“However, objective PA data measured with activity monitors such as accelerometers suggest that only a few percent of girls and boys, respectively, meet the PA recommendations (5).”
BackgroundResultInfluentialFactors Affecting Health-Related Behaviors in Younger School-Age Korean Children
Eo, Y., & Kim, J. S. (2019) · Journal of Pediatric Nursing · doi:10.1016/j.pedn.2019.05.019 · Cited by 7
Pirnes, K. P., Kallio, J., Kankaanpää, A., HÄKKINEN, A. H., & Tammelin, T. (2020) · Scandinavian Journal of Pain · doi:10.1515/sjpain-2020-0038 · Cited by 7
“Readings of ≥500min/day on three days (two validweekdays and oneweekend day) ormore time measured between 7:00 and 23:00 were required for a valid monitoring period [27].”
BackgroundKhawaja, I., Woodfield, L., Collins, P., Benkwitz, A., & Nevill, A. M. (2020) · Children · doi:10.3390/children7100178 · Cited by 6
“The consistency in a middle school environment could explain the consistency in PA behaviours across all three school terms, which showed that on average, the older children were more active than the younger children, which is in contrast to previous research findings [29,33,34].”
BackgroundMethodResultYang, C., Zink, J., Belcher, B. R., Kanning, M. K., & Dunton, G. F. (2021) · Annals of Behavioral Medicine · doi:10.1093/abm/kaaa124 · Cited by 6
“Our findings of generally decreasing trends of mean activity levels across childhood to mid-adolescence are consistent with the developmental literature [43, 44].”
ResultSantos, P. F., Iglesia, I., Muñiz-Pardos, B., Miguel‐Berges, M. L., Flores‐Barrantes, P., Moreno, L. A., & Rodrı́guez, G. (2021) · Children · doi:10.3390/children8050341 · Cited by 9
“PA data were collected using accelerometers, instead of questionnaires, which is also a more reliable method [22].”
MethodDownturn in Childhood Bone Mass: A Cross‐Sectional Study Over Four Decades
Rosengren, B. E., Bergman, E., Karlsson, J., et al. (2021) · JBMR Plus · doi:10.1002/jbm4.10564 · Cited by 7
“further as screen time activity through computers, tablets, and smart phones is increasing,((14)) nowadays covering as much as 40% to 60% of all sitting time for children.”
BackgroundInfluentialActive and sedentary behaviors in youth (6–14 years old): Data from the IAN-AF survey (2015–2016)
Pizarro, A. I. N., Correia, D. M., Lopes, C. M. M., Teixeira, P. J., & Mota, J. A. P. S. (2022) · Porto Biomedical Journal · doi:10.1097/j.pbj.0000000000000161 · Cited by 7
Emm-Collison, L., Salway, R., Matthews, J. A., Reid, T., & Jago, R. (2023) · Wellcome Open Research · doi:10.12688/wellcomeopenres.18262.1 · Cited by 6
A cross-sectional study of Canadian children's valuation of literacies across social contexts
Bremer, E., Jefferies, P., Cairney, J., & Kriellaars, D. J. (2023) · Frontiers in Sports and Active Living · doi:10.3389/fspor.2023.1125072 · Cited by 7
Romero-Martínez, J., Menescardi, C., García‐Massó, X., & Estevan, I. (2024) · Retos · doi:10.47197/retos.v52.100143 · Cited by 7
“%) el porcentaje de niños, niñas y adolescentes que cumplen con las recomendaciones de realizar al menos 60 minutos de AF moderada-vigorosa (AFMV) diarios (Cooper et al., 2015; Daly-Smith et al., 2020; Román-Viñas et al., 2018).”
BackgroundActive or Passive Commuter? Discrepancies in Cut-off Criteria among Adolescents
Casterad, J. Z., Corral-Abós, A., Estrada, S., Abós, Á., & Solana, A. A. (2019) · International Journal of Environmental Research and Public Health · doi:10.3390/ijerph16203796 · Cited by 7
“However, a vast body of international [4] and Spanish studies [5] showed that most adolescents do not meet international PA recommendations (i.”
BackgroundSturm, D. J., Bachner, J., Haug, S., & Demetriou, Y. (2020) · International Journal of Environmental Research and Public Health · doi:10.3390/ijerph17051554 · Cited by 8
Sprengeler, O., Hebestreit, A., Gohres, H., Bucksch, J., & Buck, C. (2020) · Frontiers in Public Health · doi:10.3389/fpubh.2020.00396 · Cited by 7
Ferrer, P., Iglesia, I., Muñiz-Pardos, B., Miguel‐Berges, M. L., Flores‐Barrantes, P., Gómez‐Bruton, A., Moreno, L. A., & Rodrı́guez, G. (2021) · Osteoporosis International · doi:10.1007/s00198-021-06256-z · Cited by 10
“PA data have been collected using accelerometers, instead of questionnaires, which is also a more reliable method [3, 20].”
MethodParents’ Inadequate Estimate of Their Children’s Objectively Physical Activity Level
Kippe, K. O., Marques, A., Martins, J., & Lagestad, P. (2022) · Children · doi:10.3390/children9030392 · Cited by 7
“2% each year from the age of 5 to 18 [11].”
BackgroundEditorial: Monitoring and Promoting Physical Activity and Physical Fitness in Children
Popovic, S. R., Sarmento, H., Demetriou, Y., & Marques, A. (2021) · Frontiers in Public Health · doi:10.3389/fpubh.2021.633457 · Cited by 6
“Additionally, sedentary behavior, which nowadays is considered not just as the opposite of physical activity but to have its independent negative influence on health, is increasing (5, 6).”
BackgroundFairclough, S. J., Christian, D. L., Saint‐Maurice, P. F., et al. (2019) · Research Square · doi:10.21203/rs.2.10400/v1 · Cited by 7
Ostermeier, E., Gilliland, J., Irwin, J. D., Seabrook, J. A., & Tucker, P. (2024) · BMC Health Services Research · doi:10.1186/s12913-024-11418-w · Cited by 6
“…behaviour recommend that children 5–17 years of age accumulate an average of 60 min of daily moderate-to-vigorous physical activity to attain physical, mental, and cognitive health benefits, including improved quality of life [2]; however, most children are not meeting the recommendations [3, 4].”
BackgroundFarsi, D. (2024) · Children · doi:10.3390/children11111282 · Cited by 9
“Research has found that healthy behaviors adopted by youths are likely to be carried into adulthood [59].”
Johansen, J.-M., Mandelid, M. B., Reinboth, M. S., Resaland, G. K., & Bratland‐Sanda, S. (2025) · Frontiers in Sports and Active Living · doi:10.3389/fspor.2024.1504704 · Cited by 6
Bernal, C. M. M., Lhuisset, L., Fabre, N., & Bois, J. E. (2020) · JMIR Research Protocols · doi:10.2196/17815 · Cited by 7
“However, data suggest that when conservative cut points are used to define MVPA, less than half of the children meet the 60-minute MVPA recommendation [6,7].”
Hossain, M. M., Akter, F., Hanif, A. A. M., et al. (2021) · Journal of Biosocial Science · doi:10.1017/s0021932021000316 · Cited by 6
Morgado, M. C., Sousa, M., Marques, C., Coelho, A. B., Costa, J. A., & Seabra, A. (2023) · Children · doi:10.3390/children10071242 · Cited by 7
“Non-wear time was defined as 60 min of consecutive zeros allowing for 2 min of non-zero interruptions [43,44].”
MethodBerggren, S., Almquist‐Tangen, G., Wolfbrandt, O., & Roswall, J. (2023) · Frontiers in Public Health · doi:10.3389/fpubh.2023.1241938 · Cited by 6
Adherence to 24‐h movement behaviour guidelines in families with multiple children
Tooth, L. R., Mielke, G. I., & Moss, K. M. (2023) · Child Care Health and Development · doi:10.1111/cch.13213 · Cited by 5
“Meeting ST and PA guidelines been found to range from 5% to 87% (Cooper et al., 2015; Gomes et al., 2017; Olds et al., 2018; Roman-Viñas et al., 2016; Telford et al., 2013).”
Backgroundvan der Wurff, I. S. M., Kirschner, M., Golsteijn, R. H. J., de Jonge, M., Berendsen, B., Singh, A. S., Savelberg, H. H. C. M., & de Groot, R. H. M. (2024) · Preventive Medicine · doi:10.1016/j.ypmed.2024.107925 · Cited by 7
Joensuu, L., Tammelin, T., Syväoja, H. J., et al. (2024) · BMJ Open Sport & Exercise Medicine · doi:10.1136/bmjsem-2023-001642 · Cited by 6
Short Sprints Accumulated at School Modulate Postprandial Metabolism in Boys
Smallcombe, J. W., Barrett, L. A., Sherar, L. B., Sedgwick, M. J., Slater, T., & Tolfrey, K. (2019) · Medicine & Science in Sports & Exercise · doi:10.1249/mss.0000000000002121 · Cited by 6
“However, compliance to the current youth physical activity guidelines is poor in the UK, with only a small percentage of children meeting the recommended 60 minutes of moderate to vigorous exercise per day (9, 10).”
BackgroundSelf-citationKracht, C. L., Pochana, S. S., & Staiano, A. E. (2023) · Journal of Physical Activity and Health · doi:10.1123/jpah.2022-0345 · Cited by 7
Resaland, G. K., Bartholomew, J. B., Andersen, L. B., Anderssen, S., & Aadland, E. K. (2023) · Scandinavian Journal of Medicine and Science in Sports · doi:10.1111/sms.14350 · Cited by 6
“The CVD risk factors included in the composite cardiometabolic score were (1) triglyceride (TG), (2) total cholesterol to high- density lipoprotein cholesterol ratio (TC:HDL ratio), (3) the homeostasis model assessment for insulin resistance (HOMA), (4) systolic blood pressure (SBP), (5) waist circumference (WC), and…”
MethodSelf-citationLaunch of the Global Observatory for Physical Education (GoPE!)
Martins, J., Onofre, M., & Hallal, P. C. (2023) · Journal of Physical Activity and Health · doi:10.1123/jpah.2023-0099 · Cited by 6
Self-citationZink, J., Liu, B., Yang, C., Herrick, K., & Berrigan, D. A. (2023) · Pediatric Obesity · doi:10.1111/ijpo.13070 · Cited by 6
“However, there are gender differences in these age-related changes in behaviour and body composition.(2,15)”
BackgroundKasanen, M., Laukkanen, A., Niemistö, D., Kotkajuuri, J., Luukkainen, N., & Sääkslahti, A. (2023) · Journal of Motor Learning and Development · doi:10.1123/jmld.2023-0004 · Cited by 6
Born to run: our future depends on it
Santos‐Lozano, A., Lucía, A., Ruilope, L. M., & Pitsiladis, Y. P. (2017) · The Lancet · doi:10.1016/s0140-6736(17)32103-7 · Cited by 6
Sevil‐Serrano, J., Sos, A. A., Granado, J. A., Ferrer, D. C., & García‐González, L. (2017) · Cultura Ciencia y Deporte · doi:10.12800/ccd.v12i36.946 · Cited by 8
“En esta misma línea, una reciente revisión sistemática llevada a cabo por Cooper et al. (2015) en 27.637 niños y adolescentes (2-18 años) de 10 países señalaron que a partir de los cinco años se producía un descenso medio del 4.2% sobre los niveles de AF.”
BackgroundInfluentialChanges in healthy behaviour knowledge of rural pupils
Lorenz, K. A., Stylianou, M., & Kulinna, P. H. (2019) · European Physical Education Review · doi:10.1177/1356336x19867732 · Cited by 6
“Given the positive health outcomes associated with increased physical activity and reduced sedentary behaviours (Cooper et al., 2015), there are significant gains to be made by helping youth acquire the requisite knowledge necessary to engage in healthy behaviours.”
BackgroundToumpakari, Z., Jago, R., Howe, L. D., Majid, H. A., Papadaki, A., Mohammadi, S., Jalaludin, M. Y., Dahlui, M., Mohamed, M. N. A., Su, T. T., et al. (2019) · International Journal of Environmental Research and Public Health · doi:10.3390/ijerph16234662 · Cited by 6
Brigden, A., Beasant, L., Gaunt, D., Hollingworth, W., Mills, N., Solomon-Moore, E., Jago, R., Metcalfe, C., Garfield, K., Wray, C., et al. (2019) · Pilot and Feasibility Studies · doi:10.1186/s40814-019-0525-3 · Cited by 7
Hodgin, K. L., von Klinggraeff, L., Dauenhauer, B. D., McMullen, J. M., Kuhn, A. P., Stoepker, P., & Carson, R. L. (2020) · Journal of Physical Activity and Health · doi:10.1123/jpah.2018-0711 · Cited by 6
Walters, K., Chard, C. A., & Anderson, D. M. (2020) · Journal of Adolescent Research · doi:10.1177/0743558420920550 · Cited by 7
“Adolescent girls are less physically active (Leech et al., 2014; Tudor-Locke et al., 2006) and more sedentary compared to adolescent boys (Cooper et al., 2015).”
BackgroundVondung, C., Demetriou, Y., Reimers, A. K., Schlund, A., & Bucksch, J. (2020) · International Journal of Environmental Research and Public Health · doi:10.3390/ijerph17145231 · Cited by 8
Beldo, S. K., Morseth, B., Christoffersen, T., Halvorsen, P. A., Hansen, B. H., Furberg, A., Ekelund, U., & Horsch, A. (2020) · BMC Public Health · doi:10.1186/s12889-020-09171-w · Cited by 6
Self-citationdos Santos, P. C., de Lima, L. R. A., da Costa, B. G. G., Martins, C. R., Minatto, G., Berria, J., Nunes, E. A., Petróski, E. L., & da Silva, K. S. (2020) · Brazilian Journal of Kinanthropometry and Human Performance · doi:10.1590/1980-0037.2020v22e72397 · Cited by 6
Malmo, O., Kippe, K. O., & Lagestad, P. (2021) · Children · doi:10.3390/children8090733 · Cited by 6
“Children’s and adolescents’ total amount of physical activity have been shown to decrease with age [15].”
BackgroundScales, J., Chavda, J., Ikeda, E., Tsocheva, I., Dove, R. E., Wood, H. E., Kalsi, H. S., Colligan, G., Griffiths, L., Day, B., et al. (2023) · Journal of Physical Activity and Health · doi:10.1123/jpah.2022-0434 · Cited by 6
Self-citationVirgara, R., Maher, C. A., Lewis, L. K., Phillips, A., Wolfenden, L., Okely, A. D., Beets, M. W., Richardson, M., & Baldock, K. L. (2019) · Cochrane Database of Systematic Reviews · doi:10.1002/14651858.cd013380 · Cited by 6
“Longitudinal results from 1997 to 2009 found that only 9% of boys and 2% of girls aged 5 to 17 years achieved the recommended 60 minutes of MVPA every day (Cooper 2015).”
BackgroundPhysical activity, physical fitness, and health
Sherar, L. B., & Cumming, S. P. (2017) · Oxford University Press eBooks · doi:10.1093/med/9780198757672.003.0016 · Cited by 6
Self-citationGender differences in the distribution of children’s physical activity: evidence from nine countriesPreprint
Kretschmer, L., Salalι, G. D., Andersen, L. B., Hallal, P. C., Northstone, K., Sardinha, L. B., Dyble, M., Bann, D., & Collaborators, I. C. A. D. (. (2023) · medRxiv · doi:10.1101/2023.04.17.23288558 · Cited by 6
Self-citationSánchez‐Delgado, A., Sánchez‐Parente, S., Martínez‐Gómez, D., et al. (2023) · Scandinavian Journal of Medicine and Science in Sports · doi:10.1111/sms.14452 · Cited by 6
“15 These reductions in PA with age has also been linked to an increased risk for MetS.”
BackgroundLi, R., Cui, D., Fan, Q., Zhao, L., Xia, Z., Zuo, T., Qiu, Y., Jiang, Q. Y., Huo, J., & Wang, Z. (2025) · BMC Public Health · doi:10.1186/s12889-025-23715-y · Cited by 5
“Among adolescents, males across all age groups exhibited less SED and higher over-all activity levels than females [46, 47].”
Play biotopes put into practice—Creating synergies between children and nature
Hedblom, M., Mårtensson, F., Sang, Å. O., Wiström, B., & Litsmark, A. (2024) · People and Nature · doi:10.1002/pan3.10708 · Cited by 9
Li, Q., Li, L., He, X., & Wang, H. (2024) · Risk Management and Healthcare Policy · doi:10.2147/rmhp.s497472 · Cited by 4
“60,61 By integrating individual and environmental factors, the study reveals that a positive school physical activity atmosphere not only directly promotes participation in MVPA but also indirectly influences MVPA through reducing perceived barriers and increasing satisfaction with PE classes.”
Hwang, J., Hillman, C. H., Lee, I.-M. M., Fernandez, A. M., & Lu, A. S. (2020) · Games for Health Journal · doi:10.1089/g4h.2020.0018 · Cited by 5
Metadata
- Authors
- Cooper, A. R., Goodman, A., Page, A. S., Sherar, L. B., Esliger, D. W., van Sluijs, E. M., Andersen, L. B., Anderssen, S., Cardon, G., Davey, R., Froberg, K., Hallal, P., Janz, K. F., Kordas, K., Kreimler, S., Pate, R. R., Puder, J. J., Reilly, J. J., Salmon, J., Sardinha, L. B., Timperio, A., & Ekelund, U.
- Affiliations
- National Institute for Health and Care Research (GB)
- London School of Hygiene & Tropical Medicine (GB)
- University of Bristol (GB)
- Loughborough University (GB)
- University of Southern Denmark (DK)
- Norwegian School of Sport Sciences (NO)
- Ghent University (BE)
- University of Canberra (AU)
- Universidade Federal de Pelotas (BR)
- University of Iowa (US)
- University of Zurich (CH)
- Centre Hospitalier Universitaire Vaudois (CH)
- University of Strathclyde (GB)
- Deakin University (AU)
- Corresponding author
- Cooper, Ashley R.
- ORCID
- Venue
- International Journal of Behavioral Nutrition and Physical Activity
- Published
- 2015-09-17
- Volume
- 12
- Issue
- 1
- Pages
- 113-113
- ISSN
- 1479-5868 (ISSN-L)
- PMC
- PMC4574095
- OpenAlex
- W2143709617
- Semantic Scholar
- ae7064ed7f3723aad9b0f8279bcd885e364dee03
- Cited by
- 828
- References
- 39
- Citations by year
- 2026: 28 · 2025: 55 · 2024: 79 · 2023: 86 · 2022: 91 · 2021: 106 · 2020: 119 · 2019: 108 · 2018: 71 · 2017: 51 · 2016: 31 · 2015: 1
- FWCI
- 37.83
- Type
- journal article
- Language
- en
- Open access
- gold
- doi.org
- Licence
- cc-by
- Locations
- International Journal of Behavioral Nutrition and Physical Activity (publishedVersion, cc-by)
- PubMed Central (publishedVersion, cc-by)
- PubMed (publishedVersion)
- Bristol Research (University of Bristol) (publishedVersion, cc-by)
- University of Southern Denmark Research Portal (University of Southern Denmark) (publishedVersion, cc-by)
- SERVAL (Université de Lausanne) (publishedVersion, other-oa)
- Strathprints: The University of Strathclyde institutional repository (University of Strathclyde) (acceptedVersion)
- LSHTM Research Online (London School of Hygiene and Tropical Medicine) (acceptedVersion)
- Ghent University Academic Bibliography (Ghent University) (submittedVersion, other-oa)
- IRIS (submittedVersion)
- University of Canberra Research Portal (submittedVersion, cc-by)
- Loughborough University Institutional Repository (Loughborough University) (submittedVersion, cc-by)
- Figshare (submittedVersion)
- Loughborough University Research Repository (Loughborough University) (submittedVersion, cc-by)
- NORA - Norwegian Open Research Archives (submittedVersion, other-oa)
- Explore Bristol Research (submittedVersion, cc-by)
- Zurich Open Repository and Archive (University of Zurich) (submittedVersion, cc-by)
- Funders
- Medical Research Council (G0701877)
- Topics
- Health Sciences › Medicine › Public Health, Environmental and Occupational Health › Physical Activity and Health
- Health Sciences › Medicine › Public Health, Environmental and Occupational Health › Obesity, Physical Activity, Diet
- Physical Sciences › Computer Science › Computer Vision and Pattern Recognition › Context-Aware Activity Recognition Systems
- Keywords
- physical activity, sedentary behavior, youth, children, adolescents, accelerometer-measured activity, sex differences, age differences, overweight and obesity, cross-national variation, light physical activity
- MeSH terms
- Adolescent, Body Weight, Child, Child, Preschool, Cross-Sectional Studies, Family, Female, Humans, Male, Motor Activity, Obesity, Time Factors, Databases, Factual, Age Distribution, Sex Distribution, Internationality, Overweight, Sedentary Behavior, Self Report, Accelerometry
About these checks
Registry, retraction, Cites and statistics results are computed, not judged, with one exception: a printed reference that no index lists is read once by a model before it counts as a citation error. Claims are extracted by a model and kept only when their quote appears verbatim in the text; each cited source is then checked, with a model’s help, for whether it says what the claim relies on. Those verdicts can be wrong — read the claim’s quote and the cited source before relying on one.
A language model drew the claims from the paper on 2026-10-08, under version 3 of the claim definition (model deepseek-v4.1-flash, prompt extract-v3).
A second model labelled each claim on 2026-10-08 (model jev-1.13-20260917, definition revision gold-guideline-v0.2).
Statistics and arithmetic are recomputed, not judged.
Confidence bands are shown only for fields calibrated on our annotated test set. None is calibrated yet, so no band is shown.
What counts as a claim ›How we measure confidence ›How we check this ›
Are you an author, or do you see a problem with this page? Request a review
