

The DOI matches its Crossref record; 78 of the 78 references it cites were found in a registry or an index.
Molecular and functional signatures in a novel Alzheimer’s disease mouse model assessed by quantitative proteomics
Open accessAbstract
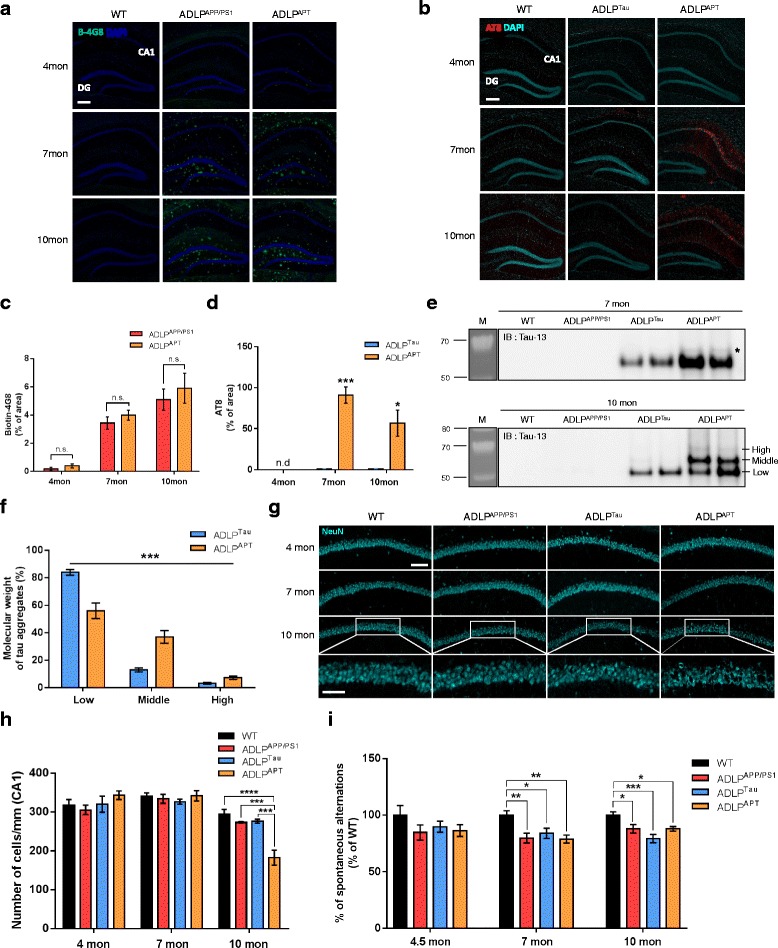
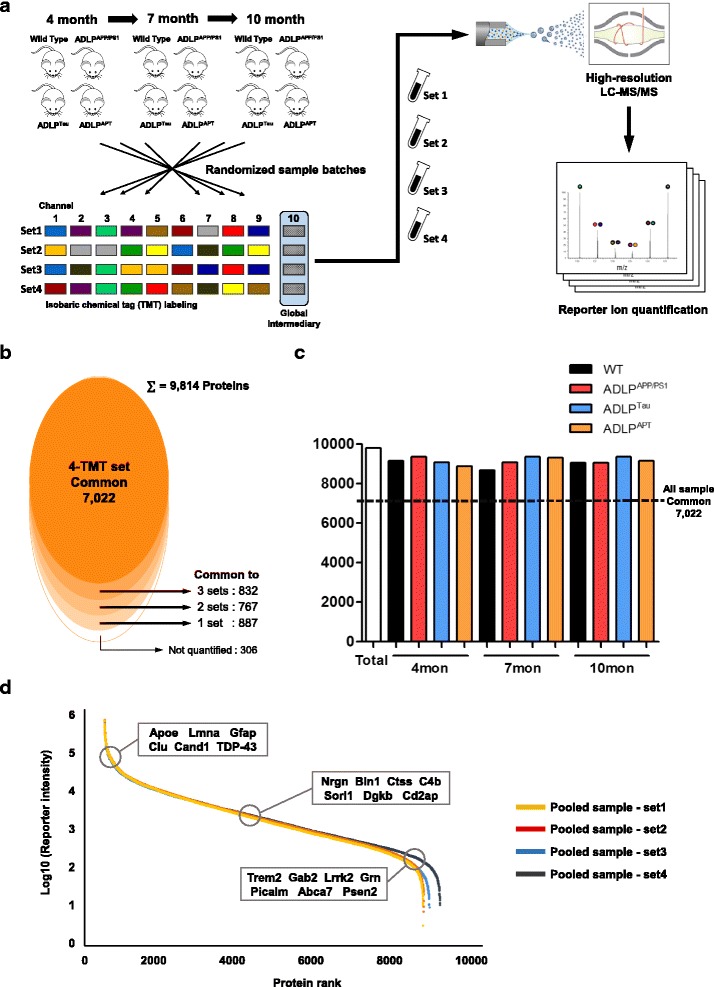
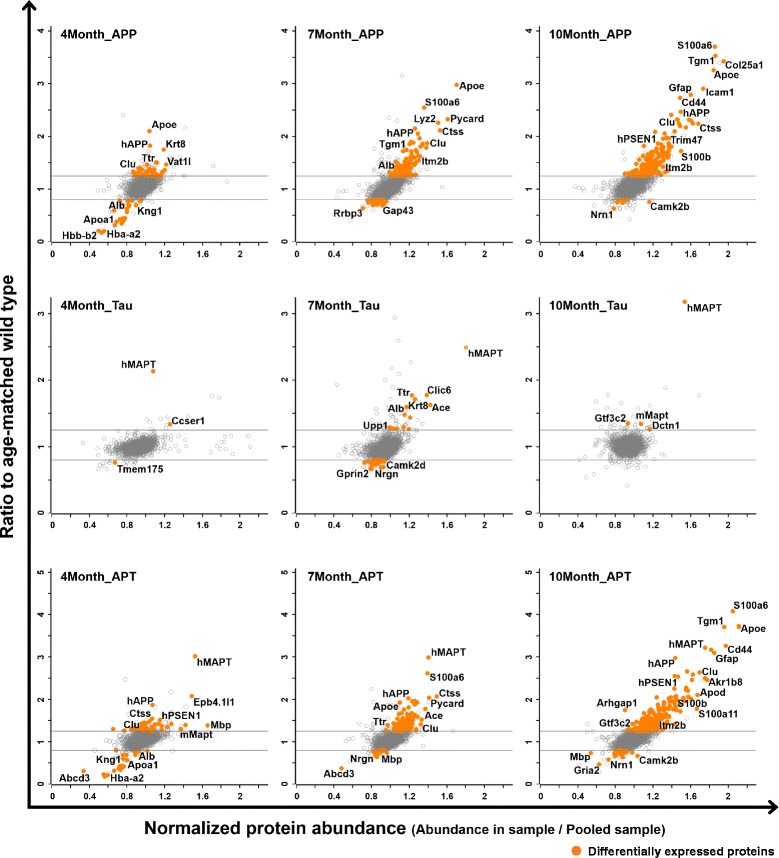
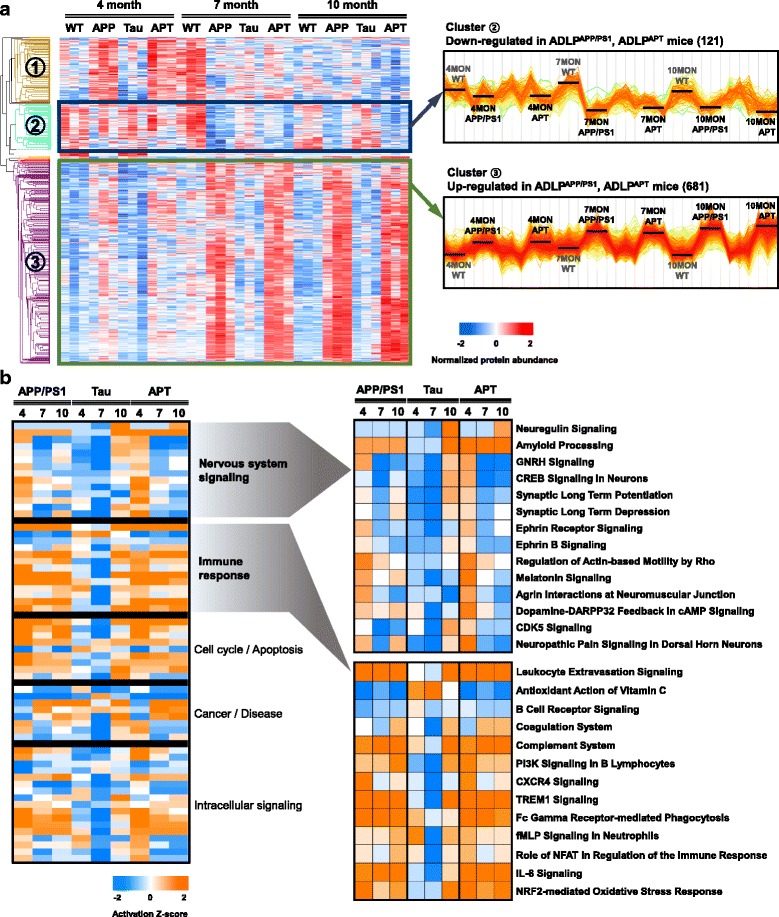
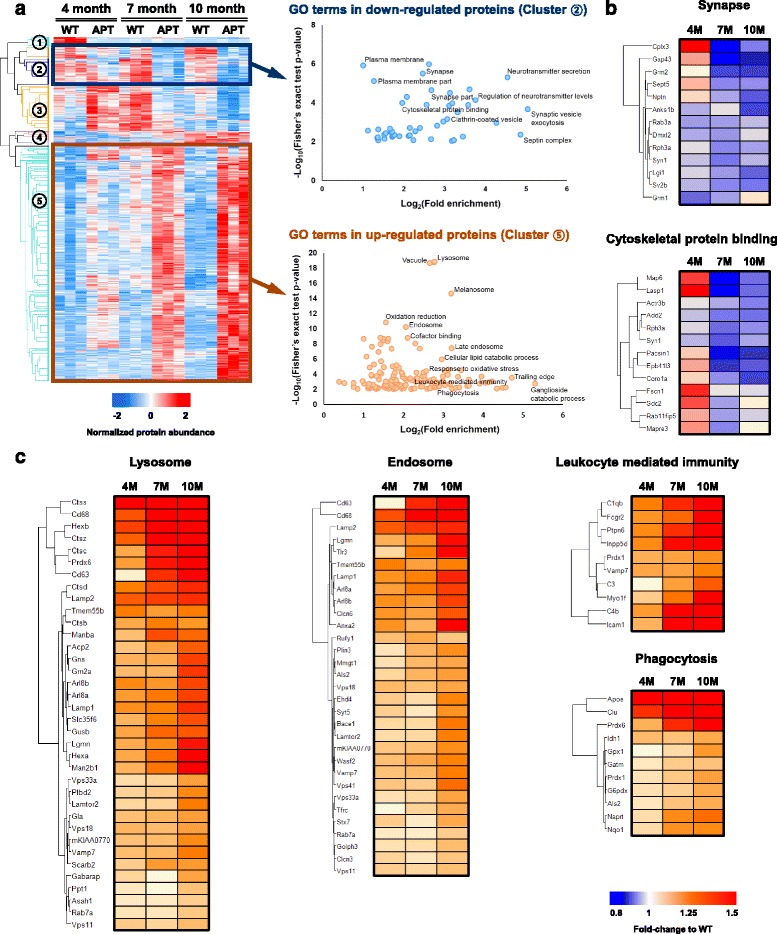
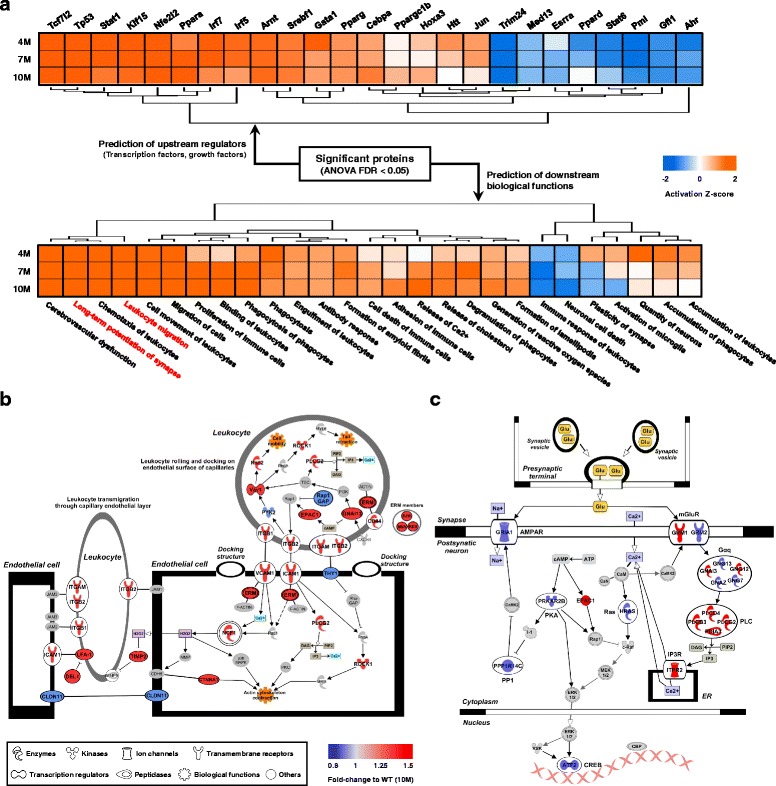
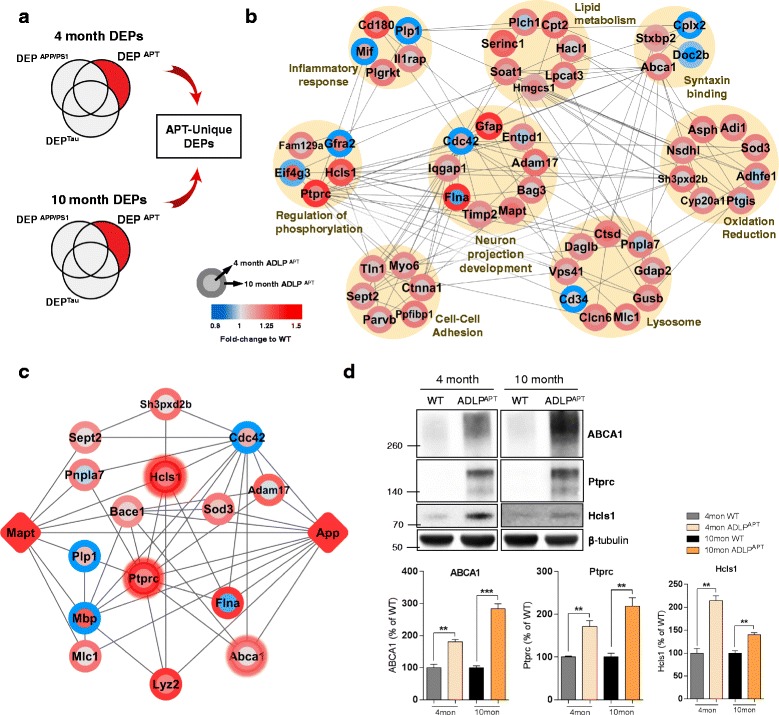
Alzheimer’s disease (AD), the most common neurodegenerative disorder, is characterized by the deposition of extracellular amyloid plaques and intracellular neurofibrillary tangles. To understand the pathological mechanisms underlying AD, developing animal models that completely encompass the main features of AD pathologies is indispensable. Although mouse models that display pathological hallmarks of AD (amyloid plaques, neurofibrillary tangles, or both) have been developed and investigated, a systematic approach for understanding the molecular characteristics of AD mouse models is lacking. To elucidate the mechanisms underlying the contribution of amyloid beta (Aβ) and tau in AD pathogenesis, we herein generated a novel animal model of AD, namely the AD-like pathology with amyloid and neurofibrillary tangles (ADLP APT ) mice. The ADLP APT mice carry three human transgenes, including amyloid precursor protein, presenilin-1, and tau, with six mutations. To characterize the molecular and functional signatures of AD in ADLP APT mice, we analyzed the hippocampal proteome and performed comparisons with individual-pathology transgenic mice (i.e., amyloid or neurofibrillary tangles) and wild-type mice using quantitative proteomics with 10-plex tandem mass tag. The ADLP APT mice exhibited accelerated neurofibrillary tangle formation in addition to amyloid plaques, neuronal loss in the CA1 area, and memory deficit at an early age. In addition, our proteomic analysis identified nearly 10,000 protein groups, which enabled the identification of hundreds of differentially expressed proteins (DEPs) in ADLP APT mice. Bioinformatics analysis of DEPs revealed that ADLP APT mice experienced age-dependent active immune responses and synaptic dysfunctions. Our study is the first to compare and describe the proteomic characteristics in amyloid and neurofibrillary tangle pathologies using isobaric label-based quantitative proteomics. Furthermore, we analyzed the hippocampal proteome of the newly developed ADLP APT model mice to investigate how both Aβ and tau pathologies regulate the hippocampal proteome. Because the ADLP APT mouse model recapitulates the main features of AD pathogenesis, the proteomic data derived from its hippocampus has significant utility as a novel resource for the research on the Aβ-tau axis and pathophysiological changes in vivo.
Overview
The claims and statistics of this paper haven’t been checked yet.
Run the check — free, no account needed. It reads the open-access text and checks the sources it cites.
Integrity signals
Registry
Cites
Statistics
Figures
Verification
Claims the paper makes
The claims and statistics of this paper haven’t been checked yet.
Run the check — free, no account needed. It reads the open-access text and checks the sources it cites.
Claims other papers make about this one
Each is checked against this paper’s own text: does it say what the citing paper says it does?
In the citing paper
“The ADLPAPT mice carry six human mutations affecting amyloid precursor protein, presenilin-1, and tau protein, and develop an AD-like pathology with amyloid and neurofibrillary tangles (167).”
From The gut-brain axis: how microbiota and host inflammasome influence brain physiology and pathology (2020) · cites this paper as [167]
In the citing paper
“The ADLPAPT mice carry six human mutations affecting amyloid precursor protein, presenilin-1, and tau protein, and develop an AD-like pathology with amyloid and neurofibrillary tangles (167).”
From The gut-brain axis: how microbiota and host inflammasome influence brain physiology and pathology (2020) · cites this paper as [167]
Self-check
Percentages, sums and reported differences re-computed from the paper’s own numbers.
The self-check needs the paper’s full text.
Citations
Cites
Controlling the False Discovery Rate: A Practical and Powerful Approach to Multiple Testing
Benjamini, Y., & Hochberg, Y. (1995) · Journal of the Royal Statistical Society Series B: Statistical Methodology · doi:10.1111/j.2517-6161.1995.tb02031.x · Cited by 109,482
Cytoscape: A software Environment for integrated models of biomolecular interaction networks
Shannon, P., Markiel, A., Ozier, O., Baliga, N. S., Wang, J. T., Ramage, D., Amin, N., Schwikowski, B., & Ideker, T. (2003) · Genome Research · doi:10.1101/gr.1239303 · Cited by 51,888
Systematic and integrative analysis of large gene lists using DAVID bioinformatics resources
Huang, D. W., Sherman, B. T., & Lempicki, R. A. (2009) · Nature Protocols · doi:10.1038/nprot.2008.211 · Cited by 35,890
The Amyloid Hypothesis of Alzheimer’s Disease: Progress and Problems on the Road to Therapeutics
Hardy, J., & Selkoe, D. J. (2002) · Science · doi:10.1126/science.1072994 · Cited by 13,864
STRING v10: protein–protein interaction networks, integrated over the tree of life
Szklarczyk, D., Franceschini, A., Wyder, S., Forslund, K., Heller, D., Huerta-Cepas, J., Simonovic, M., Roth, A., Santos, A., Tsafou, K. P., et al. (2015) · Nucleic Acids Research · doi:10.1093/nar/gku1003 · Cited by 10,436
Amyloid oligomers exacerbate tau pathology in a mouse model of tauopathy
Selenica, M.-L. B., Brownlow, M., Jimenez, J. P., Lee, D. C., Pena, G., Dickey, C. A., Gordon, M. N., & Morgan, D. (2013) · Neurodegenerative Diseases · doi:10.1159/000337230 · Cited by 10,359
The Perseus computational platform for comprehensive analysis of (prote)omics data
Tyanova, S., Temu, T., Sinitcyn, P., Carlson, A., Hein, M. Y., Geiger, T., Mann, M., & Cox, J. (2016) · Nature Methods · doi:10.1038/nmeth.3901 · Cited by 8,803
Universal sample preparation method for proteome analysis
Wiśniewski, J. R., Zougman, A., Nagaraj, N., & Mann, M. (2009) · Nature Methods · doi:10.1038/nmeth.1322 · Cited by 8,352
Causal analysis approaches in Ingenuity Pathway Analysis
Krämer, A., Green, J., Pollard, J., & Tugendreich, S. (2014) · Bioinformatics · doi:10.1093/bioinformatics/btt703 · Cited by 5,724
Triple-Transgenic Model of Alzheimer’s Disease with Plaques and Tangles
Oddo, S., Caccamo, A., Shepherd, J. D., Murphy, M. P., Golde, T. E., Kayed, R., Metherate, R., Mattson, M. P., Akbari, Y., & LaFerla, F. M. (2003) · Neuron · doi:10.1016/s0896-6273(03)00434-3 · Cited by 4,126
Research works printed but not linked: 1
- Han D, Moon S, Kim Y, Kim J, Jin J, Kim Y. In-depth proteomic analysis of mouse microglia using a combination of FASP and StageTip-based, high pH, reversed-phase fractionation. Proteomics. 2013;13:2984–8.
Cited by
Sorted by citations
The gut-brain axis: how microbiota and host inflammasome influence brain physiology and pathology
Rutsch, A., Kantsjö, J. B., & Ronchi, F. (2020) · Frontiers in Immunology · doi:10.3389/fimmu.2020.604179 · Cited by 821
Kim, M.-S., Kim, Y., Choi, H., Kim, W., Park, S., Lee, D., Kim, D. K., Kim, H. J., Choi, H., Hyun, D.-W., et al. (2020) · Gut · doi:10.1136/gutjnl-2018-317431 · Cited by 614
Fang, J., Zhang, P., Zhou, Y., Chiang, C.-W., Tan, J., Hou, Y., Stauffer, S., Li, L., Pieper, A. A., Cummings, J., et al. (2021) · Nature Aging · doi:10.1038/s43587-021-00138-z · Cited by 206
Fang, J., Zhang, P., Wang, Q., Chiang, C.-W., Zhou, Y., Hou, Y., Xu, J., Chen, R., Zhang, B., Lewis, S. J., et al. (2022) · Alzheimer's Research & Therapy · doi:10.1186/s13195-021-00951-z · Cited by 140
Transgenic Mouse Models of Alzheimer’s Disease: An Integrative Analysis
Sanchez-Varo, R. M., Mejias‐Ortega, M., Fernandez-Valenzuela, J. J., Nuñez‐Diaz, C., Cáceres-Palomo, L., Vegas‐Gomez, L., Sánchez‐Mejías, E., Trujillo‐Estrada, L., García‐León, J. A., Moreno‐González, I., et al. (2022) · International Journal of Molecular Sciences · doi:10.3390/ijms23105404 · Cited by 136
Acetylation changes tau interactome to degrade tau in Alzheimer’s disease animal and organoid models
Choi, H., Kim, H. J., Yang, J., Chae, S., Lee, W., Chung, S., Kim, J., Choi, H., Song, H., Lee, C. K., et al. (2019) · Aging Cell · doi:10.1111/acel.13081 · Cited by 124
A Systematic Review of the Pharmacology, Toxicology and Pharmacokinetics of Matrine
You, L., Yang, C., Du, Y., Wang, W., Sun, M., Liu, J., Ma, B., Pang, L., Zeng, Y., Zhang, Z., et al. (2020) · Frontiers in Pharmacology · doi:10.3389/fphar.2020.01067 · Cited by 119
Xu, J., Mao, C., Hou, Y., Luo, Y., Binder, J. L., Zhou, Y., Bekris, L. M., Shin, J., Hu, M., Wang, F., et al. (2022) · Cell Reports · doi:10.1016/j.celrep.2022.111717 · Cited by 115
Harnessing endophenotypes and network medicine for Alzheimer's drug repurposing
Fang, J., Pieper, A. A., Nussinov, R., Lee, G., Bekris, L. M., Leverenz, J. B., Cummings, J. L., & Cheng, F. (2020) · Medicinal Research Reviews · doi:10.1002/med.21709 · Cited by 96
The Microbiota-Gut-Brain Axis in Health and Disease and Its Implications for Translational Research
Schächtle, M., & Rosshart, S. P. (2021) · Frontiers in Cellular Neuroscience · doi:10.3389/fncel.2021.698172 · Cited by 99
Jung, E. S., Suh, K., Han, J., Kim, H., Kang, H., Choi, W., & Mook‐Jung, I. (2022) · Aging Cell · doi:10.1111/acel.13623 · Cited by 97
Proteomics Approaches for Biomarker and Drug Target Discovery in ALS and FTD
Hedl, T. J., San Gil, R., Cheng, F., Rayner, S. L., Davidson, J. M., De Luca, A., Villalva, M. D., Ecroyd, H., Walker, A. K., & Lee, A. (2019) · Frontiers in Neuroscience · doi:10.3389/fnins.2019.00548 · Cited by 87
Friend, Foe or Both? Immune Activity in Alzheimer’s Disease
Frost, G. R., Jonas, L. A., & Li, Y. (2019) · Frontiers in Aging Neuroscience · doi:10.3389/fnagi.2019.00337 · Cited by 88
Kim, D. K., Han, D., Park, J., Choi, H., Park, J., Cha, M.-Y., Woo, J. J., Byun, M. S., Lee, D. Y., Kim, Y., et al. (2019) · Experimental & Molecular Medicine · doi:10.1038/s12276-019-0326-z · Cited by 87
Zheng, Q., Li, G., Wang, S., Zhou, Y., Liu, K., Gao, Y., Zhou, Y., Zheng, L., Zhu, L., Deng, Q., et al. (2021) · Science Advances · doi:10.1126/sciadv.abe1340 · Cited by 85
Neuropathological Mechanisms Associated with Pesticides in Alzheimer’s Disease
Tang, B. L. (2020) · Toxics · doi:10.3390/toxics8020021 · Cited by 84
Rayaprolu, S., Gao, T., Xiao, H., Ramesha, S., Weinstock, L. D., Shah, J., Duong, D. M., Dammer, E. B., Webster, J. A., Lah, J. J., et al. (2019) · doi:10.1101/802694 · Cited by 71
Mendonça, C. F., Kuras, M., Nogueira, F. C. S., Plá, I., Hortobágyi, T., Csiba, L., Palkovits, M., Renner, É., Döme, P., Marko‐Varga, G., et al. (2019) · Neurobiology of Disease · doi:10.1016/j.nbd.2019.104509 · Cited by 69
Lei, W., Cheng, Y., Liu, X., Gao, J., Zhu, Z., Ding, W., Xu, X., Li, Y., Ling, Z., Jiang, R., et al. (2025) · Frontiers in Immunology · doi:10.3389/fimmu.2025.1582119 · Cited by 68
Targeting gut microbiota to alleviate neuroinflammation in Alzheimer’s disease
Nguyen, V. T. T., & Endres, K. (2022) · Advanced Drug Delivery Reviews · doi:10.1016/j.addr.2022.114418 · Cited by 52
Song, H., Chen, M., Chen, C., Cui, J., Johnson, C. E., Cheng, J. J., Wang, X., Swerdlow, R. H., DePalma, R. G., Xia, W., et al. (2018) · Journal of Neurotrauma · doi:10.1089/neu.2018.6114 · Cited by 47
Gupta, R., Min, C. W., Kim, Y., & Kim, S. T. (2019) · International Journal of Molecular Sciences · doi:10.3390/ijms20174135 · Cited by 38
Castro-Ochoa, K. F., Guerrero-Fonseca, I. M., & Schnoor, M. (2018) · Journal of Leukocyte Biology · doi:10.1002/jlb.mr0618-212r · Cited by 35
Concepts and strategies of soybean seed proteomics using the shotgun proteomics approach
Min, C. W., Gupta, R., Agrawal, G. K., Rakwal, R., & Kim, S. T. (2019) · Expert Review of Proteomics · doi:10.1080/14789450.2019.1654860 · Cited by 31
Xue-ju, Z., Liu, W., Cao, Y. W., & Tan, W. (2020) · Journal of Proteome Research · doi:10.1021/acs.jproteome.0c00255 · Cited by 33
Min, C. W., Hyeon, H., Gupta, R., Park, J., Cheon, Y. E., Lee, G., Jang, J. W., Ryu, H. W., Lee, B. W., Park, S. U., et al. (2020) · Journal of Agricultural and Food Chemistry · doi:10.1021/acs.jafc.0c00986 · Cited by 31
Shin, D., Park, J., Han, D., Moon, J. H., Ryu, H. S., & Kim, Y. (2020) · Clinical Proteomics · doi:10.1186/s12014-020-09280-z · Cited by 25
Min, C. W., Park, J., Bae, J., Agrawal, G. K., Rakwal, R., Kim, Y., Yang, P., Kim, S. T., & Gupta, R. (2020) · Cells · doi:10.3390/cells9061517 · Cited by 25
Gupta, R., Min, C. W., Kim, S. W., Yoo, J. S., Moon, A.-R., Shin, A.-Y., Kwon, S., & Kim, S. T. (2020) · Plants · doi:10.3390/plants9030290 · Cited by 24
Qin, T., Prins, S., Groeneveld, G. J., van Westen, G. J. P., de Vries, H. E., Wong, Y. C., Bischoff, L. J. M., & de Lange, E. C. M. (2020) · International Journal of Molecular Sciences · doi:10.3390/ijms21093158 · Cited by 24
Gut Microbiota as a Hidden Player in the Pathogenesis of Alzheimer’s Disease
Choi, H., Lee, D., & Mook‐Jung, I. (2022) · Journal of Alzheimer s Disease · doi:10.3233/jad-215235 · Cited by 24
Pauls, E., Bayod, S., Mateo, L., Alcalde, V., Juan-Blanco, T., Sánchez‐Soto, M., Saido, T. C., Saito, T., Berenguer, A., Attolini, C. S., et al. (2021) · Genome Medicine · doi:10.1186/s13073-021-00983-y · Cited by 23
Oh, H., Min, U.-G., Jang, H.-J., Kim, N., Lim, J., Chalita, M., & Chun, J. (2022) · The Journal of Microbiology · doi:10.1007/s12275-022-1526-0 · Cited by 22
Min, C. W., Jang, J. W., Lee, G., Gupta, R., Yoon, J., Park, H. J., Cho, H. S., Park, S. R., Kwon, S., Cho, L., et al. (2022) · Journal of Proteomics · doi:10.1016/j.jprot.2022.104687 · Cited by 20
Brain hypothyroidism silences the immune response of microglia in Alzheimer’s disease animal model
Kim, D. K., Choi, H., Lee, W., Choi, H., Hong, S. B., Jeong, J., Han, J., Han, J. W., Ryu, H., Kim, J., et al. (2024) · Science Advances · doi:10.1126/sciadv.adi1863 · Cited by 19
MacDonald, M. L., Favo, D., Garver, M. E., Sun, Z., Arion, D., Ding, Y., Yates, N. A., Sweet, R. A., & Lewis, D. A. (2018) · Neuropsychopharmacology · doi:10.1038/s41386-018-0260-0 · Cited by 20
Plexin-A4 mediates amyloid-β–induced tau pathology in Alzheimer’s disease animal model
Chung, S., Yang, J., Kim, H. J., Hwang, E. M., Lee, W., Suh, K. Y., Choi, H., & Mook‐Jung, I. (2021) · Progress in Neurobiology · doi:10.1016/j.pneurobio.2021.102075 · Cited by 17
Wu, D., Yu, N., Gao, Y., Xiong, R., Liu, L., Lei, H., Jin, S., Liu, J., Liu, Y., Xie, J., et al. (2023) · Molecular Neurodegeneration · doi:10.1186/s13024-023-00614-7 · Cited by 17
The endocannabinoid system: a bridge between alzheimer’s disease and gut microbiota
Bisogno, T., Lauritano, A., & Piscitelli, F. (2021) · Life · doi:10.3390/life11090934 · Cited by 16
Zhao, T., Zeng, J., Zhang, R., Fan, W., Guan, Q., Wang, H., Pu, L., Jiang, Y., Yang, H., Wang, X., et al. (2024) · Journal of Proteome Research · doi:10.1021/acs.jproteome.3c00885 · Cited by 15
Proteomic profiling of postmortem prefrontal cortex tissue of suicide completers
Kim, M. J., Do, M., Han, D., Son, M., Shin, D., Yeo, I., Yun, Y. H., Yoo, S. H., Choi, H. J., Shin, D., et al. (2022) · Translational Psychiatry · doi:10.1038/s41398-022-01896-z · Cited by 15
Brain-derived neurotrophic factor – a key player in the gastrointestinal system
Singh, A. (2023) · Gastroenterology Review · doi:10.5114/pg.2023.132957 · Cited by 15
Wang, G., Shen, X., Song, X., Wang, N., Wo, X., & Gao, Y. (2023) · NeuroToxicology · doi:10.1016/j.neuro.2022.12.011 · Cited by 14
HIV-1 and Amyloid Beta Remodel Proteome of Brain Endothelial Extracellular Vesicles
Andras, I. E., Sewell, B., & Toborek, M. J. (2020) · International Journal of Molecular Sciences · doi:10.3390/ijms21082741 · Cited by 14
Applications of Omics Technologies for Three-Dimensional In Vitro Disease Models
Pieters, V. M., Co, I. L., Wu, N. C., & McGuigan, A. P. (2021) · Tissue Engineering Part C Methods · doi:10.1089/ten.tec.2020.0300 · Cited by 14
FGFR3 drives Aβ-induced tau uptake
Kim, D. K., Suh, K. Y., Park, J., Lee, S., Han, J., Chang, S., Kim, Y., & Mook‐Jung, I. (2024) · Experimental & Molecular Medicine · doi:10.1038/s12276-024-01274-3 · Cited by 14
Jeong, J., Kim, D. K., Chung, S., Han, J. W., Han, J., & Mook‐Jung, I. (2024) · Aging Cell · doi:10.1111/acel.14420 · Cited by 14
Cañuelo, A. (2025) · Food & Function · doi:10.1039/d5fo03331d · Cited by 15
Amyloid-β-activated microglia can induce compound proteinopathies
Lee, S. H., Bae, E.-J., Pérez-Acuña, D., Jung, M. K., Han, J. W., Mook‐Jung, I., & Lee, S. (2024) · Brain · doi:10.1093/brain/awae221 · Cited by 11
Choi, H., Hong, S. B., Liu, H.-W., Song, H., Jeong, J., Ahn, K., Kim, S., Song, J., Han, J. W., Lee, D., et al. (2025) · Gut · doi:10.1136/gutjnl-2024-334571 · Cited by 11
The regulatory mechanisms and treatment of HDAC6 in immune dysregulation diseases
Liang, Y., Wang, Y., Xing, J., Li, J., & Zhang, K. (2025) · Frontiers in Immunology · doi:10.3389/fimmu.2025.1653588 · Cited by 11
Micropeptides Encoded by Noncoding RNAs: Biological Functions and Roles in Diseases
Kong, J., Su, X., Zhou, C., Lin, W., Lin, A., & Tang, J. (2025) · Research · doi:10.34133/research.0967 · Cited by 12
Zhuang, H., Cao, X., Tang, X., Zou, Y., Yang, H., Liang, Z., Yan, X., Chen, X., Feng, X., & Shen, L. (2024) · Amino Acids · doi:10.1007/s00726-023-03375-1 · Cited by 10
Hippocampal complement C3 might contribute to cognitive impairment induced by anesthesia and surgery
Ji, M., Qiu, L.-L., Mao, M., Zhang, L., & Yang, J. (2020) · Neuroreport · doi:10.1097/wnr.0000000000001422 · Cited by 10
Nguyen, T. V., Gupta, R., Annas, D., Yoon, J., Kim, Y., Lee, G., Jang, J. W., Park, K. H., Rakwal, R., Jung, K., et al. (2021) · Frontiers in Plant Science · doi:10.3389/fpls.2021.723369 · Cited by 9
Xia, P., Chen, J., Bai, X., Li, M., Wang, L., & Lu, Z. (2022) · BMC Neurology · doi:10.1186/s12883-022-02724-z · Cited by 8
Anschuetz, A., Schwab, K., Harrington, C. R., Wischik, C. M., & Riedel, G. (2025) · Journal of Alzheimer s Disease · doi:10.1177/13872877251362212 · Cited by 7
Kim, Y. G., Woo, J. J., Park, J., Kim, S.-Y., Lee, Y., Kim, Y., & Kim, S. J. (2020) · Journal of Proteome Research · doi:10.1021/acs.jproteome.9b00826 · Cited by 7
Luo, R., Kang, Y., Ma, H., Zhang, Z., Hölscher, C., Li, H., & Zhang, Z. (2025) · International Immunopharmacology · doi:10.1016/j.intimp.2025.114612 · Cited by 7
Radford‐Smith, D. E., Oke, K., Costa, C. F. F. A., & Anthony, D. C. (2025) · Brain Behavior & Immunity - Health · doi:10.1016/j.bbih.2025.101013 · Cited by 8
Park, J., Lee, S. H., Shin, D., Kim, Y., Kim, Y. S., Seong, M. Y., Lee, J. J., Seo, H. G., Cho, W., Ro, Y. S., et al. (2023) · Journal of Proteome Research · doi:10.1021/acs.jproteome.3c00544 · Cited by 6
Min, C. W., Gupta, R., Trưởng, N. V., Bae, J., Ko, J. M., Lee, B. W., & Kim, S. T. (2020) · Journal of Plant Biotechnology · doi:10.5010/jpb.2020.47.3.209 · Cited by 6
Shibato, J., Takenoya, F., Yamashita, M., Gupta, R., Min, C. W., Kim, S. T., Kimura, A., Takasaki, I., Hori, M., Shioda, S., et al. (2023) · International Journal of Molecular Sciences · doi:10.3390/ijms24044169 · Cited by 6
Lu, H., Ma, G., Ding, C., Wang, P., Ruan, Q., Zeng, Y., Ma, L., Lu, M., Li, Y., & Sun, W. (2025) · Cellular and Molecular Life Sciences · doi:10.1007/s00018-025-05861-z · Cited by 5
Dysregulated Protein Phosphorylation in a Mouse Model of FTLD-Tau
Ferrer, I., Andrés‐Benito, P., Ausín, K., Cartas‐Cejudo, P., Lachén‐Montes, M., del Rı́o, J. A., Fernández‐Irigoyen, J., & Santamaría, E. (2022) · Journal of Neuropathology & Experimental Neurology · doi:10.1093/jnen/nlac062 · Cited by 5
Shibato, J., Takenoya, F., Kimura, A., Min, C. W., Yamashita, M., Gupta, R., Kim, S. T., Rakwal, R., & Shioda, S. (2023) · Molecules · doi:10.3390/molecules28041565 · Cited by 4
Ferrer, I., Andrés‐Benito, P., Ausín, K., Cartas‐Cejudo, P., Lachén‐Montes, M., del Rı́o, J. A., Fernández‐Irigoyen, J., & Santamaría, E. (2022) · International Journal of Molecular Sciences · doi:10.3390/ijms23126427 · Cited by 4
Xu, J., Hou, Y., Zhou, Y., Hu, M., & Cheng, F. (2021) · bioRxiv (Cold Spring Harbor Laboratory) · doi:10.1101/2021.10.20.465087 · Cited by 4
Choi, H., Hong, S. B., Kim, Y., Joung, H., Choi, Y., Cha, J., Park, J. Y., Lee, Y.-S., Choi, H., Han, J. W., et al. (2026) · Journal of Neuroinflammation · doi:10.1186/s12974-026-03796-1 · Cited by 3
Subcellular proteomics insights into Alzheimer's disease development
Liang, Z., Zhuang, H., Cao, X., Ma, G., & Shen, L. (2023) · PROTEOMICS - CLINICAL APPLICATIONS · doi:10.1002/prca.202200112 · Cited by 3
Targeting RAGE with Nanobodies for Molecular Imaging of Cancers and Alzheimer's Disease
Liang, G., Wang, F., Xiong, W., Shi, G., Yuan, J., Li, Y., Zhang, H., Xing, Y., Jin, S., Yang, K., et al. (2025) · Advanced Biology · doi:10.1002/adbi.202400617 · Cited by 3
Proteomic Analysis of Rat Hippocampus for Studies of Cognition and Memory Loss with Aging
Guest, P. C., Rahmoune, H., & Martins‐de‐Souza, D. (2020) · Methods in molecular biology · doi:10.1007/978-1-0716-0471-7_30 · Cited by 3
Bartolo, N. D., Mortimer, N., Manter, M. A., Sanchez, N., Riley, M. M., O’Malley, T. T., & Hooker, J. M. (2022) · ACS Chemical Neuroscience · doi:10.1021/acschemneuro.2c00607 · Cited by 3
Postpartum Brain Reveals Repopulating Process and Long‐Lasting Proteomic Changes of Microglia
Rim, C., You, M., Shin, D., Kim, H., Sung, S., Kim, Y., Park, J., & Kwon, M. (2025) · Glia · doi:10.1002/glia.70088 · Cited by 3
Park, S. E., Cha, Y. J., Kim, Y., Kim, H. K., Kwon, C., Oh, Y. R., Kim, G., Kim, K. G.-H., Lee, H., Kang, Y. P., et al. (2026) · Neurotherapeutics · doi:10.1016/j.neurot.2026.e00851 · Cited by 3
Dai, Z., Pang, X., Chen, N., Fan, X., Liu, W., Liu, J., Chen, Z., Fang, S., Cai, C., & Fang, J. (2024) · Journal of Chemical Information and Modeling · doi:10.1021/acs.jcim.4c01344 · Cited by 2
Dysregulated protein phosphorylation in tauopathyPreprint
Ferrer, I., Andrés‐Benito, P., Ausín, K., Cartas‐Cejudo, P., Lachén‐Montes, M., del Rı́o, J. A., Fernández‐Irigoyen, J., & Santamaría, E. (2022) · Research Square · doi:10.21203/rs.3.rs-1442779/v1 · Cited by 2
Phosphorylated Tau in the Taste Buds of Alzheimer’s Disease Mouse Models
Kim, H. J., Kim, B. H., Kim, D. K., Kim, H., Choi, S.-H., Kim, D.-H., Choi, M., Mook‐Jung, I., Jeong, Y. T., & Kwon, O. (2024) · Experimental Neurobiology · doi:10.5607/en24004 · Cited by 1
A gut-brain connection: probiotics L9 and A6 offer new insights into Alzheimer’s disease prevention
Sun, Z., Fang, B., Gao, H., Sun, Y., Liu, Y., Guo, H., Zhao, L., Ren, F., & Zhang, M. (2024) · Food Science and Human Wellness · doi:10.26599/fshw.2024.9250340 · Cited by 1
Sex Differences in Alzheimer’s Disease Pathogenesis
Jung, E. S., & Mook‐Jung, I. (2024) · Springer eBooks · doi:10.1007/978-981-97-0130-8_24 · Cited by 1
Xia, P., Chen, J., Bai, X., Li, M., Wang, L., & Lu, Z. (2021) · Research Square · doi:10.21203/rs.3.rs-997410/v1 · Cited by 1
Immunopharmacology of Alzheimer’s disease
Nissar, K., Firdous, P., Ali, S., & Hussain, A. (2021) · Elsevier eBooks · doi:10.1016/b978-0-323-90053-9.00014-2
Protective mechanism of gold nanoparticles on human neural stem cells injured by β-amyloid proteinPreprint
Wang, G., Shen, X., Song, X., Wang, N., Wo, X., & Gao, Y. (2022) · Research Square · doi:10.21203/rs.3.rs-1453537/v1
Xia, P., Chen, J., Bai, X., Li, M., Wang, L., & Lu, Z. (2021) · Research Square · doi:10.21203/rs.3.rs-997410/v2
Proteomic-Based Studies on Memory Formation in Normal and Neurodegenerative Disease-Affected Brains
Beraldo, I. J. S., Rodrigues, M. P., Polanczyk, R. S., Verano‐Braga, T., & Lopes‐Aguiar, C. (2024) · Advances in experimental medicine and biology · doi:10.1007/978-3-031-50624-6_7
Xia, P., Chen, J. W., Bai, X., Li, M., Wang, L., & Lu, Z. (2022) · Figshare · doi:10.6084/m9.figshare.19933005
Xia, P., Chen, J. W., Bai, X., Li, M., Wang, L., & Lu, Z. (2022) · Figshare · doi:10.6084/m9.figshare.19932978
Xia, P., Chen, J. W., Bai, X., Li, M., Wang, L., & Lu, Z. (2022) · Figshare · doi:10.6084/m9.figshare.19933002
Xia, P., Chen, J. W., Bai, X., Li, M., Wang, L., & Lu, Z. (2022) · Figshare · doi:10.6084/m9.figshare.19932999
Xia, P., Chen, J. W., Bai, X., Li, M., Wang, L., & Lu, Z. (2022) · Figshare · doi:10.6084/m9.figshare.19932993
Xia, P., Chen, J. W., Bai, X., Li, M., Wang, L., & Lu, Z. (2022) · Figshare · doi:10.6084/m9.figshare.19932996
Wu, D., Yu, N., Gao, Y., Xiong, R., Liu, L., Lei, H., Jin, S., Liu, J., Liu, Y., Xie, J., et al. (2023) · Figshare · doi:10.6084/m9.figshare.22637926
Xia, P., Chen, J., Bai, X., Li, M., Wang, L., & Lu, Z. (2022) · Figshare · doi:10.6084/m9.figshare.19932990
Pauls, E., Bayod, S., Mateo, L., Alcalde, V., Juan-Blanco, T., Sánchez‐Soto, M., Saido, T. C., Saito, T., Berrenguer-Llergo, A., Attolini, C. S., et al. (2021) · Figshare · doi:10.6084/m9.figshare.16880438
Wu, D., Yu, N., Gao, Y., Xiong, R., Liu, L., Lei, H., Jin, S., Liu, J., Liu, Y., Xie, J., et al. (2023) · Figshare · doi:10.6084/m9.figshare.22637923
Xia, P., Chen, J., Bai, X., Li, M., Wang, L., & Lu, Z. (2022) · Figshare · doi:10.6084/m9.figshare.19932984
Wu, D., Yu, N., Gao, Y., Xiong, R., Liu, L., Lei, H., Jin, S., Liu, J., Liu, Y., Xie, J., et al. (2023) · Figshare · doi:10.6084/m9.figshare.22637920
Xia, P., Chen, J., Bai, X., Li, M., Wang, L., & Lu, Z. (2022) · Figshare · doi:10.6084/m9.figshare.19932981
Xia, P., Chen, J., Bai, X., Li, M., Wang, L., & Lu, Z. (2022) · Figshare · doi:10.6084/m9.figshare.19932987
Metadata
- Authors
- Kim, D. K., Park, J., Han, D., Yang, J., Kim, A., Woo, J., Kim, Y., & Mook-Jung, I.
- Affiliations
- Seoul National University (KR)
- Corresponding author
- Kim, Youngsoo
- Venue
- Molecular Neurodegeneration
- Published
- 2018-01-16
- Volume
- 13
- Issue
- 1
- Pages
- 2-2
- ISSN
- 1750-1326 (ISSN-L)
- PMC
- PMC5771139
- OpenAlex
- W2782632913
- Cited by
- 95
- References
- 78
- Citations by year
- 2026: 2 · 2025: 11 · 2024: 11 · 2023: 10 · 2022: 19 · 2021: 14 · 2020: 16 · 2019: 9 · 2018: 3
- FWCI
- 7.20
- Type
- journal article
- Language
- en
- Open access
- gold
- doi.org
- Licence
- cc-by
- Locations
- Molecular Neurodegeneration (publishedVersion, cc-by)
- PubMed Central (publishedVersion, cc-by)
- PubMed (publishedVersion)
- DOAJ (DOAJ: Directory of Open Access Journals) (submittedVersion, cc-by-sa)
- Seoul National University Open Repository (Seoul National University) (submittedVersion)
- Funders
- National Research Foundation of Korea (2011-0030738, 2017M3C9A5031597, 2011-0030740, 2015R1A2A1A05001794, 2014M3C7A1046047, 2015M3C7A1028790)
- Topics
- Life Sciences › Neuroscience › Cellular and Molecular Neuroscience › Alzheimer's disease research and treatments
- Health Sciences › Medicine › Psychiatry and Mental health › Dementia and Cognitive Impairment Research
- Life Sciences › Neuroscience › Neurology › Neuroinflammation and Neurodegeneration Mechanisms
- Keywords
- Alzheimer's disease, amyloid plaques, neurofibrillary tangles, amyloid-beta, tau protein, hippocampal proteome, differentially expressed proteins, synaptic dysfunction, neuroinflammation, memory impairment, transgenic mouse model
- MeSH terms
- Alzheimer Disease, Animals, Disease Models, Animal, Hippocampus, Humans, Mice, Transgenic, Mutation, Amyloid beta-Protein Precursor, tau Proteins, Transgenes, Proteomics, Mice, Presenilin-1
About these checks
Registry, retraction, Cites and statistics results are computed, not judged, with one exception: a printed reference that no index lists is read once by a model before it counts as a citation error. Claims are extracted by a model and kept only when their quote appears verbatim in the text; each cited source is then checked, with a model’s help, for whether it says what the claim relies on. Those verdicts can be wrong — read the claim’s quote and the cited source before relying on one.
Statistics and arithmetic are recomputed, not judged.
Confidence bands are shown only for fields calibrated on our annotated test set. None is calibrated yet, so no band is shown.
What counts as a claim ›How we measure confidence ›How we check this ›
Are you an author, or do you see a problem with this page? Request a review
