

The DOI matches its Crossref record; 83 of the 83 references it cites were found in a registry or an index.
PU.1 regulates Alzheimer’s disease-associated genes in primary human microglia
Open accessAbstract
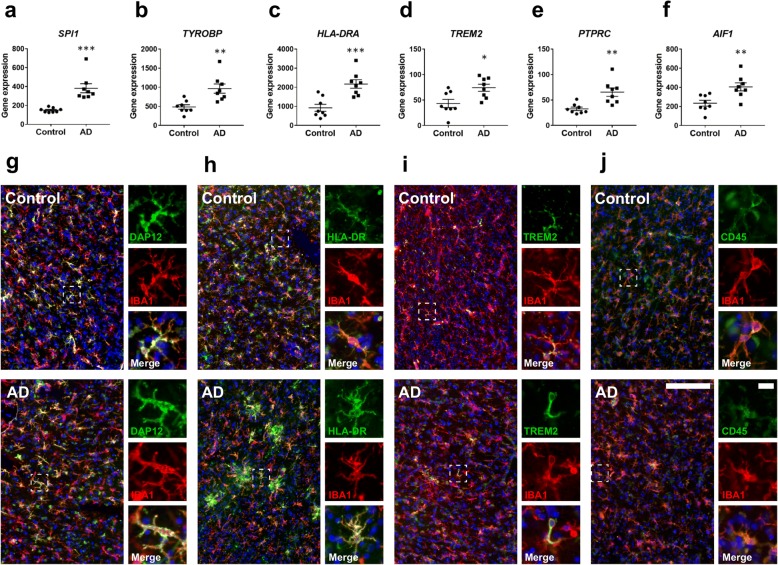
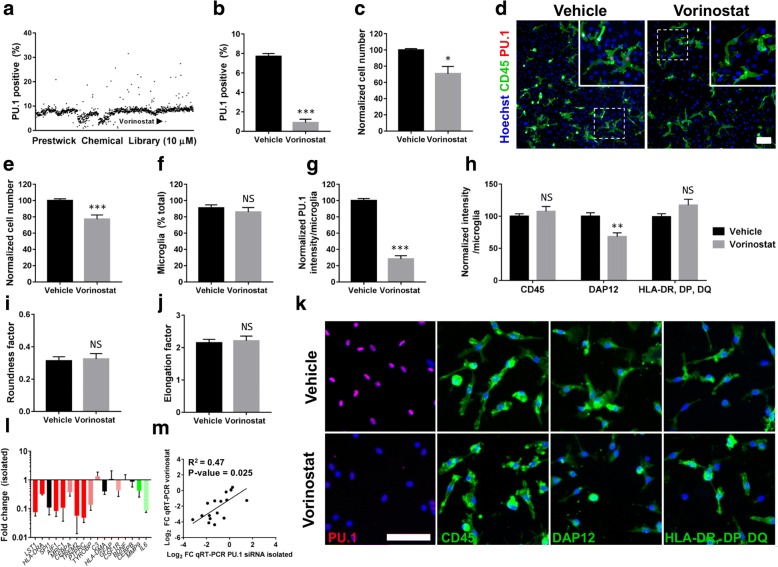
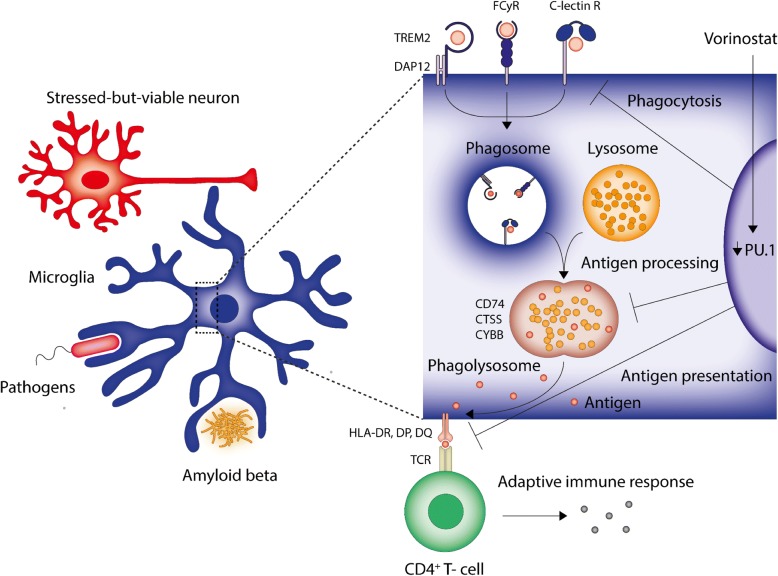
BACKGROUND: Microglia play critical roles in the brain during homeostasis and pathological conditions. Understanding the molecular events underpinning microglial functions and activation states will further enable us to target these cells for the treatment of neurological disorders. The transcription factor PU.1 is critical in the development of myeloid cells and a major regulator of microglial gene expression. In the brain, PU.1 is specifically expressed in microglia and recent evidence from genome-wide association studies suggests that reductions in PU.1 contribute to a delayed onset of Alzheimer's disease (AD), possibly through limiting neuroinflammatory responses. METHODS: To investigate how PU.1 contributes to immune activation in human microglia, microarray analysis was performed on primary human mixed glial cultures subjected to siRNA-mediated knockdown of PU.1. Microarray hits were confirmed by qRT-PCR and immunocytochemistry in both mixed glial cultures and isolated microglia following PU.1 knockdown. To identify attenuators of PU.1 expression in microglia, high throughput drug screening was undertaken using a compound library containing FDA-approved drugs. NanoString and immunohistochemistry was utilised to investigate the expression of PU.1 itself and PU.1-regulated mediators in primary human brain tissue derived from neurologically normal and clinically and pathologically confirmed cases of AD. RESULTS: Bioinformatic analysis of gene expression upon PU.1 silencing in mixed glial cultures revealed a network of modified AD-associated microglial genes involved in the innate and adaptive immune systems, particularly those involved in antigen presentation and phagocytosis. These gene changes were confirmed using isolated microglial cultures. Utilising high throughput screening of FDA-approved compounds in mixed glial cultures we identified the histone deacetylase inhibitor vorinostat as an effective attenuator of PU.1 expression in human microglia. Further characterisation of vorinostat in isolated microglial cultures revealed gene and protein changes partially recapitulating those seen following siRNA-mediated PU.1 knockdown. Lastly, we demonstrate that several of these PU.1-regulated genes are expressed by microglia in the human AD brain in situ. CONCLUSIONS: Collectively, these results suggest that attenuating PU.1 may be a valid therapeutic approach to limit microglial-mediated inflammatory responses in AD and demonstrate utility of vorinostat for this purpose.
Overview
The claims and statistics of this paper haven’t been checked yet.
Run the check — free, no account needed. It reads the open-access text and checks the sources it cites.
Integrity signals
Registry
Cites
Statistics
Figures
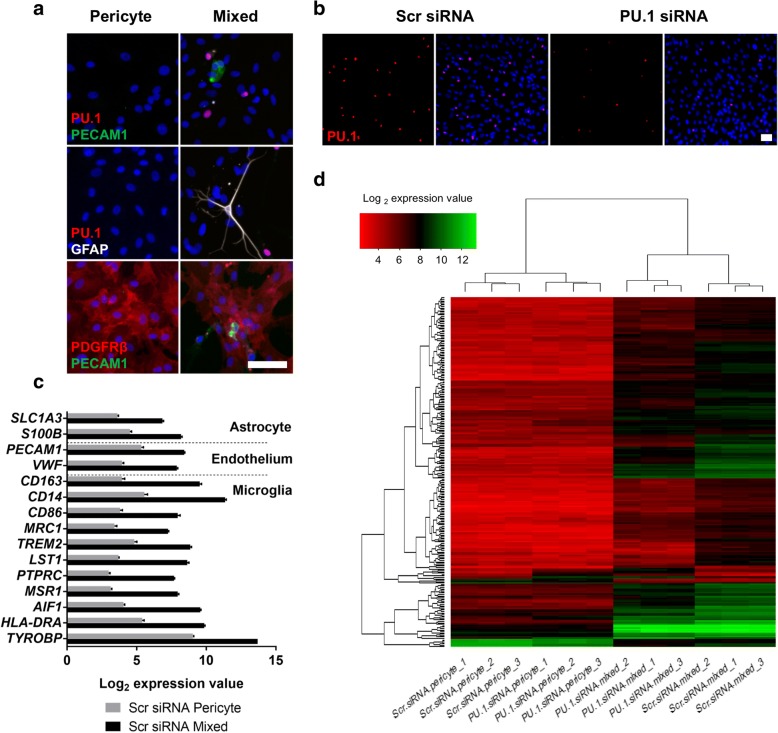
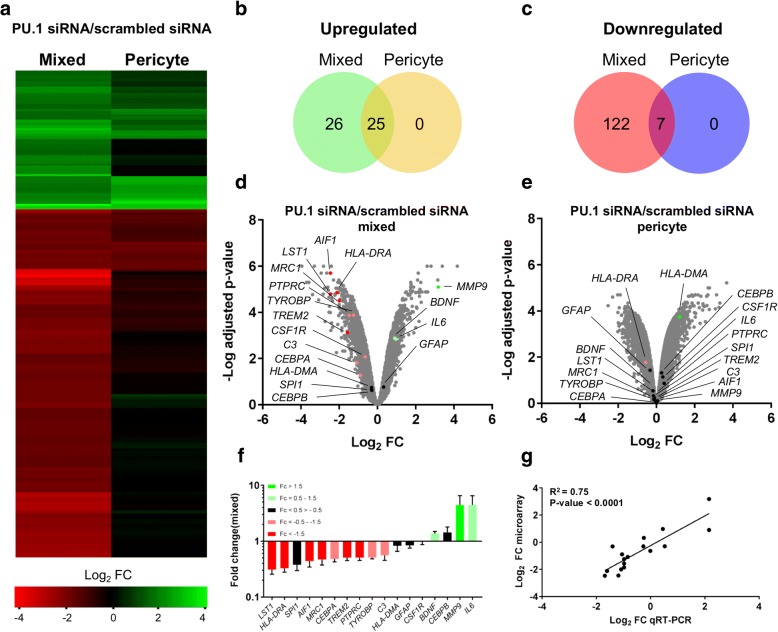
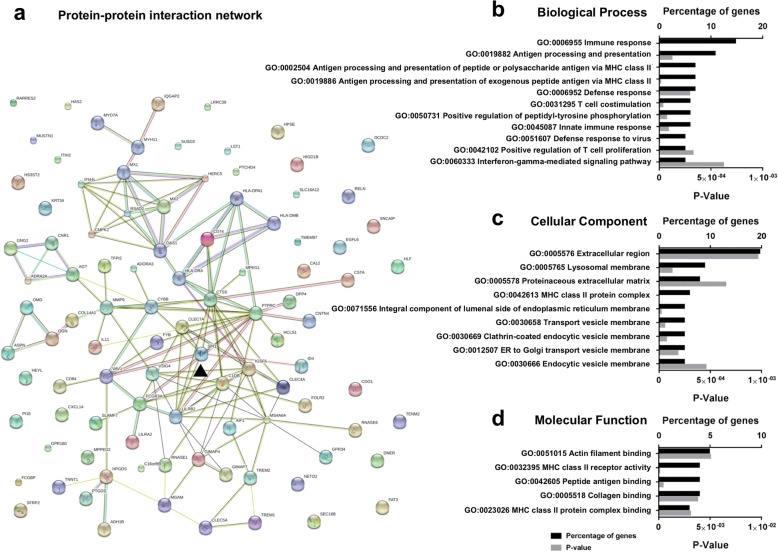
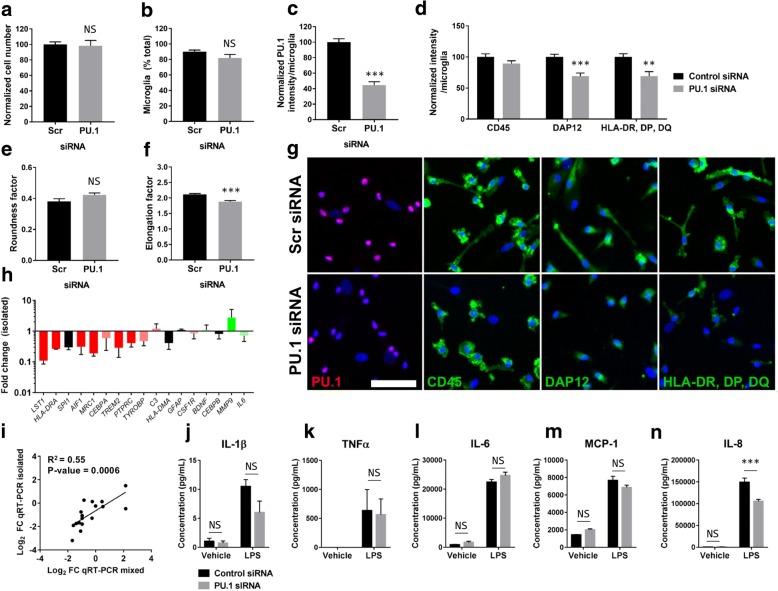
Verification
Claims the paper makes
The claims and statistics of this paper haven’t been checked yet.
Run the check — free, no account needed. It reads the open-access text and checks the sources it cites.
Claims other papers make about this one
Each is checked against this paper’s own text: does it say what the citing paper says it does?
The source backs part of the claim, not all of it — or backs it for a different population, condition or comparison.
In the citing paper
“given that PU.1 reduction has been reported to result in the down-regulation of massive proinflammatory genes and cell cycle–related genes (14, 43).”
From Arresting the bad seed: HDAC3 regulates proliferation of different microglia after ischemic stroke (2024) · cites this paper as [43]
Experimental — accuracy not yet measuredThe source backs part of the claim, not all of it — or backs it for a different population, condition or comparison.
In the citing paper
“Another similar study observed no reduction in microglia number, though PU.1 loss was measured at a culture level so the reduction could not be quantified on a single-cell level31.”
From Modest changes in Spi1 dosage reveal the potential for altered microglial function as seen in Alzheimer’s disease (2021) · cites this paper as [31]
Experimental — accuracy not yet measuredThe source backs part of the claim, not all of it — or backs it for a different population, condition or comparison.
In the citing paper
“Silencing of PU.1 in human microglia culture suppressed expression of myeloid adapter protein DAP12/TYROBP, TREM2, LST1, CD11b, MRC1, CEBPA, PTPRC and MHC class II genes HLA-DR, HLA-DP and HLA-DQ [30, 31], suggesting its role in antigen presentation and pro-inflammatory response by PU.1 [30, 31].”
From Transcriptional and Epigenetic Regulation of Microglia in Health and Disease (2019) · cites this paper as [30]
Experimental — accuracy not yet measuredThe cited source says what the claim attributes to it.
In the citing paper
“Increased PU.1 expression levels are associated with AD (Gjoneska et al., 2015; Huang et al., 2017; Rustenhoven et al., 2018) and Huntington’s disease (Crotti et al., 2014)”
From A novel molecular class that recruits HDAC/MECP2 complexes to PU.1 motifs reduces neuroinflammation (2023) · cites this paper as Rustenhoven et al., 2018
The cited source says what the claim attributes to it.
In the citing paper
“High-throughput screening of 1280 US Food and Drug Administration–approved compounds also identified an HDAC inhibitor, vorinostat, as a candidate drug for attenuating PU.1 level, which is then found to mimic partial effects of PU.1 knockdown (43).”
From Arresting the bad seed: HDAC3 regulates proliferation of different microglia after ischemic stroke (2024) · cites this paper as [43]
The cited source says what the claim attributes to it.
In the citing paper
“In BV2 microglial cells protective low expression of PU.1 led to decreased phagocytic uptake (Fig. 2), which is in line with previous data showing that siRNA knock-down of PU.1 in human microglia in vitro reduces expression of genes involved in phagocytic and antigen presentation pathways (Rustenhoven et al., 2018).”
From Alzheimer's-associated PU.1 expression levels regulate microglial inflammatory response (2021) · cites this paper as Rustenhoven et al., 2018
The cited source says what the claim attributes to it.
In the citing paper
“Analysis of mixed microglia/pericyte cultures where PU.1 was reduced via siRNA showed reduced expression of DAP12 and HLA-DR/DP/DQ31.”
From Modest changes in Spi1 dosage reveal the potential for altered microglial function as seen in Alzheimer’s disease (2021) · cites this paper as [31]
The cited source says what the claim attributes to it.
In the citing paper
“Previous work has identified that Spi1 is able to influence multiple gene networks in microglia5,7,31 and has been proposed as central to a network of AD risk genes that are conserved between species50.”
From Modest changes in Spi1 dosage reveal the potential for altered microglial function as seen in Alzheimer’s disease (2021) · cites this paper as [31]
The cited source says what the claim attributes to it.
In the citing paper
“In vitro cell culture studies have demonstrated that Spi1 regulates the expression of AD-associated genes involved in the phagocytic activity and immune response of microglia1,6.”
From Effects of SPI1-mediated transcriptome remodeling on Alzheimer's disease-related phenotypes in mouse models of Aβ amyloidosis (2024) · cites this paper as [6]
The cited source says what the claim attributes to it.
In the citing paper
“which encodes microglia receptors involved in antigen presentation and is regulated by PU.1 [61].”
From Sex-specific DNA methylation differences in Alzheimer’s disease pathology (2021) · cites this paper as [61]
The cited source says what the claim attributes to it.
In the citing paper
“In males, the most significant CpG-gene expression was for HLA-DRB1, another PU.1 target gene [61].”
From Sex-specific DNA methylation differences in Alzheimer’s disease pathology (2021) · cites this paper as [61]
In the citing paper
“In addition, PU.1 can regulate expression of genes associated with AD risk or onset, including ABCA7, CD33, TREM2, MS4A4A, MS4A6A, TYROBP, Aif1, and MYBPC3 [492, 493].”
From Molecular and cellular mechanisms underlying the pathogenesis of Alzheimer’s disease (2020) · cites this paper as [493]
In the citing paper
“Furthermore, Rustenhoven et al. identified another HDAC class I/II/IV inhibitor vorinostat as an effective attenuator of PU.1 in primary human microglia-enriched culture [30, 39].”
From Transcriptional and Epigenetic Regulation of Microglia in Health and Disease (2019) · cites this paper as [30]
In the citing paper
“However, vorinostat treatment showed reduction in DAP12 expression, whereas expression of CD45 and HLA-DR, HLA-DP or HLA-D1 remained unchanged [30].”
From Transcriptional and Epigenetic Regulation of Microglia in Health and Disease (2019) · cites this paper as [30]
In the citing paper
“suggesting its role in antigen presentation and pro-inflammatory response by PU.1 [30, 31].”
From Transcriptional and Epigenetic Regulation of Microglia in Health and Disease (2019) · cites this paper as [30]
Self-check
Percentages, sums and reported differences re-computed from the paper’s own numbers.
The self-check needs the paper’s full text.
Citations
Cites
1 retracted
RETRACTED ARTICLE: Pericyte loss influences Alzheimer-like neurodegeneration in mice
Sagare, A. P., Bell, R. D., Zhao, Z., Ma, Q., Winkler, E. A., Ramanathan, A., & Zlokovic, B. V. (2013) · Nature Communications · doi:10.1038/ncomms3932 · Cited by 589
RetractedSubramanian, A., Tamayo, P., Mootha, V. K., Mukherjee, S., Ebert, B. L., Gillette, M. A., Paulovich, A., Pomeroy, S. L., Golub, T. R., Lander, E. S., et al. (2005) · Proceedings of the National Academy of Sciences · doi:10.1073/pnas.0506580102 · Cited by 53,625
McKhann, G., Drachman, D., Folstein, M., Katzman, R., Price, D., & Stadlan, E. M. (1984) · Neurology · doi:10.1212/wnl.34.7.939 · Cited by 27,915
Neuropathological stageing of Alzheimer-related changes.
Braak, H., & Braak, E. (1991) · Acta Neuropathologica · doi:10.1007/bf00308809 · Cited by 16,123
Mootha, V. K., Lindgren, C. M., Eriksson, K.-F., Subramanian, A., Sihag, S., Lehar, J., Puigserver, P., Carlsson, E., Ridderstråle, M., Laurila, E., et al. (2003) · Nature Genetics · doi:10.1038/ng1180 · Cited by 10,197
Corder, E. H., Saunders, A. M., Strittmatter, W. J., Schmechel, D. E., Gaskell, P. C., Small, G. W., Roses, A. D., Haines, J. L., & Pericak-Vance, M. A. (1993) · Science · doi:10.1126/science.8346443 · Cited by 9,429
Polazzi, E., Mengoni, I., Caprini, M., Peña‐Altamira, E., Kurtys, E., & Monti, B. (2012) · Neurosignals · doi:10.1159/000337115 · Cited by 9,023
Microglia: a sensor for pathological events in the CNS
Kreutzberg, G. W. (1996) · Trends in Neurosciences · doi:10.1016/0166-2236(96)10049-7 · Cited by 4,396
Meta-Analysis of 74,046 Individuals Identifies 11 New Susceptibility Loci for Alzheimer’s Disease
(EADI), E. A. D. I., Lambert, J.-C., (GERAD), G. A. E. R. I. A. D., Alzheimer's Disease Genetic Consortium (ADGC), (CHARGE), C. F. H. A. A. R. I. G. E., Ibrahim-Verbaas, C. A., Harold, D., Naj, A. C., Sims, R., Bellenguez, C., et al. (2013) · Nature Genetics · doi:10.1038/ng.2802 · Cited by 4,336
Self-citationSynaptic Pruning by Microglia Is Necessary for Normal Brain Development
Paolicelli, R. C., Bolasco, G., Pagani, F., Maggi, L., Scianni, M., Panzanelli, P., Giustetto, M., Ferreira, T. A., Guiducci, E., Dumas, L., et al. (2011) · Science · doi:10.1126/science.1202529 · Cited by 4,244
Cited by
Sorted by citations
Items 101–158 of 158
Khullar, S., Huang, X., Ramesh, R., Svaren, J. P., & Wang, D. (2024) · Bioinformatics Advances · doi:10.1093/bioadv/vbae206 · Cited by 5
König, J., Blusch, A., Fatoba, O., Gold, R., Carsten Saft, C., & Ellrichmann, G. (2025) · International Journal of Molecular Sciences · doi:10.3390/ijms26073318 · Cited by 5
A single-cell atlas of mouse olfactory bulb chromatin accessibility
Chen, Y., Ding, X., Wang, S., Ding, P., Xu, Z., Li, J., Wang, M., Xiang, R., Wang, X., Wang, H., et al. (2021) · Journal of genetics and genomics/Journal of Genetics and Genomics · doi:10.1016/j.jgg.2021.02.007 · Cited by 5
Puype, H., Deschildre, J., & Vermeirssen, V. (2023) · bioRxiv (Cold Spring Harbor Laboratory) · doi:10.1101/2023.02.23.529626 · Cited by 4
DNA Methylation in Alzheimer’s Disease
Weymouth, L. S., Smith, A. R., & Lunnon, K. (2024) · Current topics in behavioral neurosciences · doi:10.1007/7854_2024_530 · Cited by 4
Self-citationLe, S., Xu, F., Luo, Z., Shi, W., Lu, S., Zhang, Z., Guo, Z., Xu, W., Yang, M., Li, T., et al. (2025) · BMC Genomics · doi:10.1186/s12864-025-11256-y · Cited by 4
Han, S., Cho, S.-A., Choi, W., Eilbeck, K. L., Coon, H. H., Nho, K. T., & Lee, Y. (2025) · BMC Genomics · doi:10.1186/s12864-025-11362-x · Cited by 6
Cell Type–Specific Nuclei Markers: The Need for Human Brain Research to Go Nuclear
Wiseman, J. A., Dragunow, M., & Park, T. (2021) · The Neuroscientist · doi:10.1177/10738584211037351 · Cited by 5
Self-citationPositive selection on rare variants of IGF1R and BRD4 underlying the cold adaptation of wild boar
Chen, J., Jakovlić, I., Sablin, M., Xia, S., Xu, Z., Guo, Y., Kuang, R., Zhong, J., Jia, Y., Thi, T. N. T., et al. (2025) · Genetics Selection Evolution · doi:10.1186/s12711-025-00986-y · Cited by 3
PU.1 restores microglial dysfunction caused by C9ORF72 repeat expansions in neural organoids
Ljubikj, T., Mars, M., van der Geest, A. T., Jakobs, C. E., Bessler, N., Donega, V., van den Oetelaar, X. P. R. M., de Wit, M., & Pasterkamp, R. J. (2025) · Brain · doi:10.1093/brain/awaf340 · Cited by 4
Gong, Y., Srinivasan, S. S., Zhang, R., Kessenbrock, K., & Zhang, J. (2022) · Biomolecules · doi:10.3390/biom12070874 · Cited by 4
Targeting SPI1 to mitigate amyloid-β pathology in Alzheimer's disease
Shao, J., Youngblood, H. A., & Yang, L. (2025) · Journal of Alzheimer s Disease · doi:10.1177/13872877251316593 · Cited by 3
Phenotypic approaches for CNS drugs
Sharma, R., Oyagawa, C. R. M., Abbasi, H., Dragunow, M., & Conole, D. (2024) · Trends in Pharmacological Sciences · doi:10.1016/j.tips.2024.09.003 · Cited by 2
Self-citationJiang, A., Shi, D., Que, X., Lin, Z., Chen, Y., Huang, Y., Liu, C., Wen, Y., Zhang, S., & Huang, W. (2025) · Frontiers in Molecular Biosciences · doi:10.3389/fmolb.2025.1585761 · Cited by 2
PU.1: the conductor of Alzheimer’s symphony
Sun, C., & Liu, Q. (2026) · Molecular Neurodegeneration · doi:10.1186/s13024-026-00937-1 · Cited by 2
Wang, H., Li, X., Li, T., Li, Z., Sham, P. C., & Zhang, Y. (2025) · Genome biology · doi:10.1186/s13059-025-03485-x · Cited by 2
Role of epigenetics in the brain
Matt, S. M., Roth, E. D., & Roth, T. L. (2021) · Elsevier eBooks · doi:10.1016/b978-0-12-823577-5.00007-6 · Cited by 2
Galindez, G., Lopez, B. A., Blumenthal, D. B., & Kacprowski, T. (2025) · Network and Systems Medicine · doi:10.14293/nsm.25.1.0003 · Cited by 2
Hassan-Abdi, R., Brenet, A., Bennis, M., Yanicostas, C., & Soussi‐Yanicostas, N. (2019) · bioRxiv (Cold Spring Harbor Laboratory) · doi:10.1101/731901 · Cited by 2
Morgans, W. G., Sharrocks, A. D., & Iqbal, M. (2023) · bioRxiv (Cold Spring Harbor Laboratory) · doi:10.1101/2023.09.25.559293 · Cited by 2
Liu, J., Guo, Q., Liu, G., Wang, W., Jin, X., Hao, B., & Lei, B. (2025) · Genes and Immunity · doi:10.1038/s41435-024-00316-0 · Cited by 1
lncRNA Glelr modulates microglia inflammatory programs in association with PU.1
Pradhan, R., Sakib, M. S., Kaurani, L., Krueger, D. M., Peña, T., Burkhardt, S., Schütz, A., Kronenberg‐Versteeg, D., Delalle, I., Sananbenesi, F., et al. (2026) · Neurobiology of Disease · doi:10.1016/j.nbd.2026.107366 · Cited by 1
Wen, S., Guo, F., Li, Z., Huang, G. J., Shen, M., & He, X. (2026) · Investigative Ophthalmology & Visual Science · doi:10.1167/iovs.67.3.64 · Cited by 2
Li, E., Zhang, P., & Feng, W. (2026) · Frontiers in Immunology · doi:10.3389/fimmu.2026.1783786 · Cited by 1
Epigenetics of Alzheimer’s Disease: Past, Present and Future
Adiga, D., Eswaran, S., Sriharikrishnaa, S., Khan, N. G., Kabekkodu, S. P., & Kumar, D. (2023) · BENTHAM SCIENCE PUBLISHERS eBooks · doi:10.2174/9789815136142123010005 · Cited by 1
You, Z., He, H., Xie, X., Zhang, J., Mo, L., Kang, X., Xie, L., Zhang, Y., Hu, N., Wang, L., et al. (2022) · Research Square · doi:10.21203/rs.3.rs-1575053/v1 · Cited by 1
Lipopolysaccharide-dependent transcriptional regulation of PU.1 in microglial cells
Mandal, C., Yoon, T., Park, J. Y., Jung, K. H., & Chai, Y. G. (2019) · Molecular & Cellular Toxicology · doi:10.1007/s13273-019-00057-6
Koch, B. M. E. (2019) · eDiss (Georg-August-Universität Göttingen) · doi:10.53846/goediss-7716
Jones, R. E., Hill, M., & Taylor, P. (2022) · Wellcome Open Research · doi:10.12688/wellcomeopenres.17705.1
Khaire, A. S., Wen, J., Yang, X., Zhou, H., Shen, Y., & Li, Y. (2022) · bioRxiv (Cold Spring Harbor Laboratory) · doi:10.1101/2022.11.01.514771
He, H., xie, F., Zhang, J. C., Mo, L., Kang, X., Xie, L., Zhang, Y., Wang, L., Hu, N., Peng, C. Y., et al. (2024) · doi:10.22541/au.170670769.94573998/v1
Sudwarts, A., Ramesha, S., Gao, T., Ponnusamy, M., Wang, S., Hansen, M. T., Kozlova, A., Bitarafan, S., Kumar, P., Beaulieu‐Abdelahad, D., et al. (2023) · Figshare · doi:10.6084/m9.figshare.22609114
Additional file 2 of Sex-specific DNA methylation differences in Alzheimer’s disease pathology
Zhang, L., Young, J. I., Gomez, L., Silva, T. C., Schmidt, M. A., Cai, J., Chen, X., Martin, E. R., & Wang, L. (2021) · Figshare · doi:10.6084/m9.figshare.14490464
Tissue-specific atlas of trans-models for gene regulation elucidates complex regulation patterns
D’Agostino, R. D., & Gottlieb, A. (2024) · BMC Genomics · doi:10.1186/s12864-024-10317-y
Spatially Resolved Microglial Expression Around Aβ Plaques in Human Alzheimer’s Disease TissuePreprint
Wood, J. I., Ppasia, G., Rolland-Du-Roscoat, P., Desai, S., Choudhury, S., Balbaa, A., Gavriouchkina, D., Blunskyte-Hendley, M., Hardy, J., Cummings, D. M., et al. (2025) · SSRN Electronic Journal · doi:10.1101/2025.08.29.673089
Effects of the spi1a gene on Alzheimer's disease-related phenotypes in a zebrafish modelPreprint
Sun, X., Wu, Z., Ge, K., wang, Y., Tian, L., wang, J., liang, G., & Sheng, D. (2025) · Research Square · doi:10.21203/rs.3.rs-6961277/v1
Ise, M., Bizen, N., Simankova, A., Okuyama, K., Shibata, S., Tada, M., & Takebayashi, H. (2025) · Neurobiology of Disease · doi:10.1016/j.nbd.2025.107142
Pradhan, R., Sakib, M. S., Kaurani, L., Krüger, D. M., Centeno, T. P., Burkhardt, S., Schütz, A., Kronenberg‐Versteeg, D., Delalle, I., Sananbenesi, F., et al. (2025) · bioRxiv (Cold Spring Harbor Laboratory) · doi:10.1101/2025.10.31.685723
Alzheimer’s Disease Risk Variants Interact with Amyloid-Beta to Modulate Monocyte Function
Chatila, Z. K., & Bradshaw, E. M. (2025) · Cells · doi:10.3390/cells14241990
Sudwarts, A., Ramesha, S., Gao, T., Ponnusamy, M., Wang, S., Hansen, M. T., Kozlova, A., Bitarafan, S., Kumar, P., Beaulieu‐Abdelahad, D., et al. (2022) · Figshare · doi:10.6084/m9.figshare.19728376
Smyth, L. C. D., Murray, H. C., Hill, M. J., van Leeuwen, E., Highet, B., Magon, N. J., Osanlouy, M., Mathiesen, S. N., Mockett, B., Singh-Bains, M. K., et al. (2022) · Figshare · doi:10.6084/m9.figshare.19418460
Self-citationSudwarts, A., Ramesha, S., Gao, T., Ponnusamy, M., Wang, S., Hansen, M. T., Kozlova, A., Bitarafan, S., Kumar, P., Beaulieu‐Abdelahad, D., et al. (2022) · Figshare · doi:10.6084/m9.figshare.19728382
Sudwarts, A., Ramesha, S., Gao, T., Ponnusamy, M., Wang, S., Hansen, M. T., Kozlova, A., Bitarafan, S., Kumar, P., Beaulieu‐Abdelahad, D., et al. (2022) · Figshare · doi:10.6084/m9.figshare.19728391
Additional file 1 of Sex-specific DNA methylation differences in Alzheimer’s disease pathology
Zhang, L., Young, J. I., Gomez, L., Silva, T. C., Schmidt, M. A., Cai, J., Chen, X., Martin, E. R., & Wang, L. (2021) · Figshare · doi:10.6084/m9.figshare.14490461
Sudwarts, A., Ramesha, S., Gao, T., Ponnusamy, M., Wang, S., Hansen, M. T., Kozlova, A., Bitarafan, S., Kumar, P., Beaulieu‐Abdelahad, D., et al. (2022) · Figshare · doi:10.6084/m9.figshare.19728373
Sonn, I., Honda‐Ozaki, F., Yoshimatsu, S., Morimoto, S., Watanabe, H., & Okano, H. (2022) · Figshare · doi:10.6084/m9.figshare.20208350
D’Agostino, R. D., & Gottlieb, A. (2024) · Figshare · doi:10.6084/m9.figshare.25632975
Sudwarts, A., Ramesha, S., Gao, T., Ponnusamy, M., Wang, S., Hansen, M. T., Kozlova, A., Bitarafan, S., Kumar, P., Beaulieu‐Abdelahad, D., et al. (2022) · Figshare · doi:10.6084/m9.figshare.19728388
Muñoz‐Castro, C., Mejias‐Ortega, M., Sánchez‐Mejías, E., Navarro, V., Trujillo‐Estrada, L., Jiménez, S., León, J. A. G., Fernandez-Valenzuela, J. J., Sanchez-Mico, M. V., Romero‐Molina, C., et al. (2024) · Figshare · doi:10.6084/m9.figshare.26571967
Sudwarts, A., Ramesha, S., Gao, T., Ponnusamy, M., Wang, S., Hansen, M. T., Kozlova, A., Bitarafan, S., Kumar, P., Beaulieu‐Abdelahad, D., et al. (2022) · Figshare · doi:10.6084/m9.figshare.19728385
Sudwarts, A., Ramesha, S., Gao, T., Ponnusamy, M., Wang, S., Hansen, M. T., Kozlova, A., Bitarafan, S., Kumar, P., Beaulieu‐Abdelahad, D., et al. (2022) · Figshare · doi:10.6084/m9.figshare.19728379
Sudwarts, A., Ramesha, S., Gao, T., Ponnusamy, M., Wang, S., Hansen, M. T., Kozlova, A., Bitarafan, S., Kumar, P., Beaulieu‐Abdelahad, D., et al. (2022) · Figshare · doi:10.6084/m9.figshare.19728370
Sudwarts, A., Ramesha, S., Gao, T., Ponnusamy, M., Wang, S., Hansen, M. T., Kozlova, A., Bitarafan, S., Kumar, P., Beaulieu‐Abdelahad, D., et al. (2022) · Figshare · doi:10.6084/m9.figshare.19728367
Deyell, J., Hasselmann, J., Stroud, L., Raychaudhuri, U., Guo, Y., Cha, B., Karma, C., Tendean, D., Tran, M.-H. V., Gromova, A., et al. (2025) · bioRxiv (Cold Spring Harbor Laboratory) · doi:10.64898/2025.12.17.692628
Morgans, W. G., Sharrocks, A. D., & Iqbal, M. (2026) · NAR Genomics and Bioinformatics · doi:10.1093/nargab/lqag104 · Cited by 2
Chen, Y., Liang, W., Ji, T., Zhao, K., & Zhong, C. (2026) · Molecular Immunology · doi:10.1016/j.molimm.2026.08.014
Ramani, M., Nguyen, N., Solis, J., Tenen, D. G., & Trinh, B. Q. (2026) · Biology · doi:10.3390/biology15181657
Yin, X., Wang, M., Gao, Y., Yao, J., Li, Y., Chen, T., Wang, Z., Wang, W., & Gao, Z. (2026) · Neurotherapeutics · doi:10.1016/j.neurot.2026.e01106
Metadata
- Authors
- Rustenhoven, J., Smith, A. M., Smyth, L. C., Jansson, D., Scotter, E. L., Swanson, M. E. V., Aalderink, M., Coppieters, N., Narayan, P., Handley, R., Overall, C., Park, T. I. H., Schweder, P., Heppner, P., Curtis, M. A., Faull, R. L. M., & Dragunow, M.
- Affiliations
- University of Auckland (NZ)
- Imperial College London (GB)
- Auckland City Hospital (NZ)
- Corresponding author
- Dragunow, Mike
- ORCID
- Venue
- Molecular Neurodegeneration
- Published
- 2018-08-20
- Volume
- 13
- Issue
- 1
- Pages
- 44-44
- ISSN
- 1750-1326 (ISSN-L)
- PMC
- PMC6102813
- OpenAlex
- W2888188888
- Cited by
- 155
- References
- 83
- Citations by year
- 2026: 8 · 2025: 26 · 2024: 20 · 2023: 21 · 2022: 31 · 2021: 22 · 2020: 17 · 2019: 9 · 2018: 1
- FWCI
- 5.61
- Type
- journal article
- Language
- en
- Open access
- gold
- doi.org
- Licence
- Locations
- Molecular Neurodegeneration (publishedVersion, cc-by)
- Europe PMC (PubMed Central) (publishedVersion, cc-by)
- PubMed Central (publishedVersion, cc-by)
- PubMed (publishedVersion)
- DOAJ (DOAJ: Directory of Open Access Journals) (submittedVersion, cc-by-sa)
- ResearchSpace (University of Auckland) (submittedVersion, cc-by)
- Spiral (Imperial College London) (submittedVersion, other-oa)
- Funders
- Hugh Green Foundation
- Neurological Foundation of New Zealand
- Health Research Council of New Zealand
- Topics
- Life Sciences › Neuroscience › Neurology › Neuroinflammation and Neurodegeneration Mechanisms
- Life Sciences › Neuroscience › Cellular and Molecular Neuroscience › Alzheimer's disease research and treatments
- Life Sciences › Neuroscience › Neurology › Neurological Disease Mechanisms and Treatments
- Keywords
- PU.1, Alzheimer's disease, microglia, transcription factors, neuroinflammation, vorinostat, histone deacetylase inhibitors, microglial gene expression, antigen presentation, phagocytosis, mixed glial cultures, therapeutic target
- MeSH terms
- Vorinostat, Proto-Oncogene Protein Spi-1, Alzheimer Disease, Gene Expression Regulation, Humans, Proto-Oncogene Proteins, Trans-Activators, Microglia, Histone Deacetylase Inhibitors
About these checks
Registry, retraction, Cites and statistics results are computed, not judged, with one exception: a printed reference that no index lists is read once by a model before it counts as a citation error. Claims are extracted by a model and kept only when their quote appears verbatim in the text; each cited source is then checked, with a model’s help, for whether it says what the claim relies on. Those verdicts can be wrong — read the claim’s quote and the cited source before relying on one.
Statistics and arithmetic are recomputed, not judged.
Confidence bands are shown only for fields calibrated on our annotated test set. None is calibrated yet, so no band is shown.
What counts as a claim ›How we measure confidence ›How we check this ›
Are you an author, or do you see a problem with this page? Request a review
