

The DOI matches its Crossref record; 71 of the 71 references it cites were found in a registry or an index.
Blood-brain barrier-associated pericytes internalize and clear aggregated amyloid-β42 by LRP1-dependent apolipoprotein E isoform-specific mechanism
Open accessAbstract
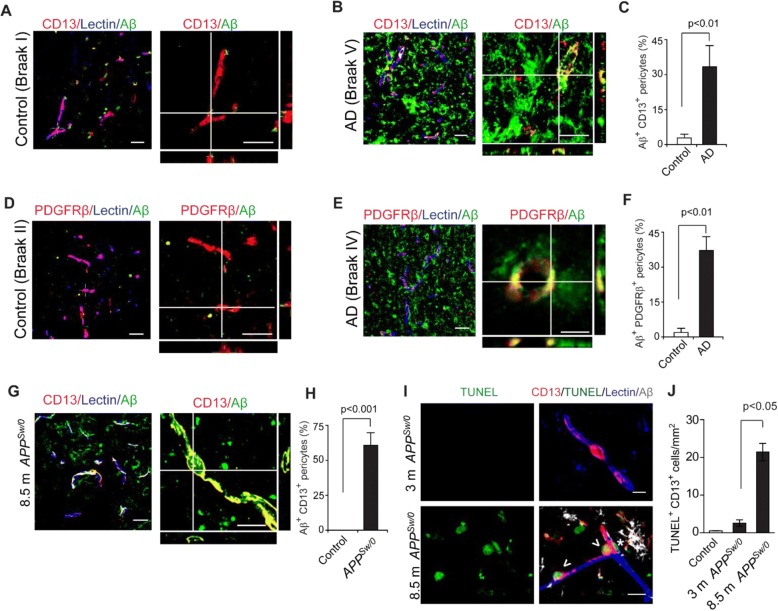
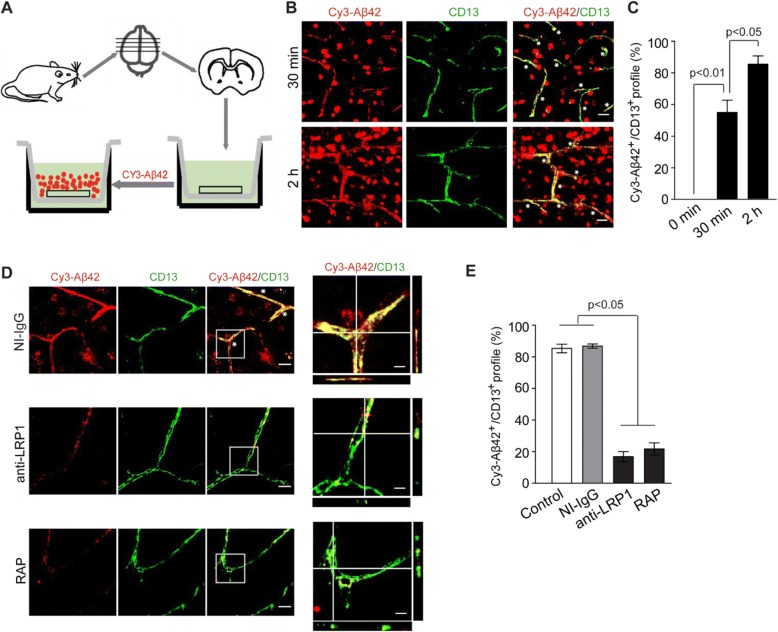
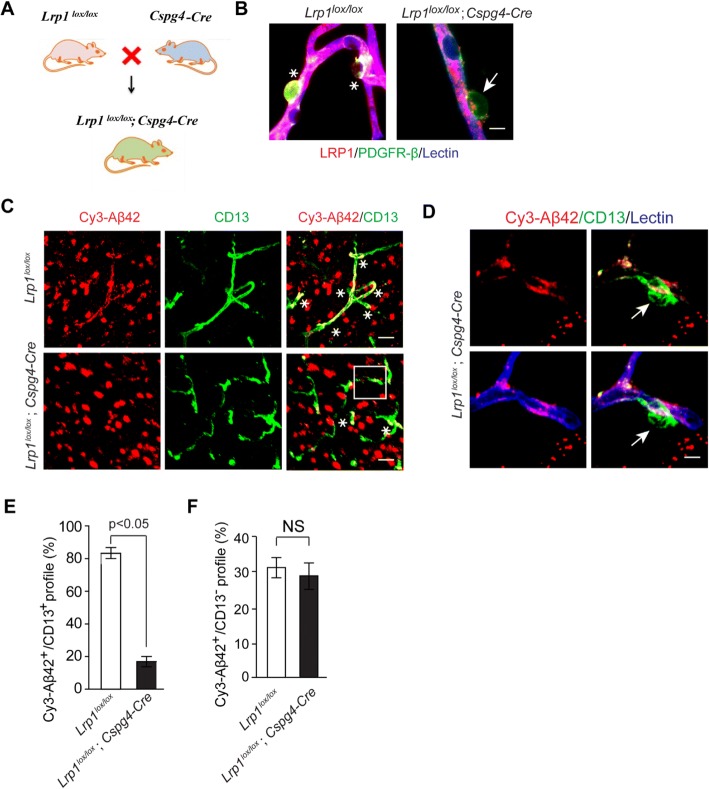
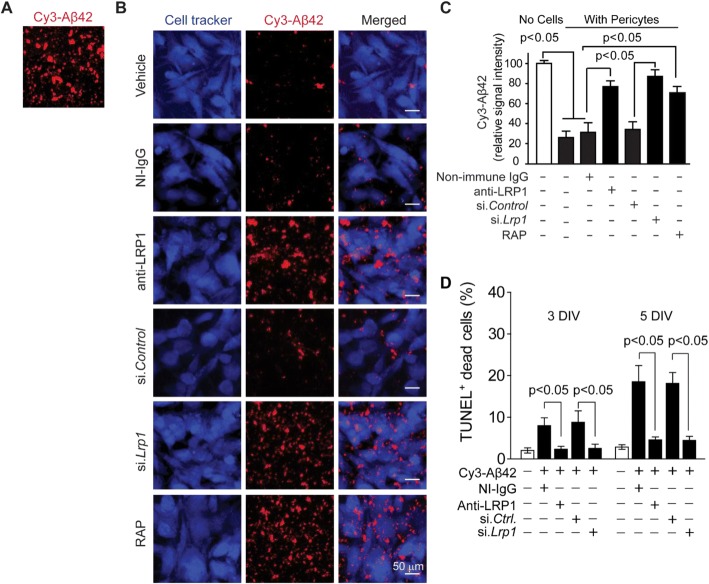
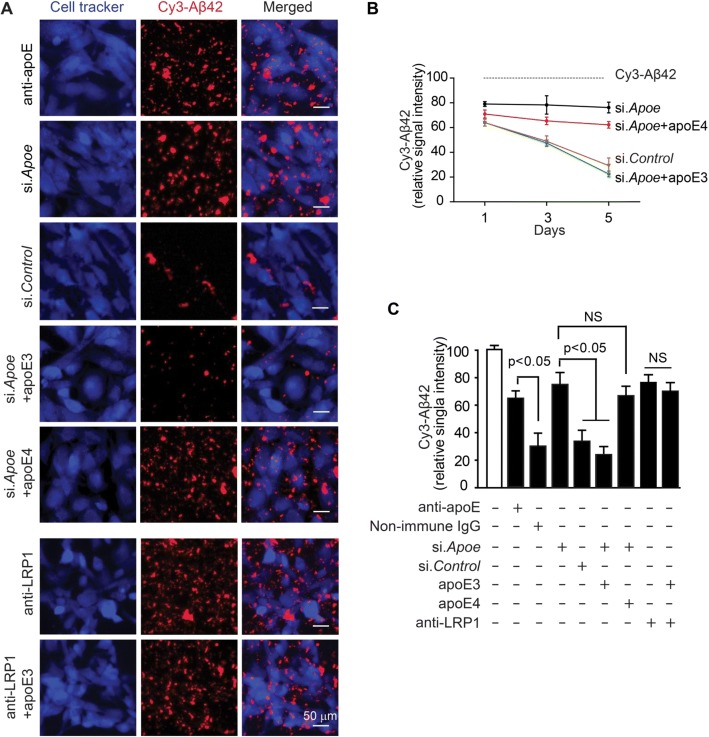
Abstract Background Clearance at the blood-brain barrier (BBB) plays an important role in removal of Alzheimer’s amyloid-β (Aβ) toxin from brain both in humans and animal models. Apolipoprotein E (apoE), the major genetic risk factor for AD, disrupts Aβ clearance at the BBB. The cellular and molecular mechanisms, however, still remain unclear, particularly whether the BBB-associated brain capillary pericytes can contribute to removal of aggregated Aβ from brain capillaries, and whether removal of Aβ aggregates by pericytes requires apoE, and if so, is Aβ clearance on pericytes apoE isoform-specific. Methods We performed immunostaining for Aβ and pericyte biomarkers on brain capillaries (< 6 μm in diameter) on tissue sections derived from AD patients and age-matched controls, and APPSwe/0 mice and littermate controls. Human Cy3-Aβ42 uptake by pericytes was studied on freshly isolated brain slices from control mice, pericyte LRP1-deficient mice (Lrplox/lox;Cspg4-Cre) and littermate controls. Clearance of aggregated Aβ42 by mouse pericytes was studied on multi-spot glass slides under different experimental conditions including pharmacologic and/or genetic inhibition of the low density lipoprotein receptor related protein 1 (LRP1), an apoE receptor, and/or silencing mouse endogenous Apoe in the presence and absence of human astrocyte-derived lipidated apoE3 or apoE4. Student’s t-test and one-way ANOVA followed by Bonferroni's post-hoc test were used for statistical analysis. Results First, we found that 35% and 60% of brain capillary pericytes accumulate Aβ in AD patients and 8.5-month-old APPSw/0 mice, respectively, compared to negligible uptake in controls. Cy3-Aβ42 species were abundantly taken up by pericytes on cultured mouse brain slices via LRP1, as shown by both pharmacologic and genetic inhibition of LRP1 in pericytes. Mouse pericytes vigorously cleared aggregated Cy3-Aβ42 from multi-spot glass slides via LRP1, which was inhibited by pharmacologic and/or genetic knockdown of mouse endogenous apoE. Human astrocyte-derived lipidated apoE3, but not apoE4, normalized Aβ42 clearance by mouse pericytes with silenced mouse apoE. Conclusions Our data suggest that BBB-associated pericytes clear Aβ aggregates via an LRP1/apoE isoform-specific mechanism. These data support the role of LRP1/apoE interactions on pericytes as a potential therapeutic target for controlling Aβ clearance in AD.
Overview
The claims and statistics of this paper haven’t been checked yet.
Run the check — free, no account needed. It reads the open-access text and checks the sources it cites.
Integrity signals
Registry
Cites
Statistics
Figures
Verification
Claims the paper makes
The claims and statistics of this paper haven’t been checked yet.
Run the check — free, no account needed. It reads the open-access text and checks the sources it cites.
Claims other papers make about this one
Each is checked against this paper’s own text: does it say what the citing paper says it does?
The source backs part of the claim, not all of it — or backs it for a different population, condition or comparison.
In the citing paper
“ApoE assists in Aβ clearance in an isoform-dependent manner wherein apoE2 > apoE3 > apoE4 [29, 30, 59].”
From Apolipoprotein E4, inhibitory network dysfunction, and Alzheimer’s disease (2019) · cites this paper as [59]
Experimental — accuracy not yet measuredIn the citing paper
“LRP1, expressed by the blood-brain barrier, is known to mediate transport of Aβ out of the brain (61)”
From LRPAP1 is released from activated microglia and inhibits microglial phagocytosis and amyloid beta aggregation (2023) · cites this paper as [61]
Self-check
Percentages, sums and reported differences re-computed from the paper’s own numbers.
The self-check needs the paper’s full text.
Citations
Cites
2 retracted
RETRACTED ARTICLE: Pericyte loss influences Alzheimer-like neurodegeneration in mice
Sagare, A. P., Bell, R. D., Zhao, Z., Ma, Q., Winkler, E. A., Ramanathan, A., & Zlokovic, B. V. (2013) · Nature Communications · doi:10.1038/ncomms3932 · Cited by 589
Self-citationRetractedMontagne, A., Nikolakopoulou, A. M., Zhao, Z., Sagare, A. P., Si, G., Lazic, D., Barnes, S. R., Daianu, M., Ramanathan, A., Go, A., et al. (2018) · Nature Medicine · doi:10.1038/nm.4482 · Cited by 344
Self-citationRetractedThe Amyloid Hypothesis of Alzheimer’s Disease: Progress and Problems on the Road to Therapeutics
Hardy, J., & Selkoe, D. J. (2002) · Science · doi:10.1126/science.1072994 · Cited by 13,864
NIA‐AA Research Framework: Toward a biological definition of Alzheimer's disease
Jack, C. R., Bennett, D. A., Blennow, K., Carrillo, M. C., Dunn, B., Haeberlein, S. B., Holtzman, D. M., Jagust, W., Jessen, F., Karlawish, J., et al. (2018) · Alzheimer's & Dementia · doi:10.1016/j.jalz.2018.02.018 · Cited by 10,537
Self-citationAmyloid oligomers exacerbate tau pathology in a mouse model of tauopathy
Selenica, M.-L. B., Brownlow, M., Jimenez, J. P., Lee, D. C., Pena, G., Dickey, C. A., Gordon, M. N., & Morgan, D. (2013) · Neurodegenerative Diseases · doi:10.1159/000337230 · Cited by 10,359
The amyloid hypothesis of Alzheimer's disease at 25 years
Selkoe, D. J., & Hardy, J. (2016) · EMBO Molecular Medicine · doi:10.15252/emmm.201606210 · Cited by 6,164
Correlative Memory Deficits, Aβ Elevation, and Amyloid Plaques in Transgenic Mice
Hsiao, K., Chapman, P., Nilsen, S., Eckman, C., Harigaya, Y., Younkin, S., Yang, F., & Cole, G. (1996) · Science · doi:10.1126/science.274.5284.99 · Cited by 4,210
Apolipoprotein E and Alzheimer disease: risk, mechanisms and therapy
Liu, C.-C., Kanekiyo, T., Xu, H., & Bu, G. (2013) · Nature Reviews Neurology · doi:10.1038/nrneurol.2012.263 · Cited by 3,459
Blood–brain barrier breakdown in Alzheimer disease and other neurodegenerative disorders
Sweeney, M. D., Sagare, A. P., & Zlokovic, B. V. (2018) · Nature Reviews Neurology · doi:10.1038/nrneurol.2017.188 · Cited by 3,076
Self-citationNeurovascular pathways to neurodegeneration in Alzheimer’s disease and other disorders
Zlokovic, B. V. (2011) · Nature Reviews Neuroscience · doi:10.1038/nrn3114 · Cited by 2,969
Self-citation
Cited by
Sorted by citations
Items 201–281 of 281
Ma, Q., Zhao, Z., Sagare, A. P., Wu, Y., Wang, M., Owens, N. C., Verghese, P. B., Herz, J., Holtzman, D. M., & Zloković, B. V. (2022) · Molecular Neurodegeneration · doi:10.1186/s13024-022-00573-5 · Cited by 6
Self-citationMa, Q., Zhao, Z., Sagare, A. P., Wu, Y., Wang, M., Owens, N. C., Verghese, P. B., Herz, J., Holtzman, D. M., & Zloković, B. V. (2024) · Molecular Neurodegeneration · doi:10.1186/s13024-024-00716-w · Cited by 6
Self-citationBrain Pericytes — Crucial Regulators of Neuroinflammation in Ischemic Stroke
Chen, Z., Li, Q., Wang, K., Yang, L., Jia, Y., & Gong, Z. (2024) · Neuropharmacology and Therapy · doi:10.15212/npt-2024-0004 · Cited by 5
Bowirrat, A., Pinhasov, A., Bowirrat, A., & Badgaiyan, R. D. (2025) · International Journal of Molecular Sciences · doi:10.3390/ijms26178253 · Cited by 6
Li, W., Han, Y., Wang, P., & Qiao, S. (2025) · Alzheimer s & Dementia · doi:10.1002/alz.70803 · Cited by 6
Ved, A., Gajjar, T. B., Kakkad, A. D., Ganesan, S., Shankhyan, A., Jayabalan, K., Mishra, S., Jain, B., Arora, V., Gulati, M., et al. (2026) · Brain Sciences · doi:10.3390/brainsci16050434 · Cited by 5
Matsuura, H., Akahane, S., Kaido, T., Kamijo, T., Sakamoto, K., & Yamauchi, K. (2024) · FEBS Letters · doi:10.1002/1873-3468.14803 · Cited by 9
A Novel Perspective on PCSK9 in Alzheimer’s Disease: A Focus on Amyloid Beta
Zhang, H., Xu, Q. F., Zhao, Y., He, N., Ren, Z., Xiang, Q., Tang, Z., & Liu, L. (2024) · Current Medicinal Chemistry · doi:10.2174/0109298673269288231123095215 · Cited by 5
Bohannon, D. G., Long, D., Okhravi, H. R., Lee, S. C., Jesus, C. L. D., Neubert, T. A., Rostagno, A. A., Ghiso, J. A., & Kim, W. (2024) · Brain Pathology · doi:10.1111/bpa.13282 · Cited by 5
Amyloid Beta Dynamics in Biological Fluids—Therapeutic Impact
Schreiner, T. G., & Popescu, B. O. (2021) · Journal of Clinical Medicine · doi:10.3390/jcm10245986 · Cited by 5
The guardian of intracranial vessels: Why the pericyte?
Cen, K., Huang, Y., Xie, Y., & Liu, Y. (2024) · Biomedicine & Pharmacotherapy · doi:10.1016/j.biopha.2024.116870 · Cited by 5
Lee, S., Kim, S. E., Jang, H., Kim, J. P., Sohn, G., Park, Y. H., Ham, H., Gu, Y., Park, C. J., Kim, H. J., et al. (2024) · Alzheimer s Research & Therapy · doi:10.1186/s13195-024-01483-y · Cited by 5
A human blood-brain barrier model reveals pericytes as critical regulators of viral neuroinvasion
Richards, A. L., Khalil, A. S., Bisht, P., Whitfield, T. W., Gao, X., Kamm, R. D., Mooney, D., Gehrke, L., & Jaenisch, R. (2025) · iScience · doi:10.1016/j.isci.2025.114443 · Cited by 5
Unraveling APOE4's Role in Alzheimer's Disease: Pathologies and Therapeutic Strategies
Tripathi, S., Sharma, Y., & Kumar, D. (2024) · Current Protein and Peptide Science · doi:10.2174/0113892037326839241014054430 · Cited by 5
Zhou, J., Sun, X., Wang, K., Shen, M., Yu, J., Yao, Q., Hong, H. S., Tang, C., & Wang, Q. (2025) · Neuroscience Bulletin · doi:10.1007/s12264-025-01399-z · Cited by 4
Yao, M., Li, Z., Lin, Y., Cai, H., Sun, C., Liu, L., Long, Y., & Ge, Z. (2025) · Experimental Neurology · doi:10.1016/j.expneurol.2025.115534 · Cited by 4
Chmiela, T., Roemer, S. F., Strongosky, A. J., Baker, M., Dickson, D. W., & Wszolek, Z. K. (2026) · Movement Disorders · doi:10.1002/mds.70192 · Cited by 4
Lipoproteins and the Tumor Microenvironment
Dossou, A. S., Sabnis, N. A., Nagarajan, B., Mathew, E., Fudala, R., & Lacko, A. G. (2020) · Advances in experimental medicine and biology · doi:10.1007/978-3-030-48457-6_6 · Cited by 4
Gu, T., Ma, S., Liu, W., & Wang, L. (2025) · European Journal of Pharmacology · doi:10.1016/j.ejphar.2025.178310 · Cited by 3
Orthobiologics and Peptide Therapy for Central Nervous System Repair in Neurodegenerative Conditions
de Oliveira, C. A. A., Oliveira, B. S., de Oliveira, A. S., Loduca, R. D. D. S., Massella, C. R., & Santos, G. S. (2025) · Cells · doi:10.3390/cells14231853 · Cited by 3
Huang, B., & Tang, G. (2026) · Pathology - Research and Practice · doi:10.1016/j.prp.2026.156564 · Cited by 3
Yu, Z., Liu, X., Li, Q., Tuo, J., Tan, Q., Liu, Z., Yuan, Z., Zeng, R., Zhao, Y., Li, J., et al. (2025) · Aging Cell · doi:10.1111/acel.70205 · Cited by 3
Improving mouse models for the study of Alzheimer's disease
Reagan, A. M., Onos, K. D., Heuer, S. E., Sasner, M., & Howell, G. R. (2022) · Current topics in developmental biology/Current Topics in Developmental Biology · doi:10.1016/bs.ctdb.2021.12.005 · Cited by 5
Guo, Z., Zhang, C., Wang, X., Chen, W., & Guo, Z. (2025) · Brain and Behavior · doi:10.1002/brb3.70436 · Cited by 3
ApoE expression across the CNS: Who, What, Where, When, and How (much)?
Nolt, G. L., Lucido, C. C., Smith, L. M., & Johnson, L. A. (2026) · Molecular Neurodegeneration Advances · doi:10.1186/s44477-026-00028-x · Cited by 2
Motta, C., Bonomi, C., Poli, M., Mercuri, N., Martorana, A., & Chiaravalloti, A. (2025) · Applied Sciences · doi:10.3390/app15105677 · Cited by 1
Functions of the basal lamina and ApoE in cerebral amyloid angiopathy
Juan-Palencia, A., & Yao, Y. (2025) · Fluids and Barriers of the CNS · doi:10.1186/s12987-025-00734-w · Cited by 2
Yao, M., Liu, A., Song, J., Xing, L., Zi, M., & Li, H. (2026) · Neuroscience · doi:10.1016/j.neuroscience.2026.06.001 · Cited by 2
Peripheral markers of TBI and blood−brain barrier disruption
Washington, J., Murcko, R. M., & Janigro, D. (2020) · Elsevier eBooks · doi:10.1016/b978-0-12-816346-7.00004-x · Cited by 2
Beyond plaques and tangles: The role of immune cell dysfunction in Alzheimer's disease
Hussain, N., Khan, M. M., Sharma, A., Singh, R. K., & Khan, R. H. (2025) · Neurochemistry International · doi:10.1016/j.neuint.2025.105947 · Cited by 2
The Complex and Integral Roles of Pericytes Within the Neurovascular Unit in Health and Disease
Sutherland, B. A. (2021) · Stem cell biology and regenerative medicine · doi:10.1007/978-3-030-62129-2_2 · Cited by 2
Pepe, A., Arani, A. A., Bracone, F., Castelnuovo, A. F. D., Muñoz-Venegas, L., Cerletti, C., de Gaetano, G., Donati, M. B., Iacoviello, L., & Gialluisi, A. (2025) · Frontiers in Aging Neuroscience · doi:10.3389/fnagi.2025.1616303 · Cited by 2
Isolation of Pericytes from Mouse Cortical Tissue Using FACS for Single-cell Sequencing
Cui, X., Wu, Q., Zhang, S., Liu, X., Li, H., Yuan, X., Xu, A., & Xiu, R. (2026) · Journal of Visualized Experiments · doi:10.3791/69749 · Cited by 1
Binding of ApoE Isoforms to Aβ Peptides and Effects on Their Fibrillization
Friedemann, M., Noormägi, A., Jarvet, J., Gräslund, A., Wärmländer, S. K. T. S., Tõugu, V., & Palumaa, P. (2026) · ACS Omega · doi:10.1021/acsomega.5c12353 · Cited by 1
Bakker, N., Croes, A. A., Prevaes, E., Noorden, C. J. F. V., Schlingemann, R. O., & Klaassen, I. (2026) · Frontiers in Neuroscience · doi:10.3389/fnins.2026.1749112 · Cited by 1
Metabolic dysregulation in cerebral small vessel disease: pathogenesis and therapeutic targets
Si, Z., Xiao, B., & Zhang, M. (2026) · Neuroscience · doi:10.1016/j.neuroscience.2026.02.021 · Cited by 1
Nicole., F. E., Legrand, A.-F., Confort, M.-P., Ratinier, M., Mathieu, C., Lozach, P., & Arnaud, F. (2026) · Virulence · doi:10.1080/21505594.2026.2655047 · Cited by 1
Friend or foe? Glial–vascular interactions in health and neurodegenerative disease
McQuaid, C., Sewell, M. D. E., & Montagne, A. (2026) · Pharmacological Reviews · doi:10.1016/j.pharmr.2026.100143 · Cited by 1
Zhang, N., Chen, W. H., & Wang, M. (2026) · Animal Models and Experimental Medicine · doi:10.1002/ame2.70262 · Cited by 1
Self-citationIs amyloid beta peptide a driver of inflammaging?
Kechko, O. I., Moskalev, A. A., Franceschi, C., Mitkevich, V. A., & Makarov, A. А. (2026) · Ageing Research Reviews · doi:10.1016/j.arr.2026.103280 · Cited by 1
Imaging of enlarged perivascular spaces in Alzheimer’s disease with MRI techniques
Ma, W., Wang, X., & Wu, R. (2024) · Radiology Science · doi:10.15212/radsci-2024-0002 · Cited by 1
The Rise of Pluripotent Stem Cell-Derived Glia Models of Neuroinflammation
Kala, S., Strutz, A. G., & Katt, M. E. (2025) · Neurology International · doi:10.3390/neurolint17010006 · Cited by 2
Semaglutide Ameliorates Neuroinflammation Caused by Enterogenous Pyrogen in APP/PS1 MicePreprint
Yuan, Y., Zhang, J., Zhang, Z., Zhai, Y., Cheng, X., Xue, L., Zhao, F. L., Cao, L. H., & Wang, H. (2025) · Research Square · doi:10.21203/rs.3.rs-6098406/v1 · Cited by 1
Fortune, A. J., King, N. E., Gélinas-Marion, A., Moloney, R. A., Cashion, J. M., Burdon, K. P., Taylor, B. V., Sutherland, B. A., Fletcher, J. L., Blackburn, N. B., et al. (2025) · medRxiv · doi:10.1101/2025.07.15.25331537 · Cited by 1
Peri(vascular)cytes identity in the brain
Ceafalan, L. C., Mihai, S., & Popescu, D. I. (2021) · Journal of Cell Identity · doi:10.47570/joci.2022.004
Remote Ischemic Conditioning Alleviates Alzheimer’s Disease Pathology in Female TgF344 RatsPreprint
Ma, Y., Sun, W., Bai, J., Gao, F., Liu, H., Huang, Y., Hu, J., Xu, C., Ma, H., Yuan, T., et al. (2023) · Research Square · doi:10.21203/rs.3.rs-2779541/v1
Matsuura, H., Akahane, S., Kaido, T., Kamijo, T., Sakamoto, K., & Yamauchi, K. (2023) · Research Square · doi:10.21203/rs.3.rs-3292146/v1
Fábregas, C., Esteban-López, M., Fadó, R., Casals, N., Unzeta, M., Rodrı́guez-Álvarez, J., Miñano-Molina, A. J., & Solé, M. (2025) · bioRxiv (Cold Spring Harbor Laboratory) · doi:10.1101/2025.03.04.641410
Toxicology of the Brain Barrier System in Brain’s Health and Diseases
Liu, L. L., & Zheng, W. (2025) · Elsevier eBooks · doi:10.1016/b978-0-323-95488-4.00225-4
Kim, Y., Zhang, M., Bosworth, A., Julia, T. C. W., Nih, L. R., Kisler, K., Sagare, A. P., & Rust, R. (2025) · bioRxiv (Cold Spring Harbor Laboratory) · doi:10.1101/2025.04.10.648232
Self-citationResearch Progress on Pericytes in Central Nervous System Diseases
潘, 浩. (2025) · Advances in Clinical Medicine · doi:10.12677/acm.2025.1541306
He, Y., Li, J., Zhao, K., Shi, L., Zhou, H., Li, Y., Zhao, Q., Ya, J., & Wu, C. (2025) · Research Square · doi:10.21203/rs.3.rs-6395732/v1
Gastfriend, B. D., Palecek, S. P., & Shusta, E. V. (2025) · Neuromethods · doi:10.1007/978-1-0716-4474-4_2
In Silico Design of APOE ɛ4 Interaction Inhibitor Peptides for Alzheimer’s DiseasePreprint
Ji, J., Han, E., Park, J., Son, A., & Kim, H. (2025) · bioRxiv (Cold Spring Harbor Laboratory) · doi:10.1101/2025.09.03.673973
Mural Cells, Microvessels, and Alzheimer’s Disease
Bonney, S. K., Nielson, C. D., & Shih, A. Y. (2025) · Physiology in health and disease · doi:10.1007/978-3-031-99609-2_15
Function and Plasticity of Microvascular Pericytes
Suarez‐Martinez, A. D., Bruce, A. C., Castellanos-Sanchez, R., Comlekoglu, T., Csordas, D. J., DeCostanza, L., El‐Ghazawi, K., Leonard‐Duke, J., Peachey, C., Zhu, D., et al. (2025) · Physiology in health and disease · doi:10.1007/978-3-031-99609-2_5
Wang, Z., Veerareddy, V., Eberts, P. M., Azarin, S. M., & Kandimalla, K. K. (2025) · bioRxiv (Cold Spring Harbor Laboratory) · doi:10.1101/2025.11.24.690270
Chen, S., Guo, D., Zhu, Y., Xiao, S., Xie, J., Zhang, Z., Hu, Y., Huang, J., Ma, X., Ning, Z., et al. (2024) · Figshare · doi:10.6084/m9.figshare.25397542
Chen, S., Guo, D., Zhu, Y., Xiao, S., Xie, J., Zhang, Z., Hu, Y., Huang, J., Ma, X., Ning, Z., et al. (2024) · Figshare · doi:10.6084/m9.figshare.25397692
Chen, S., Guo, D., Zhu, Y., Xiao, S., Xie, J., Zhang, Z., Hu, Y., Huang, J., Ma, X., Ning, Z., et al. (2024) · Figshare · doi:10.6084/m9.figshare.26692306
Lv, X., Zhang, M., Cheng, Z., Wang, Q., Wang, P., Xie, Q., Ni, M., Shen, Y., Tang, Q., & Gao, F. (2023) · Figshare · doi:10.6084/m9.figshare.22620493
Li, Q., Li, B., Liu, L., Wang, K.-J., Liu, M.-Y., Deng, Y., Li, Z., Zhao, W.-D., Wu, L.-Y., Chen, Y.-H., et al. (2024) · Figshare · doi:10.6084/m9.figshare.26718999
Wang, J., Fan, D.-Y., Li, H.-Y., He, C.-Y., Shen, Y.-Y., Zeng, G.-H., Chen, D.-W., Yi, X., Ma, Y.-H., Yu, J.-T., et al. (2022) · Figshare · doi:10.6084/m9.figshare.18482235
Chen, S., Guo, D., Zhu, Y., Xiao, S., Xie, J., Zhang, Z., Hu, Y., Huang, J., Ma, X., Ning, Z., et al. (2024) · Figshare · doi:10.6084/m9.figshare.26692303
Xu, M., Li, Y., Luan, J., Yang, A., Zhu, L., Shu, N., Ouyang, G., Xue, Y., Zhang, L., & Ma, G. (2025) · Neurobiology of Disease · doi:10.1016/j.nbd.2025.107228
Li, L., Kong, J., Fan, R., Yuan, Y. Z., & Zhu, L. (2025) · Molecular Neurobiology · doi:10.1007/s12035-025-05603-z
Extracellular vesicle-derived mitochondrial genes as potential biomarkers for brain aging in human
Yu, Q., Yu, S., Chen, H., Cui, Z., Cheng, Q., Jin, Y., Zong, S., Wang, Y. L., Li, M., & Lu, Z. (2026) · The Journals of Gerontology Series A · doi:10.1093/gerona/glag044
Yang, H., Li, J., Zhao, K., Shi, L., Zhou, H., Li, Y., Zhao, Q., Ya, J., & Wu, C. (2026) · Brain Research Bulletin · doi:10.1016/j.brainresbull.2026.111819 · Cited by 1
Etude du neurotropisme de deux arbovirus émergents : les virus Zika et Usutu
Clé, M. (2020) · theses.fr (ABES) · doi:10.70675/efbddf1cz1416z4c8fzab5ez8b28a309cc06
Tsai, S., Liew, H., Wang, M.-J., Hung, W.-T., & Huang, H.-Y. (2026) · Tzu Chi Medical Journal · doi:10.4103/tcmj.tcmj-d-25-00173
Self-citationMorimoto, S., Takahashi, S., & Okano, H. (2026) · Japanese Journal of Radiology · doi:10.1007/s11604-026-02000-x
Rediscovery of pericytes within the neurovascular unit for cerebral ischemia/reperfusion injury
Su, S., Liang, L., Gan, L., & Yu, C. (2026) · Neurological Sciences · doi:10.1007/s10072-026-09093-2 · Cited by 1
The bidirectional mechanistic links between Alzheimer’s disease and cardiovascular disease
You, J., & Yang, J. (2026) · Neurological Sciences · doi:10.1007/s10072-026-09151-9
Kaur, A., Murthy, S., Bharath Kumar, D. R., Gokulakrishnan, S., Philantharopa, U. P. B., & Narajji, C. (2026) · Elsevier eBooks · doi:10.1016/b978-0-443-40563-1.00010-7
Wu, Y., Zhang, C., Yan, J., Lin, L., Tian, Y., Fu, Z., & Sun, X. (2026) · Frontiers in Aging Neuroscience · doi:10.3389/fnagi.2026.1832525
Self-citationWang, J., Cao, X., & Wan, M. (2026) · Journal of Clinical Investigation · doi:10.1172/jci207273
Lv, C., Luo, Q., Jin, F., Shao, Q., Qiu, Y., Junjun, N., Liu, J., Qing, H., & Quan, Z. (2026) · Journal of Alzheimer s Disease · doi:10.1177/13872877261497235
Metadata
- Authors
- Ma, Q., Zhao, Z., Sagare, A. P., Wu, Y., Wang, M., Owens, N. C., Verghese, P. B., Herz, J., Holtzman, D. M., & Zlokovic, B. V.
- Affiliations
- University of Southern California (US)
- C2N Diagnostics (United States) (US)
- The University of Texas Southwestern Medical Center (US)
- Washington University in St. Louis (US)
- Venue
- Molecular Neurodegeneration
- Published
- 2018-10-19
- Volume
- 13
- Issue
- 1
- Pages
- 57-57
- ISSN
- 1750-1326 (ISSN-L)
- PMC
- PMC6194676
- OpenAlex
- W2897433925
- Cited by
- 281
- References
- 71
- Citations by year
- 2026: 24 · 2025: 54 · 2024: 40 · 2023: 41 · 2022: 35 · 2021: 30 · 2020: 36 · 2019: 21
- FWCI
- 14.91
- Type
- journal article
- Language
- en
- Update notices
- Open access
- gold
- doi.org
- Locations
- Molecular Neurodegeneration (publishedVersion, cc-by)
- Europe PMC (PubMed Central) (publishedVersion, other-oa)
- PubMed Central (publishedVersion, cc-by)
- PubMed (publishedVersion)
- Digital Commons@Becker (Washington University School of Medicine) (submittedVersion, cc-by)
- The Scholars Repository - LLU (Loma Linda University) (submittedVersion)
- DOAJ (DOAJ: Directory of Open Access Journals) (submittedVersion, cc-by-sa)
- Funders
- National Institutes of Health (R01NS034467, R01AG023084, R01AG039452)
- Topics
- Life Sciences › Neuroscience › Cellular and Molecular Neuroscience › Alzheimer's disease research and treatments
- Life Sciences › Neuroscience › Neurology › Barrier Structure and Function Studies
- Health Sciences › Medicine › Clinical Neurology › Cerebrospinal fluid and hydrocephalus
- Keywords
- blood-brain barrier, amyloid-beta 42, LRP1, apolipoprotein E isoforms, APOE3, APOE ε4, Alzheimer's disease, amyloid-beta clearance, receptor-mediated uptake, pericyte dysfunction, APP overexpression
- MeSH terms
- Animals, Apolipoproteins E, Biological Transport, Blood-Brain Barrier, Brain, Humans, Mice, Transgenic, Peptide Fragments, Receptors, LDL, Amyloid beta-Peptides, Pericytes, Tumor Suppressor Proteins, Low Density Lipoprotein Receptor-Related Protein-1
About these checks
Registry, retraction, Cites and statistics results are computed, not judged, with one exception: a printed reference that no index lists is read once by a model before it counts as a citation error. Claims are extracted by a model and kept only when their quote appears verbatim in the text; each cited source is then checked, with a model’s help, for whether it says what the claim relies on. Those verdicts can be wrong — read the claim’s quote and the cited source before relying on one.
Statistics and arithmetic are recomputed, not judged.
Confidence bands are shown only for fields calibrated on our annotated test set. None is calibrated yet, so no band is shown.
What counts as a claim ›How we measure confidence ›How we check this ›
Are you an author, or do you see a problem with this page? Request a review
