

The DOI matches its Crossref record; 83 of the 83 references it cites were found in a registry or an index.
Comprehensive metabolic profiling of Parkinson’s disease by liquid chromatography-mass spectrometry
Open accessAbstract
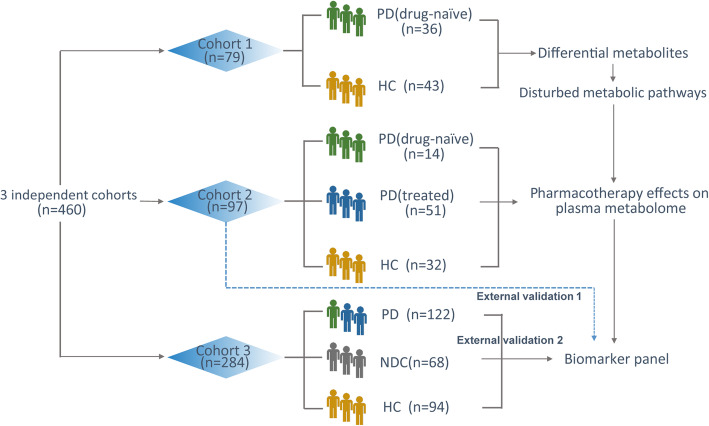
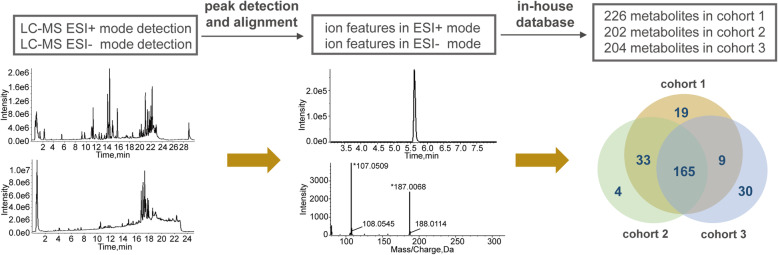
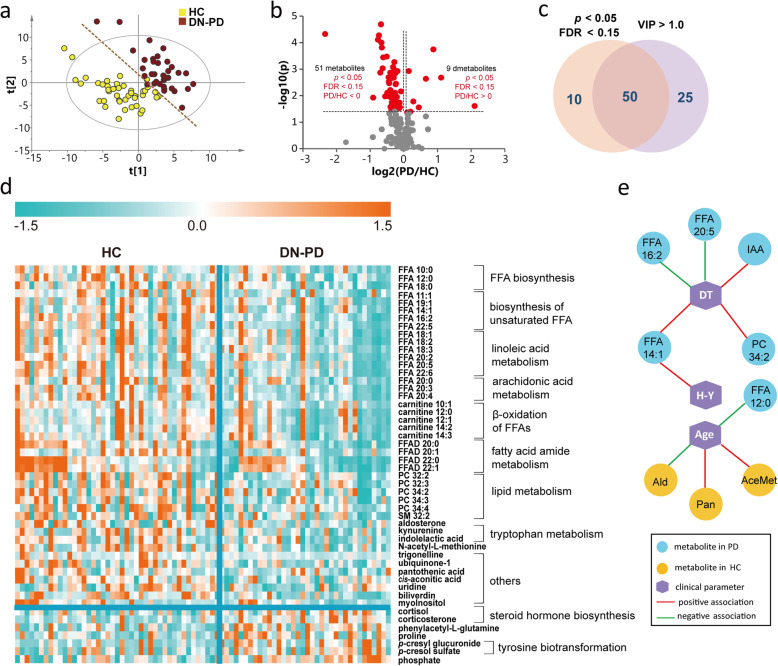
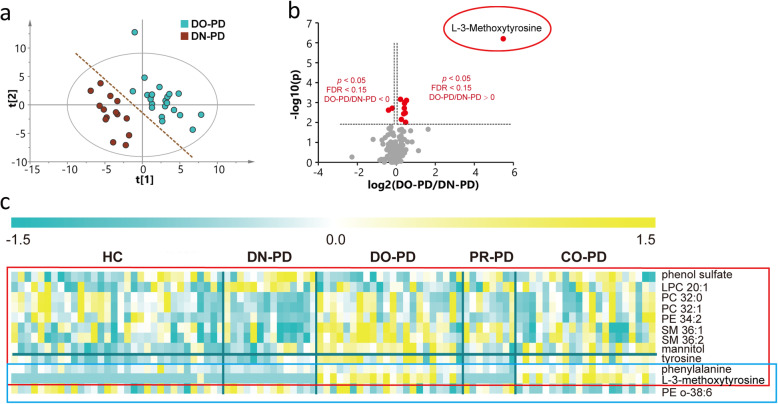
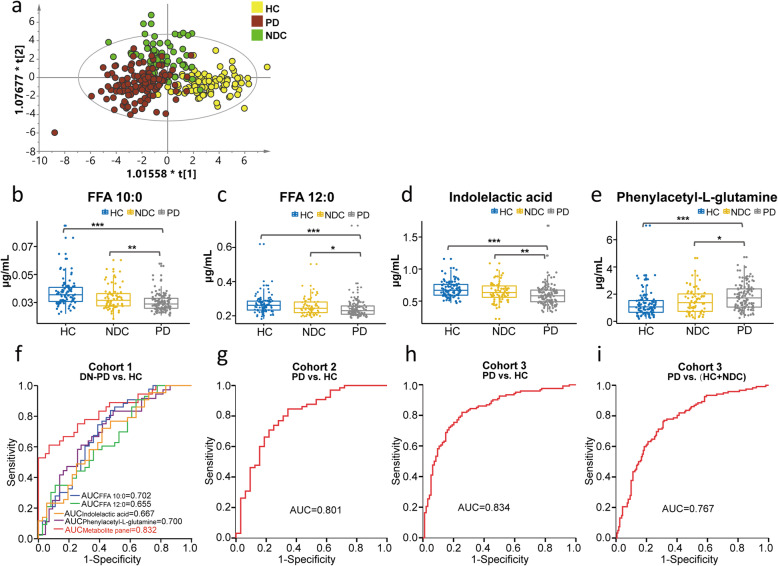
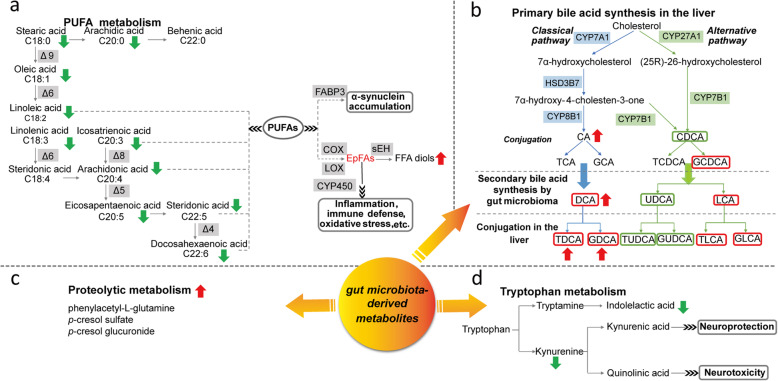
Background: Parkinson’s disease (PD) is a prevalent neurological disease in the elderly with increasing morbidity and mortality. Despite enormous efforts, rapid and accurate diagnosis of PD is still compromised. Metabolomics defines the final readout of genome-environment interactions through the analysis of the entire metabolic profile in biological matrices. Recently, unbiased metabolic profiling of human sample has been initiated to identify novel PD metabolic biomarkers and dysfunctional metabolic pathways, however, it remains a challenge to define reliable biomarker(s) for clinical use. Methods: We presented a comprehensive metabolic evaluation for identifying crucial metabolic disturbances in PD using liquid chromatography-high resolution mass spectrometry-based metabolomics approach. Plasma samples from 3 independent cohorts (n = 460, 223 PD, 169 healthy controls (HCs) and 68 PD-unrelated neurological disease controls) were collected for the characterization of metabolic changes resulted from PD, antiparkinsonian treatment and potential interferences of other diseases. Unbiased multivariate and univariate analyses were performed to determine the most promising metabolic signatures from all metabolomic datasets. Multiple linear regressions were applied to investigate the associations of metabolites with age, duration time and stage of PD. The combinational biomarker model established by binary logistic regression analysis was validated by 3 cohorts. Results: A list of metabolites including amino acids, acylcarnitines, organic acids, steroids, amides, and lipids from human plasma of 3 cohorts were identified. Compared with HC, we observed significant reductions of fatty acids (FFAs) and caffeine metabolites, elevations of bile acids and microbiota-derived deleterious metabolites, and alterations in steroid hormones in drug-naïve PD. Additionally, we found that L-dopa treatment could affect plasma metabolome involved in phenylalanine and tyrosine metabolism and alleviate the elevations of bile acids in PD. Finally, a metabolite panel of 4 biomarker candidates, including FFA 10:0, FFA 12:0, indolelactic acid and phenylacetyl-glutamine was identified based on comprehensive discovery and validation workflow. This panel showed favorable discriminating power for PD. Conclusions: This study may help improve our understanding of PD etiopathogenesis and facilitate target screening for therapeutic intervention. The metabolite panel identified in this study may provide novel approach for the clinical diagnosis of PD in the future.
Overview
The claims and statistics of this paper haven’t been checked yet.
Run the check — free, no account needed. It reads the open-access text and checks the sources it cites.
Integrity signals
Registry
Cites
Statistics
Figures
Verification
Claims the paper makes
The claims and statistics of this paper haven’t been checked yet.
Run the check — free, no account needed. It reads the open-access text and checks the sources it cites.
Claims other papers make about this one
Each is checked against this paper’s own text: does it say what the citing paper says it does?
In the citing paper
“Moreover, PD patients exhibited reduced plasma levels of neuroprotective BAs, namely UDCA and TUDCA.379”
From Microbiota–gut–brain axis and its therapeutic applications in neurodegenerative diseases (2024) · cites this paper as [379]
In the citing paper
“However, another study reported increased levels of glycine- and taurine-conjugated primary BAs in plasma samples of PD patients.379”
From Microbiota–gut–brain axis and its therapeutic applications in neurodegenerative diseases (2024) · cites this paper as [379]
In the citing paper
“An elevated level of primary BA (cholic acid) was identified in the plasma of PD patients.379,380”
From Microbiota–gut–brain axis and its therapeutic applications in neurodegenerative diseases (2024) · cites this paper as [379]
In the citing paper
“Studies have revealed elevated levels of secondary BAs in PD patients, while findings regarding primary BAs have yielded varying results.377–380”
From Microbiota–gut–brain axis and its therapeutic applications in neurodegenerative diseases (2024) · cites this paper as [379]
Self-check
Percentages, sums and reported differences re-computed from the paper’s own numbers.
The self-check needs the paper’s full text.
Citations
Cites
Controlling the False Discovery Rate: A Practical and Powerful Approach to Multiple Testing
Benjamini, Y., & Hochberg, Y. (1995) · Journal of the Royal Statistical Society Series B: Statistical Methodology · doi:10.1111/j.2517-6161.1995.tb02031.x · Cited by 109,482
MDS clinical diagnostic criteria for Parkinson’s disease
Postuma, R. B., Berg, D., Stern, M., Poewe, W., Olanow, C. W., Oertel, W., Obeso, J., Marek, K., Litvan, I., Lang, A. E., et al. (2015) · Movement Disorders · doi:10.1002/mds.26424 · Cited by 7,653
Epidemiology of Parkinson's disease
de Lau, L. M., & Breteler, M. M. (2006) · The Lancet Neurology · doi:10.1016/s1474-4422(06)70471-9 · Cited by 4,110
Goetz, C. G., Poewe, W. H., Rascol, O., Sampaio, C., Stebbins, G. T., Counsell, C. E., Giladi, N., Holloway, R. G., Moore, C. G., Wenning, G. K., et al. (2004) · Movement Disorders · doi:10.1002/mds.20213 · Cited by 2,488
Epidemiology of Parkinson’s disease
Tysnes, O., & Storstein, A. M. (2017) · Journal of Neural Transmission · doi:10.1007/s00702-017-1686-y · Cited by 2,437
Microbial tryptophan catabolites in health and disease
Roager, H. M., & Licht, T. R. (2018) · Nature Communications · doi:10.1038/s41467-018-05470-4 · Cited by 2,236
Cellular Fatty Acid Metabolism and Cancer
Currie, E., Schulze, A., Zechner, R., Walther, T. C., & Farese, R. V. (2013) · Cell Metabolism · doi:10.1016/j.cmet.2013.05.017 · Cited by 2,123
Gut microbiota are related to Parkinson's disease and clinical phenotype
Scheperjans, F., Aho, V., Pereira, P. A. B., Koskinen, K., Paulin, L., Pekkonen, E., Haapaniemi, E., Kaakkola, S., Eerola‐Rautio, J., Pohja, M., et al. (2015) · Movement Disorders · doi:10.1002/mds.26069 · Cited by 1,968
The epidemiology of Parkinson's disease: risk factors and prevention
Ascherio, A., & Schwarzschild, M. A. (2016) · The Lancet Neurology · doi:10.1016/s1474-4422(16)30230-7 · Cited by 1,930
A gut bacterial pathway metabolizes aromatic amino acids into nine circulating metabolites
Dodd, D., Spitzer, M. H., Van Treuren, W., Merrill, B. D., Hryckowian, A. J., Higginbottom, S. K., Le, A., Cowan, T. M., Nolan, G. P., Fischbach, M. A., et al. (2017) · Nature · doi:10.1038/nature24661 · Cited by 1,425
Cited by
Sorted by citations
Items 101–200 of 226
Butalewicz, J. P., & Brodbelt, J. S. (2025) · Journal of the American Society for Mass Spectrometry · doi:10.1021/jasms.5c00222 · Cited by 10
Stolaki, E. V., Psatha, K., & Aivaliotis, M. (2025) · Metabolites · doi:10.3390/metabo15110750 · Cited by 9
Huh, E., Choi, J. G., Lee, M. Y., Kim, J. H., Choi, Y., Ju, I. G., Eo, H., Park, M. G., Kim, D.-H., Park, H., et al. (2023) · Frontiers in Molecular Neuroscience · doi:10.3389/fnmol.2023.1201073 · Cited by 8
Balck, A., Borsche, M., Campbell, P., Luo, X., Harvey, J., Brückmann, T., Ludwig, C., Harms, A. C., Lohmann, K., Brown, E. E., et al. (2025) · Science Advances · doi:10.1126/sciadv.adp7063 · Cited by 8
Shao, Y., Wang, J., Liu, Y., Ni, Y., Liu, Z., Li, Y., Jia, Q., Li, Q., Wang, X., Li, T., et al. (2026) · Signal Transduction and Targeted Therapy · doi:10.1038/s41392-026-02613-8 · Cited by 9
Self-citationChen, X., Wei, J., Li, Z., Zhang, Y., Zhang, X., Zhang, L., Wang, X., Zhang, Y., & Zhang, T. (2024) · Annals of Neurology · doi:10.1002/ana.26963 · Cited by 7
Self-citationLee, S., Kim, J. H., Baek, J. W., Jung, K.-Y., Lee, Y., Koh, A., & Kim, H. (2025) · npj Parkinson s Disease · doi:10.1038/s41531-025-01040-w · Cited by 10
Hui, F. K., Ghozy, S. A., Amans, M. R., Brinjikji, W., Abdalkader, M. K., Yedavalli, V. S., Chyung, A. S. C., Pereira, V. M., Lenck, S., Siddiqui, A. H., et al. (2025) · Journal of NeuroInterventional Surgery · doi:10.1136/jnis-2025-023392 · Cited by 7
Pleiotropic immunoregulation by bile acids in pathophysiology
Lin, B.-S., Yin, M., Xie, S.-A., Li, P., & Li, X. (2026) · Frontiers in Immunology · doi:10.3389/fimmu.2026.1719092 · Cited by 8
Luxenburger, A., Clemmens, H., Hastings, C., Harris, L. D., Ure, E. M., Cameron, S. A., Aasly, J. O., Bandmann, O., Weymouth‐Wilson, A., Furneaux, R. H., et al. (2022) · Biomolecules · doi:10.3390/biom13010076 · Cited by 7
Tiwari, V., & Shukla, S. (2023) · Frontiers in Genetics · doi:10.3389/fgene.2023.1057068 · Cited by 9
Zhu, L.-N., Chen, D., & He, C. (2024) · Heliyon · doi:10.1016/j.heliyon.2024.e26540 · Cited by 7
Alterations in Cerebrospinal Fluid Urea Occur in Late Manifest Huntington’s Disease
Pfalzer, A. C., Shiino, S., Silverman, J., Codreanu, S. G., Sherrod, S. D., MCLEAN, J. A. J., & Claassen, D. O. (2024) · Journal of Huntington s Disease · doi:10.3233/jhd-231511 · Cited by 7
Metabolism and metabolomics in senescence, aging, and age-related diseases: a multiscale perspective
Wang, Z., Zhu, H., & Xiong, W. (2025) · Frontiers of Medicine · doi:10.1007/s11684-024-1116-0 · Cited by 7
The role of the gut microbiome in Parkinson’s disease
Metcalfe‐Roach, A., & Finlay, B. B. (2025) · Future Neurology · doi:10.1080/14796708.2025.2494981 · Cited by 6
Chen, H., Cheng, X., Pan, X., Yu, Y., Chen, L., Fu, Y., & Pan, X. (2025) · Frontiers in Neurology · doi:10.3389/fneur.2025.1608031 · Cited by 6
The quest for Parkinson’s disease biomarkers: traditional and emerging multi-omics approaches
Sharma, P., & Dhamija, R. K. (2025) · Molecular Biology Reports · doi:10.1007/s11033-025-10929-x · Cited by 7
Li, S.-T., Che, J., Gu, B.-B., Li, Y., Han, X., Sun, T., Pan, K., Lv, J., Zhang, S., Wang, C., et al. (2024) · Journal of Proteome Research · doi:10.1021/acs.jproteome.3c00827 · Cited by 6
Self-citationVacy, K., Rupasinghe, T., Bjorksten, A., Gogos, A., Meikle, P. J., Burugupalli, S., Boon, W. C., & Ponsonby, A. (2025) · Reproductive Toxicology · doi:10.1016/j.reprotox.2025.108835 · Cited by 6
Micro- and nanoscale biosensing technologies for early diagnosis of Parkinson’s disease
Nikam, T., Rana, A., Saraf, S. A., & Awasthi, S. (2025) · Microchimica Acta · doi:10.1007/s00604-025-07505-2 · Cited by 5
Gao, J.-M., Xia, S.-Y., Hide, G., Li, B.-H., Liu, Y.-Y., Wei, Z.-Y., Zhuang, X.-J., Yan, Q., Wang, Y., Yang, W., et al. (2024) · npj Biofilms and Microbiomes · doi:10.1038/s41522-024-00535-3 · Cited by 5
Lu, Y., Zhang, Y., Zeng, L., Yan, B., Li, X., Zhou, B., Xu, Z., & He, Q. (2024) · Microchemical Journal · doi:10.1016/j.microc.2024.112381 · Cited by 5
Bertarini, L., Imbeni, F., Vilella, A., Alboni, S., & Pellati, F. (2025) · ACS Chemical Neuroscience · doi:10.1021/acschemneuro.4c00698 · Cited by 5
Local burn wound environment versus systemic response: Comparison of proteins and metabolites
Zang, T., Heath, K., Etican, J., Chen, L., Langley, D., Holland, A. J. A., Martin, L. J., Fear, M. W., Parker, T. J., Kimble, R. M., et al. (2022) · Wound Repair and Regeneration · doi:10.1111/wrr.13042 · Cited by 5
Wang, Y., Lv, B., Fan, K., Su, C., Xu, D., & Pan, J. (2024) · Neuropsychiatric Disease and Treatment · doi:10.2147/ndt.s471744 · Cited by 5
Pham, T., Schelling, R. E., & Loh, K. H. (2025) · Advances in genetics · doi:10.1016/bs.adgen.2025.02.001 · Cited by 5
Gervasoni, J., Maio, A. D., Serra, M., Cicchinelli, M., Santucci, L., Ciasca, G., Nuzzo, T., (36669), Q. L., Thiolat, M.-L., Morelli, M., et al. (2026) · npj Parkinson s Disease · doi:10.1038/s41531-026-01306-x · Cited by 5
Serum metabolomics analysis revealed metabolic disorders in Parkinson’s disease
Lan, T.-T., Chang, L., Hou, L.-W., Wang, Z., Li, D.-C., Ren, Z.-H., Gu, T., Wang, J., & Chen, G.-S. (2023) · Medicine · doi:10.1097/md.0000000000033715 · Cited by 5
Cannas, F., Kopeć, K. K., Zuddas, N., Marincola, F. C., Arcara, G., Loi, M., Mussap, M., & Fanos, V. (2025) · Journal of Clinical Medicine · doi:10.3390/jcm14176277 · Cited by 4
Bile acids as therapeutic agents
Vu, B., Kawamoto, R., Villalba‐Davila, P., Dong, X., & Karnsakul, W. W. (2026) · Frontiers in Pharmacology · doi:10.3389/fphar.2025.1732854 · Cited by 5
Liu, C., Wang, C., Jiang, J., Yang, B. K., Nan, L., Zhang, Y., Zhu, K., Wang, X., Feng, X., Lian, X., et al. (2025) · Frontiers in Aging Neuroscience · doi:10.3389/fnagi.2024.1436171 · Cited by 4
Self-citationFredriksen, T. R., Holbrook, J. H., Rosas, L., Angeles-López, Q. D., Mora, A. L., Rojas, M. M., & Hummon, A. B. (2025) · Analytical Chemistry · doi:10.1021/acs.analchem.4c05629 · Cited by 4
Liu, S., Zhao, Q., Tang, J., Li, X., Wang, J., Zhao, Y., Yang, Z., Pan, X., Xiang, R. H., Tian, J., et al. (2025) · CNS Neuroscience & Therapeutics · doi:10.1111/cns.70424 · Cited by 4
The role of metabolomics in stroke: biomarkers of diagnosis and therapy
Wang, Y., Tian, Q., & Li, M. (2025) · Metabolic Brain Disease · doi:10.1007/s11011-025-01742-3 · Cited by 4
Failure of diet-induced transcriptional adaptations in alpha-synuclein transgenic mice
Kilzheimer, A., Hentrich, T., Rotermund, C., Kahle, P. J., & Schulze-Hentrich, J. M. (2022) · Human Molecular Genetics · doi:10.1093/hmg/ddac205 · Cited by 5
Odongo, R., Bellur, O., Abdi̇k, E., & Çakır, T. (2023) · Molecular Omics · doi:10.1039/d2mo00343k · Cited by 4
Chen, J., Wang, H., Gao, H., & Zeng, Y. (2023) · PLoS ONE · doi:10.1371/journal.pone.0273034 · Cited by 4
ML-based clinical decision support models based on metabolomics data
Burdukiewicz, M., Chilimoniuk, J., Grzesiak, K., Kretowski, A. J., & Ciborowski, M. (2024) · TrAC Trends in Analytical Chemistry · doi:10.1016/j.trac.2024.117819 · Cited by 4
Impaired Arginine Metabolism in Hair Follicles: A Potential Mechanism in Androgenetic AlopeciaPreprint
Li, J., duan, X., Fan, C., Guo, L., Deng, Z., Li, Y., Zhang, J., Liu, F., Li, Y., wu, Z., et al. (2023) · Research Square · doi:10.21203/rs.3.rs-3629594/v1 · Cited by 4
Wang, D., Yu, H., Qu, Y., An, K., Liang, H., Mao, Z., Li, J., Xiong, Y., Min, Z., & Xue, Z. (2025) · International Journal of Molecular Sciences · doi:10.3390/ijms26020550 · Cited by 3
Li, M., Xiong, F., Wu, S., Wei, W., Wang, H., Qiao, Y., & Guo, D. (2025) · International Journal of Molecular Sciences · doi:10.3390/ijms26020544 · Cited by 3
Plasma Phenylacetylglutamine and Cognitive Impairment After Ischemic Stroke
Fei, J., Chang, X., Yang, W., He, Y., Liu, Y., Shi, M., Liu, Y., Wang, X., Peng, H. Y., Bu, X., et al. (2025) · Journal of the American Heart Association · doi:10.1161/jaha.125.042955 · Cited by 3
Self-citationFigliomeni, A., Winter, S. J., Abonnel, M. Y., Kenna, J. E., Lodge, S., Whiley, L., Bernal, A., Coudert, J. D., Noonan, J. E., Kaskow, B. J., et al. (2025) · npj Parkinson s Disease · doi:10.1038/s41531-025-01212-8 · Cited by 3
Chi, F., Chen, K., Yin, Y., Hakovirta, J. R., & Saris, P. E. J. (2026) · Sustainable Microbiology · doi:10.1093/sumbio/qvag002 · Cited by 5
Mapping the causal chain from genetic risk variants to lipid dysmetabolism in Parkinson’s disease
De-Paula, R. B., Kim, J., Rhinn, H., Saade, H., Chavez, F., Segura, T., Lozano, M. V., Etoundi, M., Silos, K., Kass, N. R., et al. (2026) · Brain · doi:10.1093/brain/awag039 · Cited by 4
Wang, C., Tang, Y., Yang, T., Wang, Y., Niu, Z., Zhang, K., Lin, N., & Li, Q. (2025) · European Journal of Neuroscience · doi:10.1111/ejn.16665 · Cited by 4
Expanding our understanding of synucleinopathies: proteinopathy, proteinopenia, and lipidopathy
Flores‐León, M., & Outeiro, T. F. (2025) · FEBS Journal · doi:10.1111/febs.70011 · Cited by 3
Research progress on natural products in regulating the gut microbiota in Parkinson’s disease
Jia, Y., Zhang, Y., Tai, X., Zhao, T., Zhang, H., & Zhou, H. (2025) · Frontiers in Pharmacology · doi:10.3389/fphar.2025.1667694 · Cited by 4
Xu, H., Yang, N., Wang, B., Zhou, L., Xu, L., Chen, Y., Wang, D., & Ge, W. (2023) · Environmental Toxicology · doi:10.1002/tox.24063 · Cited by 3
RetractedMetabolic Profiling of Aromatic Compounds
Pautova, A. K. (2024) · Metabolites · doi:10.3390/metabo14020107 · Cited by 3
Si, J., Gao, Y., Yan, B., Shen, X., Zhu, C., & Yao, Q. (2024) · Advanced Sensor and Energy Materials · doi:10.1016/j.asems.2024.100101 · Cited by 3
Koníčková, D., Menšíková, K., Plíhalová, L., & Kaňovský, P. (2024) · Nutrition Research Reviews · doi:10.1017/s0954422424000349 · Cited by 3
Wu, Z., Dai, J., Lv, B., Su, C., & Xu, D. (2025) · IBRO Neuroscience Reports · doi:10.1016/j.ibneur.2025.08.017 · Cited by 3
Balck, A., Borsche, M., Campbell, P., Luo, X., Harvey, J., Brückmann, T., Ludwig, C., Harms, A. C., Lohmann, K., Morris, H. R., et al. (2024) · medRxiv · doi:10.1101/2024.03.01.24303613 · Cited by 3
Gender-associated differences in serum metabolite profiles among patients with Parkinson’s DiseasePreprint
Marino, C., Carrillo, F., Nuzzo, T., Vidali, M., Serra, M., Pietracupa, S., Modugno, N., Grimaldi, M., D’Ursi, A. M., Errico, F., et al. (2025) · medRxiv · doi:10.1101/2025.10.30.25339159 · Cited by 3
Multiscale metabolomics techniques: Insights into neuroscience research
Wang, X., Peng, R., & Zhao, L. (2024) · Neurobiology of Disease · doi:10.1016/j.nbd.2024.106541 · Cited by 2
Self-citationHan, J., & Wang, Q. (2025) · Biochemical and Biophysical Research Communications · doi:10.1016/j.bbrc.2025.152470 · Cited by 2
Bidirectional Causal Associations Between Plasma Metabolites and Parkinson’s Disease
Zhao, M., Li, T., Shen, H., Baranova, A. V., Chandhoke, V., & Zhang, F. (2025) · Molecular Neurobiology · doi:10.1007/s12035-025-05306-5 · Cited by 2
Self-citationShen, T., Cui, C., Liu, R., Yin, X., Zu, J., Zhang, W., Dong, L., Xu, C., Lu, H., Cui, G., et al. (2025) · npj Parkinson s Disease · doi:10.1038/s41531-025-01229-z · Cited by 2
Azorín, C., Fernandes, S. R., Barreiros, L., Benedé, J. L., Chisvert, A., & Segundo, M. A. (2026) · Analytical and Bioanalytical Chemistry · doi:10.1007/s00216-026-06391-8 · Cited by 2
Castegna, A., Laera, L., Moda, P., Miglietta, S., D’Agostino, M., Ruggiero, M., Cianciulli, A., Filannino, F. M., Porro, C., Butterfield, D. A., et al. (2026) · Journal of Translational Medicine · doi:10.1186/s12967-026-08102-4 · Cited by 3
Metabolomic signatures for diagnosis and clinical severity in Parkinson's disease
Wang, Y., Xiang, Y., Huang, X., Li, L., Li, T., Zhang, X., Hu, Y., Liu, J., Liu, Z., Sun, Q., et al. (2026) · EBioMedicine · doi:10.1016/j.ebiom.2026.106383 · Cited by 2
Self-citationLi, X., Gao, Y. J., Li, B., Zhao, W., Cai, Q., Yin, W., Zeng, S., Li, X., Gao, H., & Cheng, M. (2023) · Frontiers in Molecular Neuroscience · doi:10.3389/fnmol.2023.1251513 · Cited by 2
Li, X., Tong, B., Zhu, X., Chi, Y., Jiang, Z., Jian, X., Wu, Y., Lv, T., Wang, L., Shi, X., et al. (2024) · Arabian Journal of Chemistry · doi:10.1016/j.arabjc.2024.105920 · Cited by 2
Predtechenskaya, E. V., Rogachev, A. D., & Melnikova, P. M. (2024) · Acta Naturae · doi:10.32607/actanaturae.27511 · Cited by 2
Park, H.-M., Kabanga, E. K., Moon, D., Chung, M., Im, J., Kim, Y., Messem, A. V., & Neve, W. D. (2023) · bioRxiv (Cold Spring Harbor Laboratory) · doi:10.1101/2023.05.18.541380 · Cited by 2
Fleming, R. M. T., Luo, X., Liu, Y., Balck, A., & Klein, C. (2023) · Research Square · doi:10.21203/rs.3.rs-3209421/v1 · Cited by 2
Lee, S., Kim, J. H., Baek, J., Jung, K., Lee, Y., Koh, A., & Kim, H. (2024) · bioRxiv (Cold Spring Harbor Laboratory) · doi:10.1101/2024.05.02.592293 · Cited by 2
Kumar, R., Beric, A., Western, D., Yang, Z., Lin, W., Timsina, J., Cruchaga, C., & Ibáñez, L. (2025) · medRxiv · doi:10.1101/2025.09.25.25336658 · Cited by 2
Sánchez-Camacho, J. V., Gómez-Chavarı́n, M., Galindo-Solano, N., Padilla-Cortés, P., Maldonado-García, J. L., Pérez‐Sánchez, G., Pavón, L., Ramírez‐Santos, J., Roldán-Roldán, G., Gómez‐López, M., et al. (2024) · International Journal of Molecular Sciences · doi:10.3390/ijms252312635 · Cited by 1
Zhang, L., Li, D., Xu, Z. Q., Wu, M., Yao, Q., Chen, H., Ye, Z., & Yuan, B. (2025) · Frontiers in Genetics · doi:10.3389/fgene.2025.1526018 · Cited by 1
Xu, H., Shao, Y., Zhang, J., Ni, Y., Xu, G., Liu, C., Liang, Y., & Le, W. (2025) · Neuroscience Bulletin · doi:10.1007/s12264-025-01487-0 · Cited by 1
Self-citationReddy, V. L., Chen, Z., Dewain, S., Joo, M., Bellomo, M., Renkl, E., Sapna Patel, M. C., Rivera, E., Weisbein, L., Ali, A., et al. (2025) · npj Parkinson s Disease · doi:10.1038/s41531-025-01051-7 · Cited by 1
Xu, S., Li, Y., Xiang, H., Sun, Y., & Zhang, J. (2025) · Journal of Hazardous Materials · doi:10.1016/j.jhazmat.2025.140067 · Cited by 1
Wang, Y., Xia, Z., Jia, L., Zhang, K., Wei, P., & Han, G. (2025) · Experimental Eye Research · doi:10.1016/j.exer.2025.110749 · Cited by 1
Plasma metabolites as biomarkers for screening and differential diagnosis of lung cancer
Liu, Z., Wang, L., Gao, S., Xue, Q., Tan, F., & Gao, Y. (2025) · Journal of Cardiothoracic Surgery · doi:10.1186/s13019-025-03719-w · Cited by 1
Self-citationQian, S., Hou, J., Xiong, X., Duan, Q., Jiang, T., Zheng, Y., Quan, W., Xu, J., Chen, K., Wang, W., et al. (2026) · CNS Neuroscience & Therapeutics · doi:10.1002/cns.70750 · Cited by 1
Pantothenic Acid and Parkinson Disease: A Systematic Review of Metabolomics Analysis Studies
Kheirouri, S., & Alizadeh, M. (2026) · Nutrition Reviews · doi:10.1093/nutrit/nuaf232 · Cited by 1
Cerebrospinal fluid and plasma metabolites in Parkinson’s disease: a Mendelian randomization study
Wang, J.-L., Zhao, Q., Zheng, R., Fang, Y., Cao, J., & Zhang, B.-R. (2026) · Scientific Reports · doi:10.1038/s41598-025-30521-4 · Cited by 1
Jin, H., Meng, L., Yuluğ, B., Altay, Ö., Li, X., Çankaya, Ş., Hanoğlu, L., Ji, B., Coşkun, E., İdil, E., et al. (2026) · Neurobiology of Disease · doi:10.1016/j.nbd.2026.107424 · Cited by 1
Hang, Q., Yuan, Y., Song, Z., Zhang, M., Mao, C., Xie, H., Qin, F., & Xiong, Z. (2026) · Analytical Chemistry · doi:10.1021/acs.analchem.5c08120 · Cited by 2
Xian, W., Huang, W., Li, C., Tang, Z.-F., Chen, X., Luo, X., Zhang, K.-D., Chen, L., Hu, S., He, W.-J., et al. (2026) · Analytical Chemistry · doi:10.1021/acs.analchem.6c00422 · Cited by 1
A bibliometric and text-mining analysis of lipidomics and metabolomics in human disease
Trejo-Castro, A. I., Marín‐Obispo, L. M., Carrión-Álvarez, D., Mora‐Godínez, S., Martínez‐Torteya, A., Hernández‐Brenes, C., & Martínez-Ledesma, E. (2026) · Frontiers in Physiology · doi:10.3389/fphys.2026.1727465 · Cited by 1
Peng, M.-L., Zhan, Y.-Y., Cao, L.-F., Gadetskaya, A. V., Yu, K.-J., Zhang, J., Qiu, X., Huang, Z., & Xu, W. (2025) · Microchemical Journal · doi:10.1016/j.microc.2025.112728 · Cited by 1
Book review: Zhang, X., Yang, E., & Thomas, N: Enterprise Management Control Systems in China
Asdullah, M. A., & Yazdifar, H. (2019) · Asia-Pacific Journal of Management Research and Innovation · doi:10.1177/2319510x19883075 · Cited by 1
Gupta, S. V., Kaur, S., & Hamid, J. U. (2022) · Current Analytical Chemistry · doi:10.2174/1573411018666220810124544
Alterations in the oral microbiome and metabolome of methamphetamine addictsPreprint
Wang, D., Feng, Y., Yang, M., Sun, H., Zhang, Q., Wang, R., Tong, S., Su, R. J., Jin, Y., Wang, Y., et al. (2023) · Research Square · doi:10.21203/rs.3.rs-2946952/v1
Hegde, A., Upadhyay, S. S., Prasad, T. S. K., & Modi, P. K. (2023) · Elsevier eBooks · doi:10.1016/b978-0-443-19084-1.00007-7
Metabolomics in neurodegenerative disorders—Parkinson’s disease
Gupta, A., Bhaduri, I., & Dixit, A. (2024) · Comprehensive analytical chemistry · doi:10.1016/bs.coac.2023.09.008
Xu, D., Dai, J., Tang, L., Pan, J., & Zhang, H. (2024) · Biomedical Chromatography · doi:10.1002/bmc.5834
Mutagenicity and genotoxicity of naturally occurring tryptamines and their principal metabolites
Paley, E. L. (2024) · Elsevier eBooks · doi:10.1016/b978-0-443-28830-2.00008-7
Cerebrospinal Fluid and Plasma Metabolites with Parkinson’s Disease: A Mendelian Randomization StudyPreprint
Wang, J.-L., Zheng, R., Fang, Y., Cao, J., & Zhang, B. (2024) · medRxiv · doi:10.1101/2024.07.19.24310687
Fair Data, Bayesian Statistics and Human Cohort Studies: Current Trends in Metabolomic Research
Fiehn, O. (2024) · Metabolites · doi:10.3390/metabo14110576
Identification of Secondary Metabolites by Multi-Omics Methods
Fang, X. (2024) · Metabolites · doi:10.3390/metabo14110597 · Cited by 1
Biomarkers in Parkinson’s Disease
Deng, H., Li, T., Liu, X., Shao, Y., Yang, Z., Li, S., & Le, W. (2025) · Cambridge University Press eBooks · doi:10.1017/9781108989855.021
Self-citationResearch Progress of Tryptophan-Related Metabolites in Parkinson’s Disease
徐, 利. (2025) · Advances in Clinical Medicine · doi:10.12677/acm.2025.1541318
Yang, R., Jia, M., Xu, Y., Wu, Z., Wu, D., & Gui, Y. (2025) · Frontiers in Microbiology · doi:10.3389/fmicb.2025.1621468
Zhang, Y., Wang, D., Huang, Z., Zhang, N., Wang, Z., Wu, X., Zhang, A., Yang, R., Li, T., Zheng, Z., et al. (2025) · Advanced Science · doi:10.1002/advs.202512951
Self-citationShared metabolomic signatures for prognostic precision across brain injuries
Hellström, S., Sajanti, A., Jhaveri, A., Cao, Y., Koskimäki, F., Falter, J., Frantzén, J., Lyne, S. B., Rantamäki, T., Takala, R. S. K., et al. (2025) · Brain and Spine · doi:10.1016/j.bas.2025.105877
Metadata
- Authors
- Shao, Y., Li, T., Liu, Z., Wang, X., Xu, X., Li, S., Xu, G., & Le, W.
- Affiliations
- Dalian Medical University (CN)
- Dalian Institute of Chemical Physics (CN)
- University of Electronic Science and Technology of China (CN)
- Corresponding author
- Xu, Guowang
- Le, Weidong
- Venue
- Molecular Neurodegeneration
- Published
- 2021-01-23
- Volume
- 16
- Issue
- 1
- Pages
- 4-4
- ISSN
- 1750-1326 (ISSN-L)
- PMC
- PMC7825156
- OpenAlex
- W3125488374
- Cited by
- 226
- References
- 83
- Citations by year
- 2026: 37 · 2025: 57 · 2024: 56 · 2023: 36 · 2022: 27 · 2021: 11
- FWCI
- 10.19
- Type
- journal article
- Language
- en
- Open access
- gold
- doi.org
- Locations
- Molecular Neurodegeneration (publishedVersion, cc-by)
- PubMed Central (publishedVersion, cc-by)
- PubMed (publishedVersion)
- DOAJ (DOAJ: Directory of Open Access Journals) (submittedVersion, cc-by-sa)
- Funders
- National Key Research and Development Program of China (2016YFC1306600)
- National Natural Science Foundation of China (81771521, 21876169, 22004013)
- Key Realm R&D Program of Guangdong Province (2018B030337001)
- Topics
- Life Sciences › Biochemistry, Genetics and Molecular Biology › Molecular Biology › Metabolomics and Mass Spectrometry Studies
- Health Sciences › Medicine › Clinical Neurology › Parkinson's Disease Mechanisms and Treatments
- Life Sciences › Biochemistry, Genetics and Molecular Biology › Clinical Biochemistry › Metabolism and Genetic Disorders
- Keywords
- Parkinson's disease, plasma metabolomics, metabolic biomarkers, diagnostic biomarker panel, fatty acids, bile acids, L-dopa treatment, phenylalanine and tyrosine metabolism, caffeine metabolites, gut microbiota metabolites, steroid hormones, indolelactic acid, Parkinson's disease diagnosis
- MeSH terms
- Aged, Chromatography, Liquid, Female, Humans, Male, Parkinson Disease, Mass Spectrometry, Biomarkers, Case-Control Studies, Metabolomics, Metabolome
About these checks
Registry, retraction, Cites and statistics results are computed, not judged, with one exception: a printed reference that no index lists is read once by a model before it counts as a citation error. Claims are extracted by a model and kept only when their quote appears verbatim in the text; each cited source is then checked, with a model’s help, for whether it says what the claim relies on. Those verdicts can be wrong — read the claim’s quote and the cited source before relying on one.
Statistics and arithmetic are recomputed, not judged.
Confidence bands are shown only for fields calibrated on our annotated test set. None is calibrated yet, so no band is shown.
What counts as a claim ›How we measure confidence ›How we check this ›
Are you an author, or do you see a problem with this page? Request a review
