

The DOI matches its Crossref record; 74 of the 74 references it cites were found in a registry or an index.
Plaque associated microglia hyper-secrete extracellular vesicles and accelerate tau propagation in a humanized APP mouse model
Open accessPublished version of a preprint
Abstract
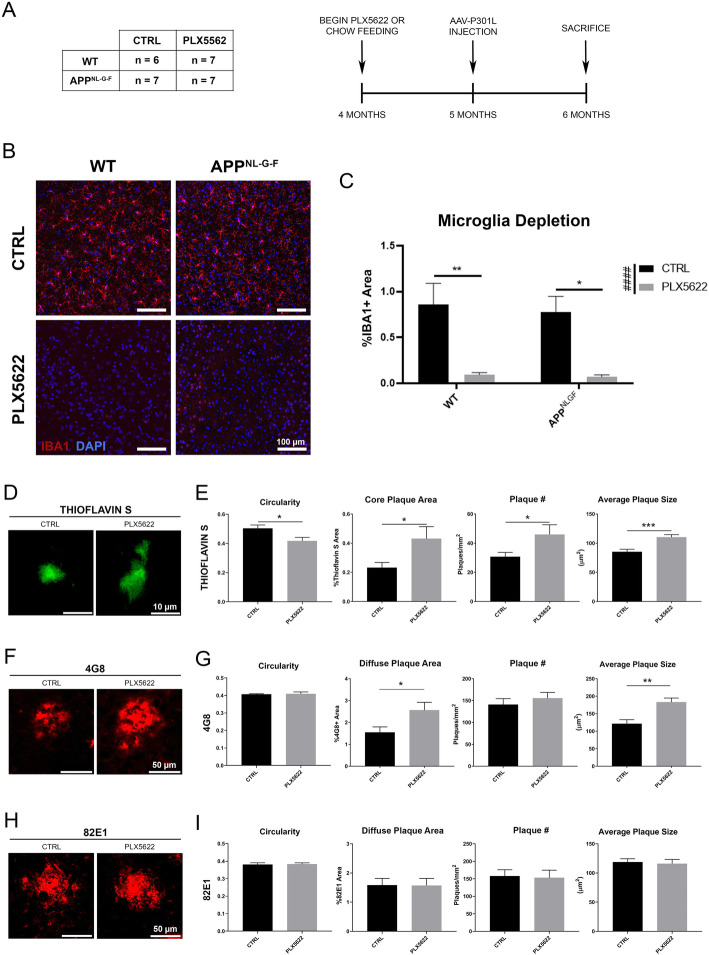
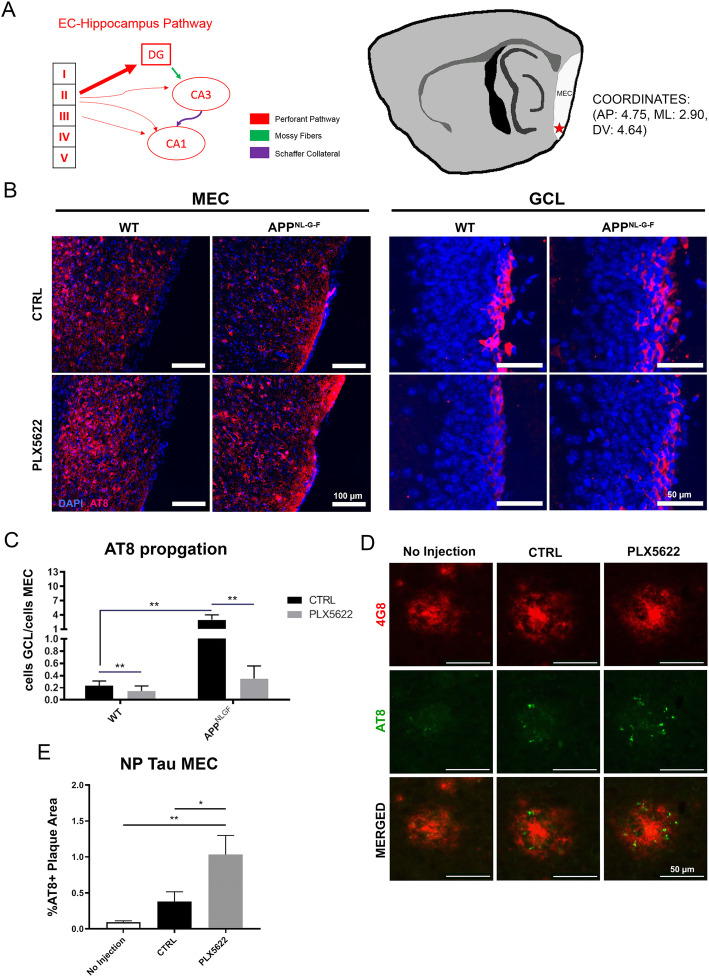
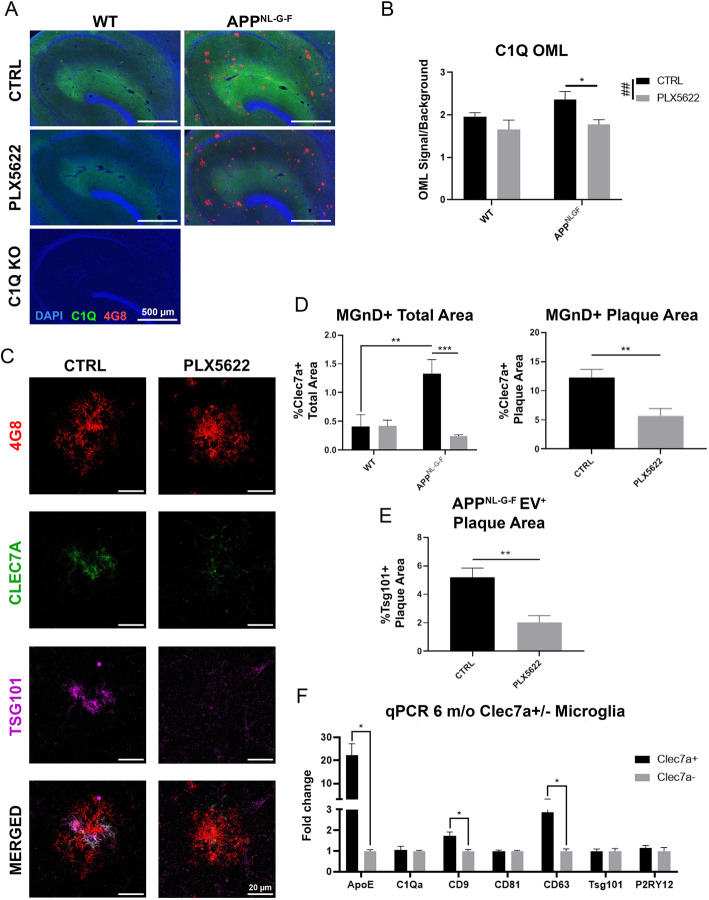
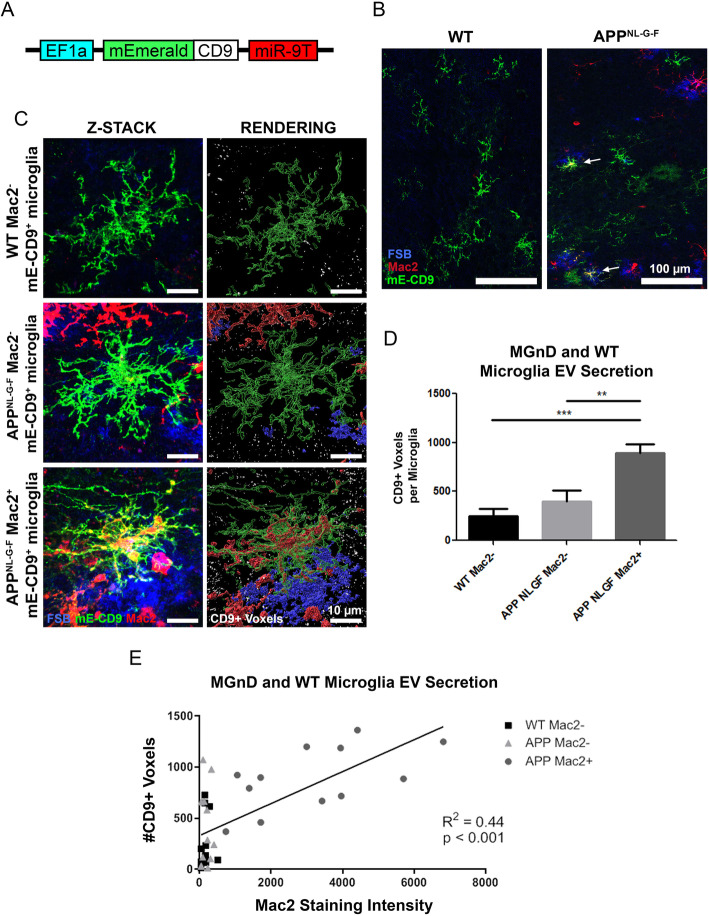
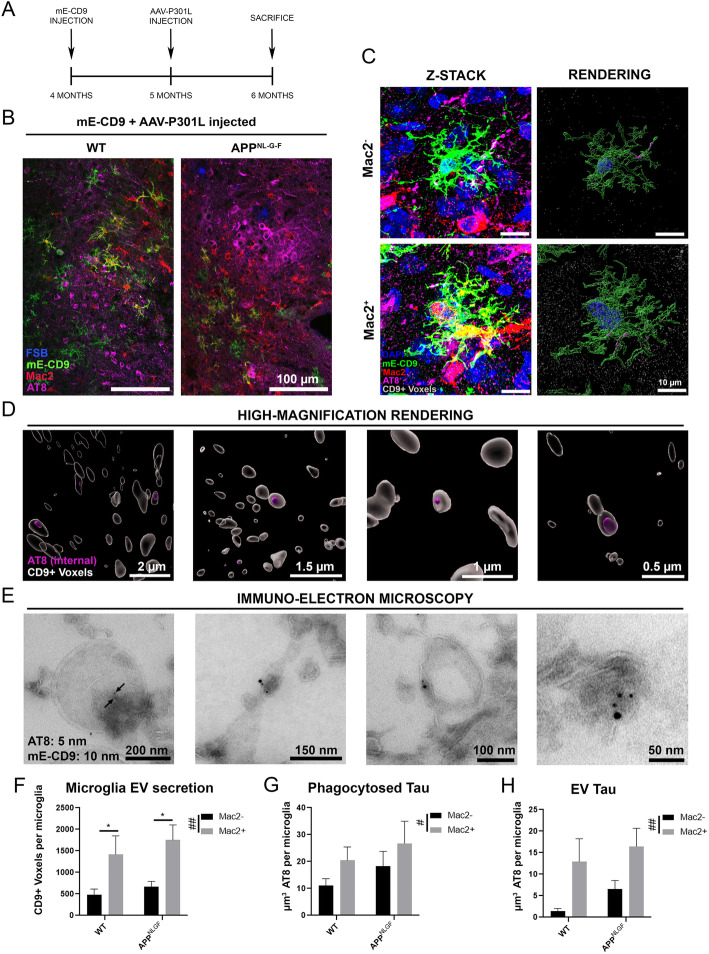
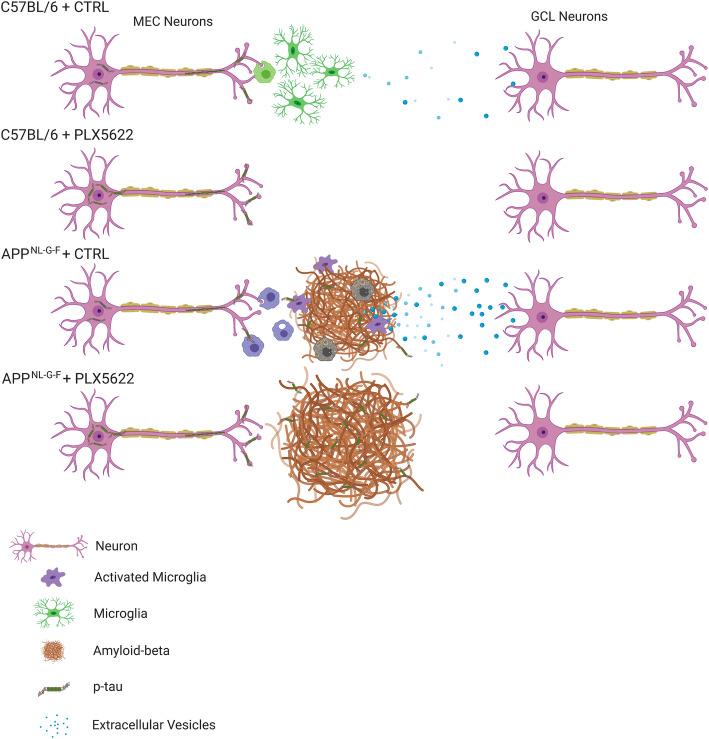
Abstract Background Recent studies suggest that microglia contribute to tau pathology progression in Alzheimer’s disease. Amyloid plaque accumulation transforms microglia, the primary innate immune cells in the brain, into neurodegenerative microglia (MGnD), which exhibit enhanced phagocytosis of plaques, apoptotic neurons and dystrophic neurites containing aggregated and phosphorylated tau (p-tau). It remains unclear how microglia promote disease progression while actively phagocytosing pathological proteins, therefore ameliorating pathology. Methods Adeno-associated virus expressing P301L tau mutant (AAV-P301L-tau) was stereotaxically injected into the medial entorhinal cortex (MEC) in C57BL/6 (WT) and humanized APP mutant knock-in homozygote ( App NL-G-F ) mice at 5 months of age. Mice were fed either chow containing a colony stimulating factor-1 receptor inhibitor (PLX5622) or control chow from 4 to 6 months of age to test the effect of microglia depletion. Animals were tested at 6 months of age for immunofluorescence, biochemistry, and FACS of microglia. In order to monitor microglial extracellular vesicle secretion in vivo, a novel lentiviral EV reporter system was engineered to express mEmerald-CD9 (mE-CD9) specifically in microglia, which was injected into the same region of MEC. Results Expressing P301L tau mutant in the MEC induced tau propagation to the granule cell layer of the hippocampal dentate gyrus, which was significantly exacerbated in App NL-G-F mice compared to WT control mice. Administration of PLX5622 depleted nearly all microglia in mouse brains and dramatically reduced propagation of p-tau in WT and to a greater extent in App NL-G-F mice, although it increased plaque burden and plaque-associated p-tau + dystrophic neurites. Plaque-associated MGnD microglia strongly expressed an EV marker, tumor susceptibility gene 101, indicative of heightened synthesis of EVs. Intracortical injection of mE-CD9 lentivirus successfully induced microglia-specific expression of mE-CD9 + EV particles, which were significantly enhanced in Mac2 + MGnD microglia compared to Mac2 − homeostatic microglia. Finally, consecutive intracortical injection of mE-CD9 lentivirus and AAV-P301L-tau into App NL-G-F mice revealed encapsulation of p-tau in microglia-specific mE-CD9 + EVs as determined by super-resolution microscopy and immuno-electron microscopy. Discussion Our findings suggest that MGnD microglia hyper-secrete p-tau + EVs while compacting Aβ plaques and clearing NP tau, which we propose as a novel mechanistic link between amyloid plaque deposition and exacerbation of tau propagation in App NL-G-F mice.
Overview
The claims and statistics of this paper haven’t been checked yet.
Run the check — free, no account needed. It reads the open-access text and checks the sources it cites.
Integrity signals
Registry
Cites
Statistics
Figures
Verification
Claims the paper makes
The claims and statistics of this paper haven’t been checked yet.
Run the check — free, no account needed. It reads the open-access text and checks the sources it cites.
Claims other papers make about this one
Each is checked against this paper’s own text: does it say what the citing paper says it does?
The source backs part of the claim, not all of it — or backs it for a different population, condition or comparison.
In the citing paper
“Amyloid-β–associated microglia were shown to secrete extracellular vesicles that contain phosphorylated tau and their depletion abrogated tau propagation (Clayton et al., 2021).”
From A novel molecular class that recruits HDAC/MECP2 complexes to PU.1 motifs reduces neuroinflammation (2023) · cites this paper as Clayton et al., 2021
Experimental — accuracy not yet measuredThe source backs part of the claim, not all of it — or backs it for a different population, condition or comparison.
In the citing paper
“demonstrating that microglia play an essential role in plaque compaction between four to six months of age in mice [61]”
From Microglia and monocytes in inflammatory CNS disease: integrating phenotype and function (2022) · cites this paper as [61]
Experimental — accuracy not yet measuredThe source backs part of the claim, not all of it — or backs it for a different population, condition or comparison.
In the citing paper
“microglia were shown to be three times as phagocytic and three times more likely to release tau-containing extracellular vesicles when situated near amyloid plaques [61]”
From Microglia and monocytes in inflammatory CNS disease: integrating phenotype and function (2022) · cites this paper as [61]
Experimental — accuracy not yet measuredThe cited source says what the claim attributes to it.
In the citing paper
“However, in the same study, an increase in plaque-associated tau in dystrophic neurites was found, indicating that microglia play a complex role in both the spread of tau and clearance of neuronal debris associated with pathological tau.”
From A novel molecular class that recruits HDAC/MECP2 complexes to PU.1 motifs reduces neuroinflammation (2023) · cites this paper as Clayton et al., 2021
The cited source says what the claim attributes to it.
In the citing paper
“microglia depletion in four-month-old humanized APP mutant knock-in homozygote (APPNL−G−F) mice resulted in reduced plaque compaction and increased plaque volume, number, and size”
From Microglia and monocytes in inflammatory CNS disease: integrating phenotype and function (2022) · cites this paper as [61]
The cited source says what the claim attributes to it.
In the citing paper
“Microglia have also been implicated in the pathological spreading of tau via the release of extracellular vesicles [12, 61, 328]”
From Microglia and monocytes in inflammatory CNS disease: integrating phenotype and function (2022) · cites this paper as [61]
The cited source says what the claim attributes to it.
In the citing paper
“This was associated with enhanced tau propagation in mice with amyloidosis, compared to wild-type mice without amyloidosis [61]”
From Microglia and monocytes in inflammatory CNS disease: integrating phenotype and function (2022) · cites this paper as [61]
In the citing paper
“in an Alzheimer’s animal model, microglia secreted abundant p-tau+ sEVs, which accelerated amyloid plaque deposition, thus exacerbating tau propagation and worsening the symptoms of the disease [41].”
From M2 microglia-derived small extracellular vesicles modulate NSC fate after ischemic stroke via miR-25-3p/miR-93-5p-TGFBR/PTEN/FOXO3 axis (2025) · cites this paper as [41]
Self-check
Percentages, sums and reported differences re-computed from the paper’s own numbers.
The self-check needs the paper’s full text.
Citations
Cites
A Unique Microglia Type Associated with Restricting Development of Alzheimer’s Disease
Keren-Shaul, H., Spinrad, A., Weiner, A., Matcovitch-Natan, O., Dvir-Szternfeld, R., Ulland, T. K., David, E., Baruch, K., Lara-Astaiso, D., Toth, B., et al. (2017) · Cell · doi:10.1016/j.cell.2017.05.018 · Cited by 5,493
Synaptic Pruning by Microglia Is Necessary for Normal Brain Development
Paolicelli, R. C., Bolasco, G., Pagani, F., Maggi, L., Scianni, M., Panzanelli, P., Giustetto, M., Ferreira, T. A., Guiducci, E., Dumas, L., et al. (2011) · Science · doi:10.1126/science.1202529 · Cited by 4,244
Microglia Sculpt Postnatal Neural Circuits in an Activity and Complement-Dependent Manner
Schafer, D. P., Lehrman, E. K., Kautzman, A. G., Koyama, R., Mardinly, A. R., Yamasaki, R., Ransohoff, R. M., Greenberg, M. E., Barres, B. A., & Stevens, B. (2012) · Neuron · doi:10.1016/j.neuron.2012.03.026 · Cited by 4,089
Complement and microglia mediate early synapse loss in Alzheimer mouse models
Hong, S., Beja-Glasser, V. F., Nfonoyim, B. M., Frouin, A., Li, S., Ramakrishnan, S., Merry, K. M., Shi, Q., Rosenthal, A., Barres, B. A., et al. (2016) · Science · doi:10.1126/science.aad8373 · Cited by 3,343 · cited 1×
“It is well known that microglia actively phagocytose synapses by synaptic tagging with complements (C1q and C3) [50–52], which also play an important role in Aβ-induced synaptic loss [53].”
BackgroundKrasemann, S., Madore, C., Cialic, R., Baufeld, C., Calcagno, N., El Fatimy, R., Beckers, L., O’Loughlin, E., Xu, Y., Fanek, Z., et al. (2017) · Immunity · doi:10.1016/j.immuni.2017.08.008 · Cited by 2,979
Self-citationIdentification of a unique TGF-β–dependent molecular and functional signature in microglia
Butovsky, O., Jedrychowski, M. P., Moore, C. S., Cialic, R., Lanser, A. J., Gabriely, G., Koeglsperger, T., Dake, B., Wu, P. M., Doykan, C. E., et al. (2014) · Nature Neuroscience · doi:10.1038/nn.3599 · Cited by 2,543
Elmore, M. R. P., Najafi, A. R., Koike, M. A., Dagher, N. N., Spangenberg, E. E., Rice, R. A., Kitazawa, M., Matusow, B., Nguyen, H., West, B. L., et al. (2014) · Neuron · doi:10.1016/j.neuron.2014.02.040 · Cited by 1,968
Depletion of microglia and inhibition of exosome synthesis halt tau propagation
Asai, H., Ikezu, S., Tsunoda, S., Medalla, M., Luebke, J., Haydar, T., Wolozin, B., Butovsky, O., Kügler, S., & Ikezu, T. (2015) · Nature Neuroscience · doi:10.1038/nn.4132 · Cited by 1,591
Self-citationThe microglial sensome revealed by direct RNA sequencing
Hickman, S. E., Kingery, N. D., Ohsumi, T. K., Borowsky, M. L., Wang, L.-C., Means, T. K., & El Khoury, J. (2013) · Nature Neuroscience · doi:10.1038/nn.3554 · Cited by 1,511
NLRP3 inflammasome activation drives tau pathology
Ising, C., Venegas, C., Zhang, S., Scheiblich, H., Schmidt, S. V., Vieira-Saecker, A., Schwartz, S., Albasset, S., McManus, R. M., Tejera, D., et al. (2019) · Nature · doi:10.1038/s41586-019-1769-z · Cited by 1,487
Cited by
Sorted by citations
Microglia in neurodegenerative diseases: mechanism and potential therapeutic targets
Gao, C., Jiang, J., Tan, Y., & Chen, S. (2023) · Signal Transduction and Targeted Therapy · doi:10.1038/s41392-023-01588-0 · Cited by 1,616
Synaptic degeneration in Alzheimer disease
Tzioras, M., McGeachan, R. I., Durrant, C. S., & Spires-Jones, T. L. (2023) · Nature Reviews Neurology · doi:10.1038/s41582-022-00749-z · Cited by 504
The effects of microglia-associated neuroinflammation on Alzheimer’s disease
Wang, C., Zong, S., Cui, X., Wang, X., Wu, S., Wang, L., Liu, Y., & Lu, Z. (2023) · Frontiers in Immunology · doi:10.3389/fimmu.2023.1117172 · Cited by 331
The neuroimmune axis of Alzheimer’s disease
Jorfi, M., Maaser‐Hecker, A., & Tanzi, R. E. (2023) · Genome Medicine · doi:10.1186/s13073-023-01155-w · Cited by 313
The Contribution of Microglia to Neuroinflammation in Parkinson’s Disease
Badanjak, K., Fixemer, S., Smajić, S., Skupin, A., & Grünewald, A. (2021) · International Journal of Molecular Sciences · doi:10.3390/ijms22094676 · Cited by 296
Cellular and pathological heterogeneity of primary tauopathies
Chung, D. C., Roemer, S. F., Petrucelli, L., & Dickson, D. W. (2021) · Molecular Neurodegeneration · doi:10.1186/s13024-021-00476-x · Cited by 232
Microglia and monocytes in inflammatory CNS disease: integrating phenotype and function
Spiteri, A. G., Wishart, C. L., Pamphlett, R., Locatelli, G., & King, N. J. C. (2022) · Acta Neuropathologica · doi:10.1007/s00401-021-02384-2 · Cited by 216
“Intriguingly, microglia were shown to be three times as phagocytic and three times more likely to release tau-containing extracellular vesicles when situated near amyloid plaques [61].”
BackgroundMethodInfluentialCell type‐specific roles of APOE4 in Alzheimer disease
Blumenfeld, J., Yip, O., Kim, M. J., & Huang, Y. (2024) · Nature Reviews Neuroscience · doi:10.1038/s41583-023-00776-9 · Cited by 202
Leng, L., Yuan, Z., Pan, R., Su, X., Wang, H., Xue, J., Zhuang, K., Gao, J., Chen, Z., Lin, H. Z., et al. (2022) · Nature Metabolism · doi:10.1038/s42255-022-00643-4 · Cited by 196
Lau, V. Z., Ramer, L. M., & Tremblay, M. (2023) · Nature Communications · doi:10.1038/s41467-023-37304-3 · Cited by 175
Microglia in Alzheimer’s Disease: A Target for Therapeutic Intervention
Zhang, G., Wang, Z., Hu, H., Zhao, M., & Sun, L. (2021) · Frontiers in Cellular Neuroscience · doi:10.3389/fncel.2021.749587 · Cited by 137
Zhou, T. G., Li, Y., Li, X., Zeng, F., Rao, Y., He, Y., Wang, Y., Liu, M., Li, D., Xu, Z., et al. (2022) · Nature Communications · doi:10.1038/s41467-022-33932-3 · Cited by 124
Baligács, N., Albertini, G., Borrie, S. C., Serneels, L., Pridans, C., Balusu, S., & De Strooper, B. (2024) · Nature Communications · doi:10.1038/s41467-024-54779-w · Cited by 123
Cohn, W., Melnik, M., Huang, C., Teter, B., Chandra, S., Zhu, C., McIntire, L. B., John, V., Gylys, K. H., & Bilousova, T. V. (2021) · Frontiers in Pharmacology · doi:10.3389/fphar.2021.766082 · Cited by 123
Yin, Z., Herron, S., Silveira, S., Kleemann, K., Gauthier, C., Mallah, D., Cheng, Y., Margeta, M. A., Pitts, K. M., Barry, J.-L., et al. (2023) · Nature Neuroscience · doi:10.1038/s41593-023-01355-y · Cited by 120
Self-citationMicroglia-Astrocyte Communication in Alzheimer’s Disease
Wu, Y., & Eisel, U. L. M. (2023) · Journal of Alzheimer s Disease · doi:10.3233/jad-230199 · Cited by 125
The role of the immune system in Alzheimer’s disease
Wu, K., Zhang, Y.-R., Huang, Y., Dong, Q., Tan, L., & Yu, J. (2021) · Ageing Research Reviews · doi:10.1016/j.arr.2021.101409 · Cited by 119
Tau filaments are tethered within brain extracellular vesicles in Alzheimer’s disease
Fowler, S. L., Behr, T. S., Turkes, E., O'Brien, D. P., Cauhy, P. M., Rawlinson, I., Edmonds, M. J., Foiani, M. S., Schaler, A. W., Crowley, G., et al. (2024) · Nature Neuroscience · doi:10.1038/s41593-024-01801-5 · Cited by 123
Insights Into the Role of CSF1R in the Central Nervous System and Neurological Disorders
Hu, B., Duan, S., Wang, Z., Li, X., Zhou, Y., Zhang, X., Zhang, Y., Xu, H., & Zheng, H. (2021) · Frontiers in Aging Neuroscience · doi:10.3389/fnagi.2021.789834 · Cited by 112
Exosome: A novel neurotransmission modulator or non-canonical neurotransmitter?
Xia, X., Wang, Y., Qin, Y., Zhao, S., & Zheng, J. (2022) · Ageing Research Reviews · doi:10.1016/j.arr.2021.101558 · Cited by 107
Tau in neurodegenerative diseases: molecular mechanisms, biomarkers, and therapeutic strategies
Zhang, X., Wang, J., Zhang, Z., & Ye, K. (2024) · Translational Neurodegeneration · doi:10.1186/s40035-024-00429-6 · Cited by 119
Benítez, D. P., Jiang, S., Wood, J. I., Wang, R., Hall, C. M., Peerboom, C., Wong, N. S. M., Stringer, K. M., Vitanova, K. S., Smith, V. C., et al. (2021) · Molecular Neurodegeneration · doi:10.1186/s13024-021-00457-0 · Cited by 81
Self-citationDifferent phenotypes of microglia in animal models of Alzheimer disease
Wei, Y., & Li, X. (2022) · Immunity & Ageing · doi:10.1186/s12979-022-00300-0 · Cited by 86
St‐Pierre, M., Carrier, M., Ibáñez, F. G., Šimončičová, E., Wallman, M., Vallières, L., Parent, M., & Tremblay, M. (2022) · Journal of Neuroinflammation · doi:10.1186/s12974-022-02595-8 · Cited by 80
A critical appraisal of tau‐targeting therapies for primary and secondary tauopathies
Imbimbo, B. P., Ippati, S., Watling, M., & Balducci, C. (2021) · Alzheimer s & Dementia · doi:10.1002/alz.12453 · Cited by 76
Wang, W., Li, Y., Ma, F., Sheng, X., Chen, K., Zhuo, R., Wang, C., Zheng, H., Zhang, Y.-W., Bu, G., et al. (2023) · Brain, Behavior, and Immunity · doi:10.1016/j.bbi.2023.07.011 · Cited by 71
Microglia, Trem2, and Neurodegeneration
Shi, Q., Gutierrez, R. A., & Bhat, M. A. (2025) · The Neuroscientist · doi:10.1177/10738584241254118 · Cited by 69
“…of a unique microglial subtype in neurodegenerative diseases, termed disease-associated microglia (DAM) (Deczkowska and others 2018) or microglial neurodegenerative (MGnD) phenotype (Clayton and others 2021; Krasemann and others 2017), has been a significant development in the microglia field.”
Madhu, L. N., Kodali, M., Upadhya, R., Rao, S., Somayaji, Y., Attaluri, S., Shuai, B., Kirmani, M., Gupta, S., Maness, N., et al. (2024) · Journal of Extracellular Vesicles · doi:10.1002/jev2.12519 · Cited by 69
Microglia: Friend and foe in tauopathy
Odfalk, K. F., Bieniek, K. F., & Hopp, S. C. (2022) · Progress in Neurobiology · doi:10.1016/j.pneurobio.2022.102306 · Cited by 60
Research progress on the role of extracellular vesicles in neurodegenerative diseases
Li, Z., Wang, X., Wang, X., Yi, X., Wong, Y. K., Wu, J., Xie, F., Hu, D., Wang, Q., Wang, J., et al. (2023) · Translational Neurodegeneration · doi:10.1186/s40035-023-00375-9 · Cited by 67
The Yin and Yang of Microglia-Derived Extracellular Vesicles in CNS Injury and Diseases
Ghosh, M., & Pearse, D. D. (2024) · Cells · doi:10.3390/cells13221834 · Cited by 69
Gong, Z., Cheng, C., Sun, C., & Cheng, X. (2025) · Journal of Experimental & Clinical Cancer Research · doi:10.1186/s13046-025-03403-w · Cited by 72
Glotfelty, E. J., Tovar‐y‐Romo, L. B., Hsueh, S., Tweedie, D., Li, Y., Harvey, B. K., Hoffer, B. J., Karlsson, T. E., Olson, L., & Greig, N. H. (2023) · Cells · doi:10.3390/cells12101367 · Cited by 65
Passive immunotherapy for Alzheimer's disease
Guo, X., Li, Y., Zhang, D., & Zhao, Y. (2024) · Ageing Research Reviews · doi:10.1016/j.arr.2024.102192 · Cited by 69
Muraoka, S., Jedrychowski, M. P., Iwahara, N., Abdullah, M., Onos, K. D., Keezer, K. J., Hu, J., Ikezu, S., Howell, G. R., Gygi, S. P., et al. (2021) · Journal of Proteome Research · doi:10.1021/acs.jproteome.0c00934 · Cited by 61
Self-citationMicroglial Extracellular Vesicles as Vehicles for Neurodegeneration Spreading
Aires, I. D., Ribeiro‐Rodrigues, T., Boia, R., Ferreira-Rodrigues, M., Girão, H., Ambrósio, A. F., & Santiago, A. R. (2021) · Biomolecules · doi:10.3390/biom11060770 · Cited by 57
Gomes, P., Tzouanou, F., Skolariki, K., Vamvaka-Iakovou, A., Nogueras‐Ortiz, C. J., Tsirtsaki, K., Waites, C. L., Vlamos, P., Sousa, N., Costa‐Silva, B., et al. (2022) · Experimental Neurology · doi:10.1016/j.expneurol.2022.114183 · Cited by 60
Wang, L., Zhang, X., Yang, Z., Wang, B., Gong, H., Zhang, K., Lin, Y., & Sun, M. (2024) · Translational Neurodegeneration · doi:10.1186/s40035-024-00453-6 · Cited by 55
Extracellular vesicles: New horizons in neurodegeneration
Chen, J., Tian, C., Xiong, X., Yang, Y., & Zhang, J. (2025) · eBioMedicine · doi:10.1016/j.ebiom.2025.105605 · Cited by 53
Beyond Amyloid and Tau: The Critical Role of Microglia in Alzheimer’s Disease Therapeutics
Dias, D., & Socodato, R. (2025) · Biomedicines · doi:10.3390/biomedicines13020279 · Cited by 60
Wang, Q., Lu, M., Zhu, X., Gu, X., Zhang, T., Xia, C., Yang, L., Xu, Y., & Zhou, M. (2022) · Biomedicine & Pharmacotherapy · doi:10.1016/j.biopha.2022.113412 · Cited by 52
Extracellular vesicles: translational research and applications in neurology
Manolopoulos, A., Yao, P. J., & Kapogiannis, D. (2025) · Nature Reviews Neurology · doi:10.1038/s41582-025-01080-z · Cited by 60
Neuroprotective and Neurotoxic Effects of Glial-Derived Exosomes
Oyarce, K., Cepeda, M. Y., Lagos, R., Garrido, C., Vega-Letter, A. M., García, M. D. L. Á., Luz‐Crawford, P., & Elizondo-Vega, R. J. (2022) · Frontiers in Cellular Neuroscience · doi:10.3389/fncel.2022.920686 · Cited by 53
Harnessing human iPSC-microglia for CNS-wide delivery of disease-modifying proteins
Chadarevian, J. P., Davtyan, H., Chadarevian, A. L., Nguyen, J., Capocchi, J. K., Le, L., Escobar, A., Chadarevian, T., Mansour, K., Deynega, E., et al. (2025) · Cell Stem Cell · doi:10.1016/j.stem.2025.03.009 · Cited by 60
The multiple faces of extracellular vesicles released by microglia: Where are we 10 years after?
Gabrielli, M., Raffaele, S., Fumagalli, M., & Verderio, C. (2022) · Frontiers in Cellular Neuroscience · doi:10.3389/fncel.2022.984690 · Cited by 55
Walker, J. M., Orr, M. E., Orr, T. C., Thorn, E. L., Christie, T. D., Yokoda, R. T., Vij, M., Ehrenberg, A. J., Marx, G. A., McKenzie, A. T., et al. (2023) · Alzheimer s & Dementia · doi:10.1002/alz.13484 · Cited by 45
Natale, F., Fusco, S., & Grassi, C. (2022) · Translational Neurodegeneration · doi:10.1186/s40035-022-00326-w · Cited by 49
Fetal brain response to maternal inflammation requires microglia
Ostrem, B. E. L., Domıńguez-Iturza, N., Stogsdill, J., Faits, T., Kim, K., Levin, J. Z., & Arlotta, P. (2024) · Development · doi:10.1242/dev.202252 · Cited by 46
Delpech, J.-C., Pathak, D., Varghese, M., Kalavai, S. V., Hays, E. C., Hof, P. R., Johnson, W. E., Ikezu, S., Medalla, M., Luebke, J. I., et al. (2021) · Science Translational Medicine · doi:10.1126/scitranslmed.abe8455 · Cited by 46
Self-citationGranzyme K+ CD8 T cells slow tauopathy progression by targeting microglia
Mason, H. D., Latour, Y. L., Boughter, C. T., Johnson, K. R., Maric, D., Dorrier, C., Guedes, V. A., Lai, C., Duncker, P. C., Johnson, A. M., et al. (2025) · Nature Immunology · doi:10.1038/s41590-025-02198-4 · Cited by 48
Extracellular vesicles in Alzheimer’s disease: from pathology to therapeutic approaches
Thakor, A., & Garcia-Contreras, M. (2023) · Neural Regeneration Research · doi:10.4103/1673-5374.343882 · Cited by 41
Gao, C., Shen, X., Tan, Y., & Chen, S. (2022) · Journal of Neuroinflammation · doi:10.1186/s12974-022-02580-1 · Cited by 48
Brain incoming call from glia during neuroinflammation: Roles of extracellular vesicles
D’Egidio, F., Castelli, V., d’Angelo, M., Ammannito, F., Quintiliani, M., & Cimini, A. (2024) · Neurobiology of Disease · doi:10.1016/j.nbd.2024.106663 · Cited by 41
Synapses, Microglia, and Lipids in Alzheimer’s Disease
Paasila, P. J., Aramideh, J. A., Sutherland, G. T., & Graeber, M. B. (2022) · Frontiers in Neuroscience · doi:10.3389/fnins.2021.778822 · Cited by 40
Hirota, Y., Sakakibara, Y., Ibaraki, K., Takei, K., Iijima, K., & Sekiya, M. (2022) · Brain Communications · doi:10.1093/braincomms/fcac286 · Cited by 41
Extracellular Vesicle-Mediated Neuron–Glia Communications in the Central Nervous System
Ikezu, T., Yang, Y., Verderio, C., & Krämer‐Albers, E. (2024) · Journal of Neuroscience · doi:10.1523/jneurosci.1170-24.2024 · Cited by 50
Self-citationKloske, C. M., Dugan, A. J., Weekman, E. M., Winder, Z., Patel, E., Nelson, P. T., Fardo, D. W., & Wilcock, D. M. (2021) · Journal of Neuropathology & Experimental Neurology · doi:10.1093/jnen/nlab085 · Cited by 37
Visconte, C., Golia, M. T., Fenoglio, C., Serpente, M., Gabrielli, M., Arcaro, M., Sorrentino, F., Busnelli, M., Arighi, A., Fumagalli, G., et al. (2023) · GeroScience · doi:10.1007/s11357-023-00746-0 · Cited by 36
Neurodegenerative fluid biomarkers are enriched in human cervical lymph nodes
Al‐Diwani, A., Provine, N. M., Murchison, A. G., Laban, R., Swann, O., Koychev, I. G., Sheerin, F., Mesquita, S. D., Heslegrave, A., Zetterberg, H., et al. (2024) · Brain · doi:10.1093/brain/awae329 · Cited by 38
Neuroinflammation in Age-Related Neurodegenerative Diseases: Role of Mitochondrial Oxidative Stress
Abadin, X., de Dios, C., Zubillaga, M., Ivars, E., Puigròs, M., Marí, M., Morales, A., Vizuete, M., Vitórica, J., Trullás, R., et al. (2024) · Antioxidants · doi:10.3390/antiox13121440 · Cited by 41
Tau Seeding Mouse Models with Patient Brain-Derived Aggregates
Robert, A., Schöll, M., & Vogels, T. (2021) · International Journal of Molecular Sciences · doi:10.3390/ijms22116132 · Cited by 37
Gutiérrez‐Fernández, M., de la Cuesta, F., Tallón, A., Puertas, I., Fernández-Fournier, M., Laso-García, F., Frutos, M. C. G.-D., Díez‐Tejedor, E., & Otero‐Ortega, L. (2021) · International Journal of Molecular Sciences · doi:10.3390/ijms22169011 · Cited by 32
Role of Glia-Derived Extracellular Vesicles in Neurodegenerative Diseases
Li, T., Tan, X., Li, S., Al-Nusaif, M., & Le, W. (2021) · Frontiers in Aging Neuroscience · doi:10.3389/fnagi.2021.765395 · Cited by 33
Congdon, E. E., Pan, R., Jiang, Y., Sandusky‐Beltran, L. A., Dodge, A., Lin, Y., Liu, M., Kuo, M., Kong, X., & Sigurdsson, E. M. (2022) · EBioMedicine · doi:10.1016/j.ebiom.2022.104249 · Cited by 33
You, Y., Chen, M., Tang, Y., Yu, W.-X., Pang, X., Chu, Y., Zhang, H., Shang, K., Deng, G., Zhou, L., et al. (2023) · Journal of Neuroinflammation · doi:10.1186/s12974-023-02772-3 · Cited by 32
A small-molecule TLR4 antagonist reduced neuroinflammation in female E4FAD mice
Balu, D., Valencia-Olvera, A. C., Nguyen, A., Patnam, M., York, J., Peri, F., Neumann, F., LaDu, M. J., & Tai, L. M. (2023) · Alzheimer's Research & Therapy · doi:10.1186/s13195-023-01330-6 · Cited by 27
Yang, Y. H., Ishima, T., Wan, X., Wei, Y., Chang, L., Zhang, J., Qu, Y., & Hashimoto, K. (2021) · European Archives of Psychiatry and Clinical Neuroscience · doi:10.1007/s00406-021-01325-0 · Cited by 32
A novel molecular class that recruits HDAC/MECP2 complexes to PU.1 motifs reduces neuroinflammation
Ralvenius, W. T., Mungenast, A. E., Woolf, H., Huston, M. M., Gillingham, T. Z., Godin, S. K., Penney, J., Cam, H. P., Gao, F., Fernandez, C. G., et al. (2023) · Journal of Experimental Medicine · doi:10.1084/jem.20222105 · Cited by 29
“Amyloid-β – associated microglia were shown to secrete extracellular vesicles that contain phosphorylated tau and their depletion abrogated tau propagation (Clayton et al., 2021).”
Karaahmet, B., Le, L., Mendes, M. S., Majewska, A. K., & O’Banion, M. K. (2022) · Journal of Neuroinflammation · doi:10.1186/s12974-022-02532-9 · Cited by 29
Gut microbiota, pathogenic proteins and neurodegenerative diseases
Wei, W., Wang, S., Xu, C., Zhou, X., Lian, X., He, L., & Li, K. (2022) · Frontiers in Microbiology · doi:10.3389/fmicb.2022.959856 · Cited by 30
Gabrielli, M., Tozzi, F., Verderio, C., & Origlia, N. (2022) · Cells · doi:10.3390/cells12010063 · Cited by 34
Pait, M. C., Kaye, S. D., Su, Y., Kumar, A., Singh, S., Gironda, S. C., Vincent, S., Anwar, M., Carroll, C. M., Snipes, J. A., et al. (2024) · Journal of Extracellular Vesicles · doi:10.1002/jev2.12398 · Cited by 29
Zhuang, X., Jie, L., Song, Y., Ban, R., Zhao, X., Xia, Z., Wang, Z., & Zhang, G. (2024) · NeuroMolecular Medicine · doi:10.1007/s12017-024-08815-z · Cited by 33
Zheng, Q., Yu, Y., Su, Y., Cao, B., Shao, H., & Yang, J. (2023) · Inflammation · doi:10.1007/s10753-023-01875-6 · Cited by 28
Sattarov, R., Havers, M., Orbjörn, C., Stomrud, E., Janelidze, S., Laurell, T., & Mattsson, N. (2024) · Scientific Reports · doi:10.1038/s41598-024-75406-0 · Cited by 29
St‐Pierre, M., VanderZwaag, J., Loewen, S. M., & Tremblay, M. (2022) · Frontiers in Cellular Neuroscience · doi:10.3389/fncel.2022.932572 · Cited by 27
St‐Pierre, M., Carrier, M., Ibáñez, F. G., Khakpour, M., Wallman, M., Parent, M., & Tremblay, M. (2023) · Journal of Neuroinflammation · doi:10.1186/s12974-023-02752-7 · Cited by 28
Zhang, Q., Yi, Y., Chen, T., Ai, Y., Chen, Z., Liu, G., Tang, Z., Chen, J., Xu, T., Chen, X., et al. (2025) · Journal of Nanobiotechnology · doi:10.1186/s12951-025-03390-2 · Cited by 27
Vaz, M., Martins, T. S., & Henriques, A. G. (2022) · Journal of Neurochemistry · doi:10.1111/jnc.15697 · Cited by 25
Auger, A., Faidi, R., Rickman, A. D., Peña-Martinez, C., Fajfer, A., Carling, J., Hilyard, A., Ali, M., Ono, R., Cleveland, C., et al. (2025) · npj Dementia · doi:10.1038/s44400-025-00011-5 · Cited by 31
Hemonnot-Girard, A.-L., Meersseman, C., Pastore, M., Garcia, V., Linck, N., Rey, C., Chebbi, A., Jeanneteau, F., Ginsberg, S. D., Lachuer, J., et al. (2022) · Journal of Neuroinflammation · doi:10.1186/s12974-022-02581-0 · Cited by 24
Integrating amyloid and tau imaging with proteomics and genomics in Alzheimer’s disease
Vilkaite, G., Vogel, J. W., & Mattsson, N. (2024) · Cell Reports Medicine · doi:10.1016/j.xcrm.2024.101735 · Cited by 25
Microglia internalize tau monomers and fibrils using distinct receptors but similar mechanisms
Falkon, K. F., Danford, L., Kuri, E. G., Esquinca‐Moreno, P., Señeriz, Y. L. P., Smith, S. A., Wickline, J. L., Louwrier, A., McPhail, J. A., Sayre, N. L., et al. (2024) · Alzheimer s & Dementia · doi:10.1002/alz.14418 · Cited by 26
Emerging Roles of Cells and Molecules of Innate Immunity in Alzheimer’s Disease
Tamburini, B., Badami, G. D., Manna, M. P. L., Azgomi, M. S., Caccamo, N., & Dieli, F. (2023) · International Journal of Molecular Sciences · doi:10.3390/ijms241511922 · Cited by 22
Repurposing of pexidartinib for microglia depletion and renewal
Weyer, M.-P., Strehle, J., Schäfer, M. K. E., & Tegeder, I. (2023) · Pharmacology & Therapeutics · doi:10.1016/j.pharmthera.2023.108565 · Cited by 23
Takatori, S., Kondo, M., & Tomita, T. (2025) · Inflammation and Regeneration · doi:10.1186/s41232-025-00383-4 · Cited by 28
Revolution of AAV in Drug Discovery: From Delivery System to Clinical Application
Yin, L., He, H., Zhang, H., Shang, Y., Fu, C., Wu, S., & Jin, T. (2025) · Journal of Medical Virology · doi:10.1002/jmv.70447 · Cited by 23
Microglia in brain aging: An overview of recent basic science and clinical research developments
Fan, H., Zhang, M., Wen, J., Wang, S., Yuan, M., Sun, H., Shu, L., Xu, Y., Pu, Y., & Cai, Z. (2023) · Journal of Biomedical Research · doi:10.7555/jbr.37.20220220 · Cited by 23
Herron, S., Delpech, J.-C., Madore, C., & Ikezu, T. (2022) · STAR Protocols · doi:10.1016/j.xpro.2022.101670 · Cited by 24
Self-citationISGylation is induced in neurons by demyelination driving ISG15-dependent microglial activation
Clarkson, B. D. S., Grund, E. M., David, K., Johnson, R. K., & Howe, C. L. (2022) · Journal of Neuroinflammation · doi:10.1186/s12974-022-02618-4 · Cited by 23
The innate immune response in tauopathies
Johnson, A. M., & Lukens, J. R. (2023) · European Journal of Immunology · doi:10.1002/eji.202250266 · Cited by 22
Exosomes in multiple sclerosis and Alzheimer's disease – Adversary and ally
Tang, N. (2023) · Biomedical Journal · doi:10.1016/j.bj.2023.100665 · Cited by 21
Song, X., Zhou, H.-Y., Sun, Y.-Y., & Huang, H. (2021) · Journal of Alzheimer s Disease · doi:10.3233/jad-210337 · Cited by 20
The crosstalk between extracellular matrix proteins and Tau
Chinnathambi, S., & Desale, S. E. (2024) · Advances in protein chemistry and structural biology · doi:10.1016/bs.apcsb.2024.04.002 · Cited by 19
Primary cilia-mediated regulation of microglial secretion in Alzheimer’s disease
Yeo, S., Jang, J., Jung, H. J., Lee, H., & Choe, Y. (2023) · Frontiers in Molecular Biosciences · doi:10.3389/fmolb.2023.1250335 · Cited by 18
Exosomes for the diagnosis and treatment of dementia
Joo, H. S., Jeon, H. Y., Hong, E. B., Kim, H.-Y., & Lee, J. M. (2023) · Current Opinion in Psychiatry · doi:10.1097/yco.0000000000000842 · Cited by 18
Singhaarachchi, P. H., Antal, P., Calon, F., Culmsee, C., Delpech, J.-C., Feldotto, M., Geertsema, J., Hoeksema, E. E., Kőrösi, A., Layé, S., et al. (2024) · Neuroscience & Biobehavioral Reviews · doi:10.1016/j.neubiorev.2024.105724 · Cited by 20
Self-citationGao, R., Gao, Y., Su, W., & Wang, R. (2025) · Aging and Disease · doi:10.14336/ad.2024.1629 · Cited by 18
Monitoring neurodegeneration through brain-derived extracellular vesicles in biofluids
Torrini, F., Gil-García, M., Cardellini, J., Frigerio, R., Basso, M., Gori, A., & Arosio, P. (2025) · Trends in Pharmacological Sciences · doi:10.1016/j.tips.2025.03.006 · Cited by 18
Severe histomorphological alterations in post‐mortem olfactory glomeruli in Alzheimer’s disease
Son, G., Steinbusch, H. W. M., López‐Iglesias, C., Moon, C., & Jahanshahi, A. (2021) · Brain Pathology · doi:10.1111/bpa.13033 · Cited by 16
Metadata
- Authors
- Clayton, K., Delpech, J. C., Herron, S., Iwahara, N., Ericsson, M., Saito, T., Saido, T. C., Ikezu, S., & Ikezu, T.
- Affiliations
- Boston University (US)
- Harvard University (US)
- RIKEN Center for Brain Science (JP)
- Corresponding author
- Ikezu, Tsuneya
- ORCID
- Venue
- Molecular Neurodegeneration
- Published
- 2021-03-22
- Volume
- 16
- Issue
- 1
- Pages
- 18-18
- ISSN
- 1750-1326 (ISSN-L)
- PMC
- PMC7986521
- OpenAlex
- W3137321433
- Cited by
- 245
- References
- 73
- Citations by year
- 2026: 35 · 2025: 42 · 2024: 49 · 2023: 43 · 2022: 49 · 2021: 26
- FWCI
- 26.24
- Type
- journal article
- Language
- en
- Update notices
- correction (2021-04-14)
- Open access
- gold
- doi.org
- Locations
- Molecular Neurodegeneration (publishedVersion, cc-by)
- bioRxiv (Cold Spring Harbor Laboratory) (acceptedVersion)
- PubMed Central (publishedVersion, cc-by)
- PubMed (publishedVersion)
- HAL (submittedVersion, cc-by)
- DOAJ (DOAJ: Directory of Open Access Journals) (submittedVersion, cc-by-sa)
- OpenBU (Boston University) (submittedVersion)
- Oskar-Bordeaux (Universite de Bordeaux) (submittedVersion, cc-by)
- Funders
- Alzheimer's Association (DVT-14-320835)
- BrightFocus Foundation (A2016551S)
- Cure Alzheimer's Fund (N/A)
- National Institute on Aging (R01 AG066429, RF1 AG054199, R56 AG057469, P30 AG0138423, F31 AG057170)
- NIGMS (T32 GM008541)
- Topics
- Life Sciences › Neuroscience › Cellular and Molecular Neuroscience › Alzheimer's disease research and treatments
- Life Sciences › Neuroscience › Neurology › Neuroinflammation and Neurodegeneration Mechanisms
- Life Sciences › Biochemistry, Genetics and Molecular Biology › Molecular Biology › Extracellular vesicles in disease
- Keywords
- microglia, extracellular vesicles, tau propagation, Alzheimer's disease, amyloid plaques, PLX5622, CSF1R inhibition, microglial depletion, CD9, TSG101, medial entorhinal cortex, dentate gyrus, dystrophic neurites, tau phosphorylation, plaque-associated microglia, disease progression
- MeSH terms
- Extracellular Vesicles, Animals, Female, Genetic Vectors, Humans, Injections, Male, Mice, Inbred C57BL, Organic Chemicals, Recombinant Proteins, Receptors, Granulocyte-Macrophage Colony-Stimulating Factor, Neurites, Amyloid beta-Protein Precursor, tau Proteins, Point Mutation, Microglia, Entorhinal Cortex, Dentate Gyrus, Mutation, Missense, Mice, Gene Knock-In Techniques, Plaque, Amyloid, Protein Aggregation, Pathological
About these checks
Registry, retraction, Cites and statistics results are computed, not judged, with one exception: a printed reference that no index lists is read once by a model before it counts as a citation error. Claims are extracted by a model and kept only when their quote appears verbatim in the text; each cited source is then checked, with a model’s help, for whether it says what the claim relies on. Those verdicts can be wrong — read the claim’s quote and the cited source before relying on one.
Statistics and arithmetic are recomputed, not judged.
Confidence bands are shown only for fields calibrated on our annotated test set. None is calibrated yet, so no band is shown.
What counts as a claim ›How we measure confidence ›How we check this ›
Are you an author, or do you see a problem with this page? Request a review
