

The DOI matches its Crossref record; 69 of the 69 references it cites were found in a registry or an index.
Trem2 deletion enhances tau dispersion and pathology through microglia exosomes
Open accessAbstract
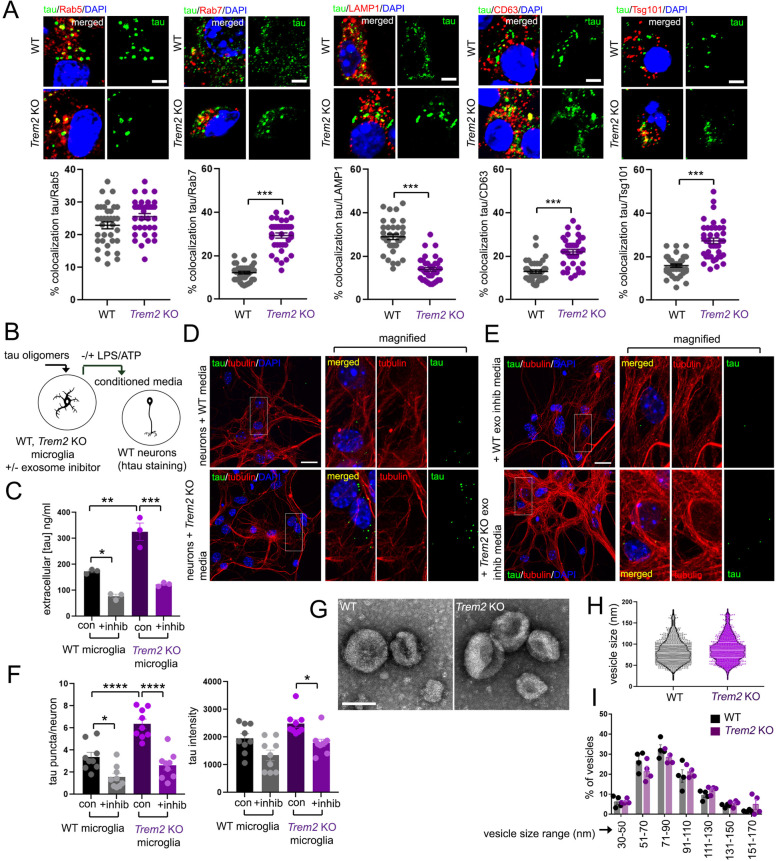
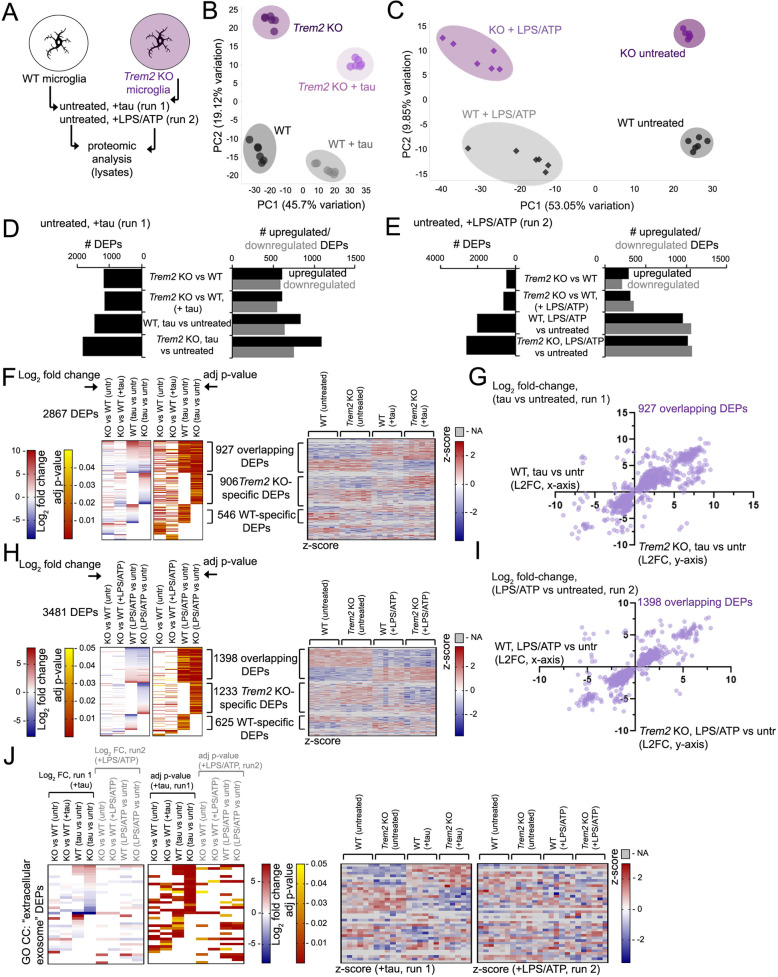
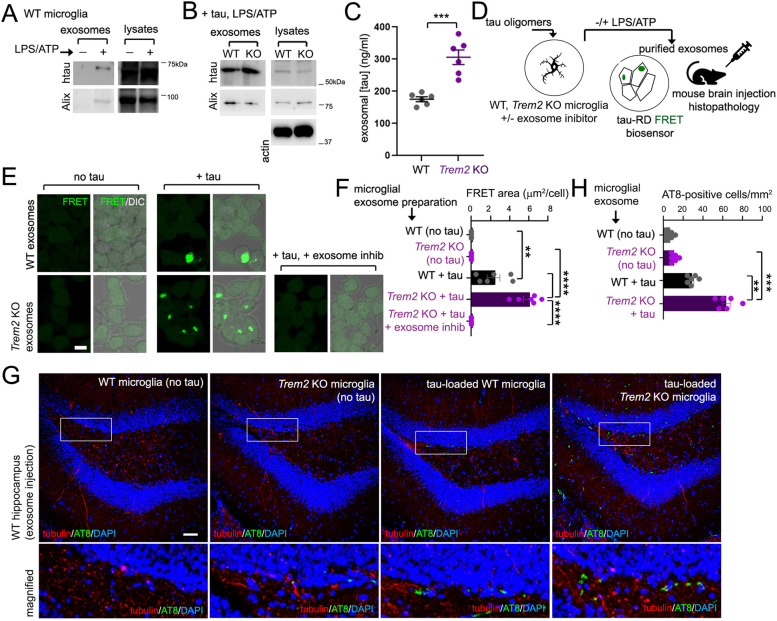
Background: Alzheimer’s disease (AD) is a neurodegenerative disorder that manifests sequential Aβ and tau brain pathology with age-dependent onset. Variants in the microglial immune receptor TREM2 are associated with enhanced risk of onset in sporadic Alzheimer’s disease (AD). While recent studies suggest TREM2 dysfunction can aggravate tau pathology, mechanisms underlying TREM2-dependent modulation of tau pathology remains elusive. Methods: Here, we characterized differences in progressive tau spreading from the medial entorhinal cortex (MEC) to the hippocampus in wildtype (WT) and Trem2 knockout (KO) mice by injection of AAV-P301L tau into the MEC, and correlated changes in hippocampal tau histopathology with spatial and fear memory. We also compared effects of intraneuronal dispersion between cultured microglia and neurons using a microfluidic dispersion assay, analyzed differences in microglial tau trafficking following uptake, and quantified exosomal tau secretion and pathogenicity from purified WT and Trem2 KO exosomes. Results: Trem2 deletion in mice (Trem2 KO) can enhance tau spreading from the medial entorhinal cortex (MEC) to the hippocampus, which coincides with impaired synaptic function and memory behavior. Trem2 deletion in microglia enhances intraneuronal dispersion of tau in vitro between neuronal layers cultured in a microfluidic chamber, and the presence of exosome inhibitors can significantly reduce tau in exosomes and extracellular media from tau-loaded microglia. Although microglial Trem2 deletion has no effect on tau uptake, Trem2 deletion enhances distribution to endosomal and cellular pre-exosomal compartments following internalization. Trem2 deletion has little effect on exosome size, however, proteomic analysis indicates that Trem2 deletion can modulate changes in the microglial proteomic landscape with tau and LPS/ATP treatment conditions associated with exosome induction. Furthermore, exosomes from Trem2 KO microglia show elevated tau levels, and feature enhanced tau-seeding capacity in a tau FRET reporter line compared to exosomes from WT microglia. Conclusion: Together, our results reveal a role for Trem2 in suppressing exosomal tau pathogenicity, and demonstrates that Trem2 deletion can enhance tau trafficking, distribution and seeding through microglial exosomes. Graphical abstract:
Overview
The claims and statistics of this paper haven’t been checked yet.
Run the check — free, no account needed. It reads the open-access text and checks the sources it cites.
Integrity signals
Registry
Cites
Statistics
Figures
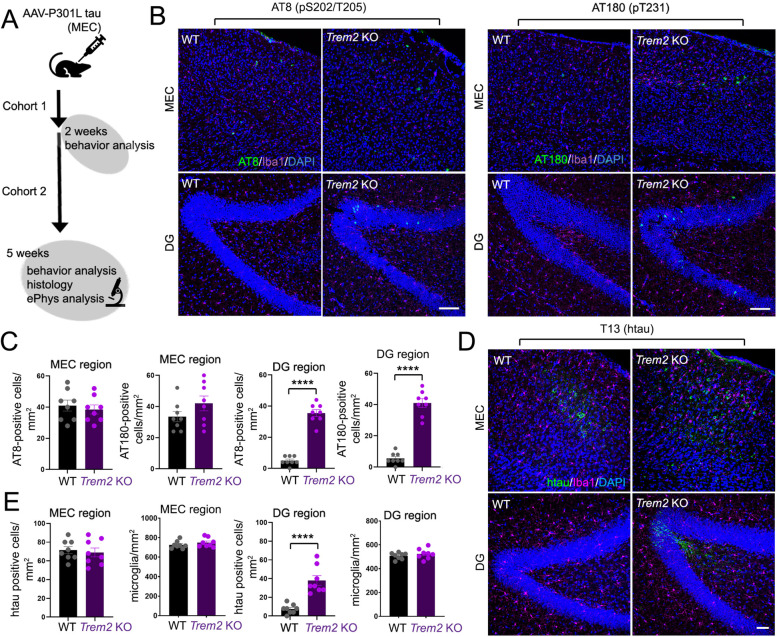
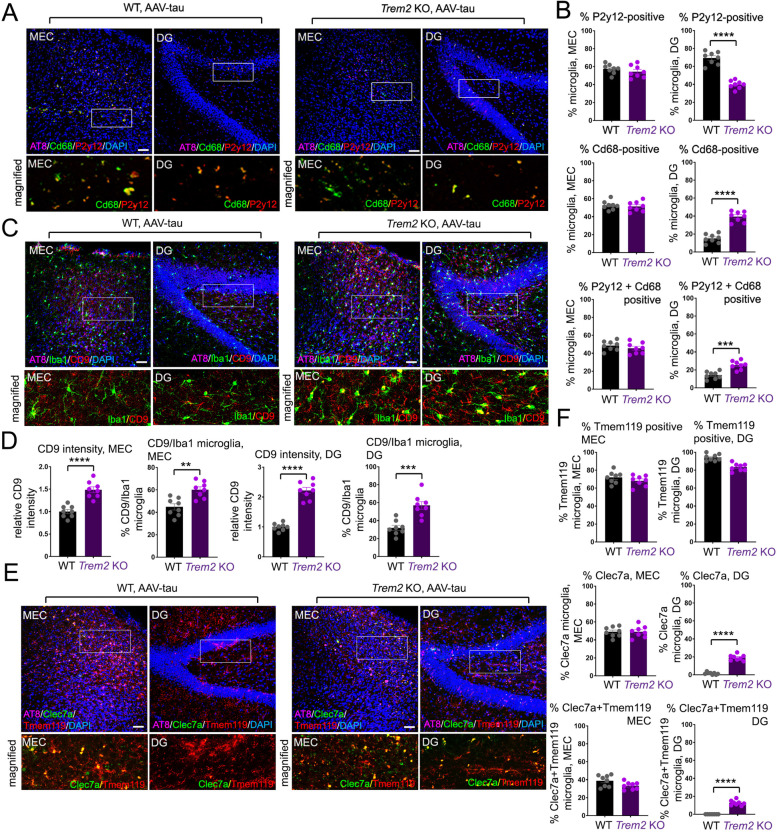
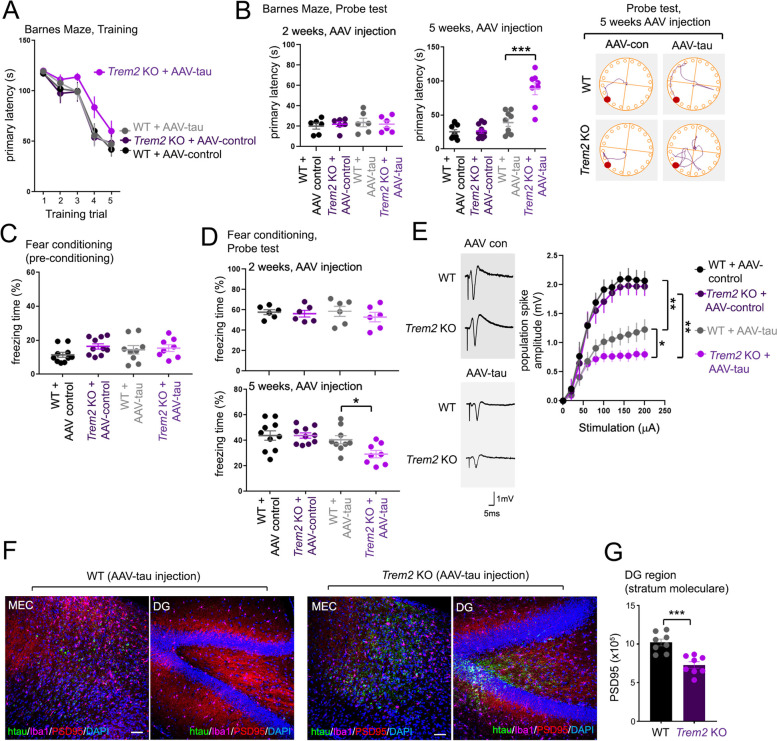
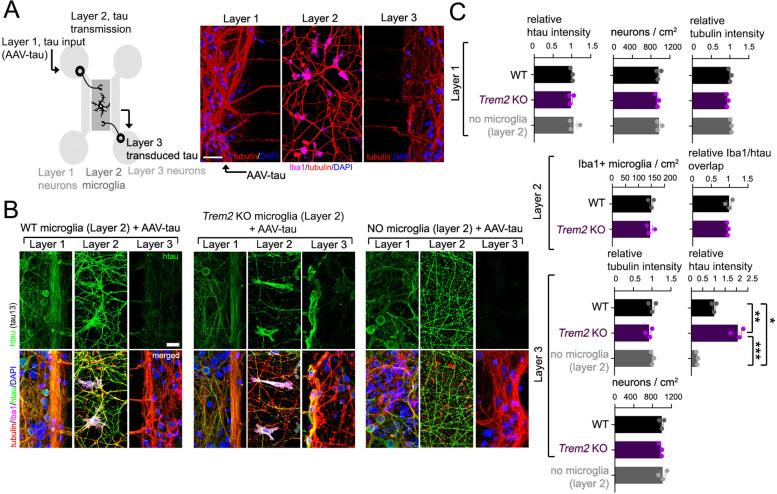
Verification
Claims the paper makes
The claims and statistics of this paper haven’t been checked yet.
Run the check — free, no account needed. It reads the open-access text and checks the sources it cites.
Claims other papers make about this one
Each is checked against this paper’s own text: does it say what the citing paper says it does?
The cited source says what the claim attributes to it.
In the citing paper
“in vitro experiments suggest that microglia or macrophage uptake of tau does not depend on TREM2 expression [39,43].”
From TREM2-Deficient Microglia Attenuate Tau Spreading In Vivo (2023) · cites this paper as [43]
The cited source says what the claim attributes to it.
In the citing paper
“they suggested that TREM2 deletion promotes tau trafficking to late endosome/pre-exosomal compartments [43].”
From TREM2-Deficient Microglia Attenuate Tau Spreading In Vivo (2023) · cites this paper as [43]
The cited source says what the claim attributes to it.
In the citing paper
“a recent study using the adeno-associated virus (AAV) expression of P301L tau showed that TREM2 deletion enhanced tau spreading from the medial entorhinal cortex (MEC) to the hippocampal dentate gyrus (DG) [43].”
From TREM2-Deficient Microglia Attenuate Tau Spreading In Vivo (2023) · cites this paper as [43]
The cited source says what the claim attributes to it.
In the citing paper
“The authors demonstrated that TREM2 deletion aggravates tau spreading, possibly through microglial extracellular exosomes.”
From TREM2-Deficient Microglia Attenuate Tau Spreading In Vivo (2023) · cites this paper as [43]
In the citing paper
“Furthermore, Zhu et al. reveal that TREM2 deficiency exacerbates pathological tau propagation via microglial exosomes [196].”
From Tau and neuroinflammation in Alzheimer’s disease: interplay mechanisms and clinical translation (2023) · cites this paper as [196]
Self-check
Percentages, sums and reported differences re-computed from the paper’s own numbers.
The self-check needs the paper’s full text.
Citations
Cites
Systematic and integrative analysis of large gene lists using DAVID bioinformatics resources
Huang, D. W., Sherman, B. T., & Lempicki, R. A. (2009) · Nature Protocols · doi:10.1038/nprot.2008.211 · Cited by 35,890
Neuropathological stageing of Alzheimer-related changes.
Braak, H., & Braak, E. (1991) · Acta Neuropathologica · doi:10.1007/bf00308809 · Cited by 16,123
Huang, D. W., Sherman, B. T., & Lempicki, R. A. (2009) · Nucleic Acids Research · doi:10.1093/nar/gkn923 · Cited by 14,108
A Unique Microglia Type Associated with Restricting Development of Alzheimer’s Disease
Keren-Shaul, H., Spinrad, A., Weiner, A., Matcovitch-Natan, O., Dvir-Szternfeld, R., Ulland, T. K., David, E., Baruch, K., Lara-Astaiso, D., Toth, B., et al. (2017) · Cell · doi:10.1016/j.cell.2017.05.018 · Cited by 5,493
Inflammation and Alzheimer’s disease
Akiyama, H. (2000) · Neurobiology of Aging · doi:10.1016/s0197-4580(00)00124-x · Cited by 4,514
TREM2 Variants in Alzheimer's Disease
Guerreiro, R., Wojtas, A., Bras, J., Carrasquillo, M., Rogaeva, E., Majounie, E., Cruchaga, C., Sassi, C., Kauwe, J. S. K., Younkin, S., et al. (2013) · New England Journal of Medicine · doi:10.1056/nejmoa1211851 · Cited by 3,020
Krasemann, S., Madore, C., Cialic, R., Baufeld, C., Calcagno, N., El Fatimy, R., Beckers, L., O’Loughlin, E., Xu, Y., Fanek, Z., et al. (2017) · Immunity · doi:10.1016/j.immuni.2017.08.008 · Cited by 2,979
Variant of TREM2 Associated with the Risk of Alzheimer's Disease
Jonsson, T., Stefansson, H., Steinberg, S., Jonsdottir, I., Jonsson, P. V., Snaedal, J., Bjornsson, S., Huttenlocher, J., Levey, A. I., Lah, J. J., et al. (2013) · New England Journal of Medicine · doi:10.1056/nejmoa1211103 · Cited by 2,558
Memory deficits associated with senescence: A neurophysiological and behavioral study in the rat.
Barnes, C. A. (1979) · Journal of Comparative and Physiological Psychology · doi:10.1037/h0077579 · Cited by 2,088
Initiative, T. A. D. N., Hollingworth, P., CHARGE consortium, EADI1 consortium, Harold, D., Sims, R., Gerrish, A., Lambert, J.-C., Carrasquillo, M. M., Abraham, R., et al. (2011) · Nature Genetics · doi:10.1038/ng.803 · Cited by 1,997
Naj, A. C., Jun, G., Beecham, G. W., Wang, L.-S., Vardarajan, B. N., Buros, J., Gallins, P. J., Buxbaum, J. D., Jarvik, G. P., Crane, P. K., et al. (2011) · Nature Genetics · doi:10.1038/ng.801 · Cited by 1,901
Transmission and spreading of tauopathy in transgenic mouse brain
Clavaguera, F., Bolmont, T., Crowther, R. A., Abramowski, D., Frank, S., Probst, A., Fraser, G., Stalder, A. K., Beibel, M., Staufenbiel, M., et al. (2009) · Nature Cell Biology · doi:10.1038/ncb1901 · Cited by 1,803
Depletion of microglia and inhibition of exosome synthesis halt tau propagation
Asai, H., Ikezu, S., Tsunoda, S., Medalla, M., Luebke, J., Haydar, T., Wolozin, B., Butovsky, O., Kügler, S., & Ikezu, T. (2015) · Nature Neuroscience · doi:10.1038/nn.4132 · Cited by 1,591
NLRP3 inflammasome activation drives tau pathology
Ising, C., Venegas, C., Zhang, S., Scheiblich, H., Schmidt, S. V., Vieira-Saecker, A., Schwartz, S., Albasset, S., McManus, R. M., Tejera, D., et al. (2019) · Nature · doi:10.1038/s41586-019-1769-z · Cited by 1,487
ExoCarta: A Web-Based Compendium of Exosomal Cargo
Keerthikumar, S., Chisanga, D., Ariyaratne, D., Saffar, H. A., Anand, S., Zhao, K., Samuel, M., Pathan, M., Jois, M., Chilamkurti, N., et al. (2015) · Journal of Molecular Biology · doi:10.1016/j.jmb.2015.09.019 · Cited by 1,486
Propagation of Tau Pathology in a Model of Early Alzheimer's Disease
de Calignon, A., Polydoro, M., Suárez-Calvet, M., William, C., Adamowicz, D. H., Kopeikina, K. J., Pitstick, R., Sahara, N., Ashe, K. H., Carlson, G. A., et al. (2012) · Neuron · doi:10.1016/j.neuron.2011.11.033 · Cited by 1,427
TREM2 Maintains Microglial Metabolic Fitness in Alzheimer’s Disease
Ulland, T. K., Song, W. M., Huang, S. C.-C., Ulrich, J. D., Sergushichev, A., Beatty, W. L., Loboda, A. A., Zhou, Y., Cairns, N. J., Kambal, A., et al. (2017) · Cell · doi:10.1016/j.cell.2017.07.023 · Cited by 1,263
Propagation of Tau Misfolding from the Outside to the Inside of a Cell
Frost, B., Jacks, R. L., & Diamond, M. I. (2009) · Journal of Biological Chemistry · doi:10.1074/jbc.m808759200 · Cited by 1,252
PET Imaging of Tau Deposition in the Aging Human Brain
Schöll, M., Lockhart, S. N., Schonhaut, D. R., O’Neil, J. P., Janabi, M., Ossenkoppele, R., Baker, S. L., Vogel, J. W., Faria, J., Schwimmer, H. D., et al. (2016) · Neuron · doi:10.1016/j.neuron.2016.01.028 · Cited by 1,214
ExoCarta 2012: database of exosomal proteins, RNA and lipids
Mathivanan, S., Fahner, C. J., Reid, G. E., & Simpson, R. J. (2011) · Nucleic Acids Research · doi:10.1093/nar/gkr828 · Cited by 1,096
Choi, M., Chang, C.-Y., Clough, T., Broudy, D., Killeen, T., MacLean, B., & Olga Vitek, A. (2014) · Bioinformatics · doi:10.1093/bioinformatics/btu305 · Cited by 1,041
Trans-Synaptic Spread of Tau Pathology In Vivo
Liu, L., Drouet, V., Wu, J., Witter, M. P., Small, S. A., Clelland, C. L. T., & Duff, K. (2012) · PLoS ONE · doi:10.1371/journal.pone.0031302 · Cited by 994
Molecular and cellular mechanisms underlying the pathogenesis of Alzheimer’s disease
Guo, T., Zhang, D., Zeng, Y., Huang, T. Y., Xu, H., & Zhao, Y. (2020) · Molecular Neurodegeneration · doi:10.1186/s13024-020-00391-7 · Cited by 994
Self-citationSaman, S., Kim, W., Raya, M., Visnick, Y., Miro, S., Saman, S., Jackson, B., McKee, A. C., Alvarez, V. E., Lee, N. C. Y., et al. (2012) · Journal of Biological Chemistry · doi:10.1074/jbc.m111.277061 · Cited by 985
Yeh, F. L., Wang, Y., Tom, I., Gonzalez, L. C., & Sheng, M. (2016) · Neuron · doi:10.1016/j.neuron.2016.06.015 · Cited by 943
ExoCarta: A compendium of exosomal proteins and RNA
Mathivanan, S., & Simpson, R. J. (2009) · PROTEOMICS · doi:10.1002/pmic.200900351 · Cited by 899
Neuronal activity enhances tau propagation and tau pathology in vivo
Wu, J. W., Hussaini, S. A., Bastille, I. M., Rodriguez, G. A., Mrejeru, A., Rilett, K., Sanders, D. W., Cook, C., Fu, H., Boonen, R. A. C. M., et al. (2016) · Nature Neuroscience · doi:10.1038/nn.4328 · Cited by 820
Engram cells retain memory under retrograde amnesia
Ryan, T. J., Roy, D. S., Pignatelli, M., Arons, A. L., & Tonegawa, S. (2015) · Science · doi:10.1126/science.aaa5542 · Cited by 789
TREM2 Is a Receptor for β-Amyloid that Mediates Microglial Function
Zhao, Y., Wu, X., Li, X., Jiang, L.-L., Gui, X., Liu, Y., Sun, Y., Zhu, B., Piña-Crespo, J. C., Zhang, M., et al. (2018) · Neuron · doi:10.1016/j.neuron.2018.01.031 · Cited by 763
Self-citationProteopathic tau seeding predicts tauopathy in vivo
Holmes, B. B., Furman, J. L., Mahan, T. E., Yamasaki, T. R., Mirbaha, H., Eades, W. C., Belaygorod, L., Cairns, N. J., Holtzman, D. M., & Diamond, M. I. (2014) · Proceedings of the National Academy of Sciences · doi:10.1073/pnas.1411649111 · Cited by 696
Regulation of Tau Pathology by the Microglial Fractalkine Receptor
Bhaskar, K., Konerth, M., Kokiko-Cochran, O. N., Cardona, A., Ransohoff, R. M., & Lamb, B. T. (2010) · Neuron · doi:10.1016/j.neuron.2010.08.023 · Cited by 639
Maphis, N., Xu, G., Kokiko-Cochran, O. N., Jiang, S., Cardona, A., Ransohoff, R. M., Lamb, B. T., & Bhaskar, K. (2015) · Brain · doi:10.1093/brain/awv081 · Cited by 595
Apolipoprotein E Is a Ligand for Triggering Receptor Expressed on Myeloid Cells 2 (TREM2)
Atagi, Y., Liu, C.-C., Painter, M. M., Chen, X.-F., Verbeeck, C., Zheng, H., Li, X., Rademakers, R., Kang, S. S., Xu, H., et al. (2015) · Journal of Biological Chemistry · doi:10.1074/jbc.m115.679043 · Cited by 587
Self-citationDynamics of Retrieval Strategies for Remote Memories
Goshen, I., Brodsky, M., Prakash, R., Wallace, J. L., Gradinaru, V., Ramakrishnan, C., & Deisseroth, K. A. (2011) · Cell · doi:10.1016/j.cell.2011.09.033 · Cited by 581
Spread of pathological tau proteins through communicating neurons in human Alzheimer’s disease
Vogel, J. W., Iturria‐Medina, Y., Strandberg, O. T., Smith, R. A., Levitis, E., Evans, A. C., Hansson, O., Initiative, A. D. N., Weiner, M. W., Aisen, P., et al. (2020) · Nature Communications · doi:10.1038/s41467-020-15701-2 · Cited by 537
Lee, S., Varvel, N. H., Konerth, M. E., Xu, G., Cardona, A. E., Ransohoff, R. M., & Lamb, B. T. (2010) · The American Journal of Pathology · doi:10.2353/ajpath.2010.100265 · Cited by 522 · cited 1×
“Deletion of the murine fractalkine receptor CX3CR1 was previously shown to enhance microglial activation and reduce Aβ pathology in APP/PS1 mouse models [40], and was associated with enhanced tau pathology and memory [10].”
BackgroundExosome release of β-catenin: a novel mechanism that antagonizes Wnt signaling
Chairoungdua, A., Smith, D. L., Pochard, P., Hull, M., & Caplan, M. (2010) · Journal of Cell Biology · doi:10.1083/jcb.201002049 · Cited by 514
Bertram, L., Lange, C., Mullin, K., Parkinson, M., Hsiao, M., Hogan, M. F., Schjeide, B. M. M., Hooli, B., DiVito, J., Ionita, I., et al. (2008) · The American Journal of Human Genetics · doi:10.1016/j.ajhg.2008.10.008 · Cited by 511
Bach, M. E., Hawkins, R. D., Osman, M., Kandel, E. R., & Mayford, M. R. (1995) · Cell · doi:10.1016/0092-8674(95)90010-1 · Cited by 487
ExoCarta as a resource for exosomal research
Simpson, R. J., Kalra, H., & Mathivanan, S. (2012) · Journal of Extracellular Vesicles · doi:10.3402/jev.v1i0.18374 · Cited by 399
Microglial NF-κB drives tau spreading and toxicity in a mouse model of tauopathy
Wang, C., Fan, L., Khawaja, R. R., Liu, B., Zhan, L., Kodama, L., Chin, M., Li, Y., Le, D., Zhou, Y., et al. (2022) · Nature Communications · doi:10.1038/s41467-022-29552-6 · Cited by 333
TREM2 function impedes tau seeding in neuritic plaques
Leyns, C. E. G., Gratuze, M., Narasimhan, S., Jain, N., Koscal, L. J., Jiang, H., Manis, M., Colonna, M., Lee, V. M. Y., Ulrich, J. D., et al. (2019) · Nature Neuroscience · doi:10.1038/s41593-019-0433-0 · Cited by 332
Tunneling nanotube (TNT)-mediated neuron-to neuron transfer of pathological Tau protein assemblies
Tardivel, M., Bégard, S., Bousset, L., Dujardin, S., Coens, A., Melki, R., Buée, L., & Colin, M. (2016) · Acta Neuropathologica Communications · doi:10.1186/s40478-016-0386-4 · Cited by 305
Trem2 restrains the enhancement of tau accumulation and neurodegeneration by β-amyloid pathology
Lee, S.-H., Meilandt, W. J., Xie, L., Gandham, V. D., Ngu, H., Barck, K. H., Rezzonico, M. G., Imperio, J., Lalehzadeh, G., Huntley, M. A., et al. (2021) · Neuron · doi:10.1016/j.neuron.2021.02.010 · Cited by 300
Bemiller, S. M., McCray, T. J., Allan, K., Formica, S. V., Xu, G., Wilson, G., Kokiko-Cochran, O. N., Crish, S. D., Lasagna-Reeves, C. A., Ransohoff, R. M., et al. (2017) · Molecular Neurodegeneration · doi:10.1186/s13024-017-0216-6 · Cited by 299
Microglia convert aggregated amyloid-β into neurotoxic forms through the shedding of microvesicles
Joshi, P., Turola, E., Ruiz, A., Bergami, A., Libera, D. D., Benussi, L., Giussani, P., Magnani, G., Comı, G., Legname, G., et al. (2013) · Cell Death and Differentiation · doi:10.1038/cdd.2013.180 · Cited by 289
The role of microglia in processing and spreading of bioactive tau seeds in Alzheimer’s disease
Hopp, S. C., Lin, Y., Oakley, D., Roe, A. D., DeVos, S. L., Hanlon, D., & Hyman, B. T. (2018) · Journal of Neuroinflammation · doi:10.1186/s12974-018-1309-z · Cited by 286
Unconventional Secretion Mediates the Trans-cellular Spreading of Tau
Katsinelos, T., Zeitler, M., Dimou, E., Karakatsani, A., Müller, H., Nachman, E., Steringer, J. P., de Almodóvar, C. R., Nickel, W., & Jahn, T. R. (2018) · Cell Reports · doi:10.1016/j.celrep.2018.04.056 · Cited by 274
Hou, J., Zhang, J., Cui, P., Zhou, Y., Liu, C., Wu, X., Ji, Y., Wang, S., Cheng, B., Ye, H., et al. (2021) · Journal of Clinical Investigation · doi:10.1172/jci135197 · Cited by 239
Constitutive secretion of tau protein by an unconventional mechanism
Chai, X., Dage, J. L., & Citron, M. (2012) · Neurobiology of Disease · doi:10.1016/j.nbd.2012.05.021 · Cited by 238
Cellular and pathological heterogeneity of primary tauopathies
Chung, D. C., Roemer, S. F., Petrucelli, L., & Dickson, D. W. (2021) · Molecular Neurodegeneration · doi:10.1186/s13024-021-00476-x · Cited by 232
Sayed, F. A., Telpoukhovskaia, M., Kodama, L., Li, Y., Zhou, Y., Le, D., Hauduc, A., Ludwig, C., Gao, F., Clelland, C., et al. (2018) · Proceedings of the National Academy of Sciences · doi:10.1073/pnas.1811411115 · Cited by 229 · cited 19×
“(B) Wildtype (WT) mice were injected with AAV‑GFP and AAV‑tau in combination (1 × 10⁹ AAV particles each), and GFP (green), AT8 (pS202, T305 tau, red) and DAPI (nuclei, blue) staining within the MEC and hippocampal dentate gyrus (DG) was imaged by confocal microscopy 5 weeks following injection.”
BackgroundInfluentialZhong, L., Wang, Z., Wang, D., Wang, Z., Martens, Y. A., Wu, L., Xu, Y., Wang, K., Li, J., Huang, R., et al. (2018) · Molecular Neurodegeneration · doi:10.1186/s13024-018-0247-7 · Cited by 222
Self-citationActivated microglia mitigate Aβ-associated tau seeding and spreading
Gratuze, M., Chen, Y., Parhizkar, S., Jain, N., Strickland, M. R., Serrano, J. R., Colonna, M., Ulrich, J. D., & Holtzman, D. M. (2021) · Journal of Experimental Medicine · doi:10.1084/jem.20210542 · Cited by 215
Attar, A., Liu, T., Chan, W.-T. C., Hayes, J., Nejad, M., Lei, K., & Bitan, G. (2013) · PLoS ONE · doi:10.1371/journal.pone.0080355 · Cited by 177
Xu, Y., Propson, N. E., Du, S., Xiong, W., & Zheng, H. (2021) · Proceedings of the National Academy of Sciences · doi:10.1073/pnas.2023418118 · Cited by 171
Secretion of tau via an unconventional non-vesicular mechanism
Merezhko, M., Brunello, C. A., Yan, X., Vihinen, H., Jokitalo, E., Uronen, R.-L., & Huttunen, H. J. (2018) · Cell Reports · doi:10.1016/j.celrep.2018.10.078 · Cited by 166
P2RX7 inhibitor suppresses exosome secretion and disease phenotype in P301S tau transgenic mice
Ruan, Z., Delpech, J.-C., Venkatesan Kalavai, S., Van Enoo, A. A., Hu, J., Ikezu, S., & Ikezu, T. (2020) · Molecular Neurodegeneration · doi:10.1186/s13024-020-00396-2 · Cited by 150
Artificial Association of Pre-stored Information to Generate a Qualitatively New Memory
Ohkawa, N., Saitoh, Y., Suzuki, A. Z., Tsujimura, S., Murayama, E., Kosugi, S., Nishizono, H., Matsuo, M., Takahashi, Y., Nagase, M., et al. (2015) · Cell Reports · doi:10.1016/j.celrep.2015.03.017 · Cited by 129
LRP1 modulates the microglial immune response via regulation of JNK and NF‐ΚB signaling pathways
Yang, L., Liu, C.-C., Zheng, H., Kanekiyo, T., Atagi, Y., Jia, L., Wang, D., N’songo, A., Can, D., Xu, H., et al. (2016) · Journal of Neuroinflammation · doi:10.1186/s12974-016-0772-7 · Cited by 129
Self-citationJiang, T., Tan, L., Zhu, X.-C., Zhou, J.-S., Cao, L., Tan, M.-S., Wang, H.-F., Chen, Q., Zhang, Y.-D., & Yu, J.-T. (2015) · Neurobiology of Aging · doi:10.1016/j.neurobiolaging.2015.08.019 · Cited by 111
Hansson, O., Grothe, M. J., Strandberg, T. O., Ohlsson, T. G., Hägerström, D., Jögi, J., Smith, R. A., & Schöll, M. (2017) · Frontiers in Neuroscience · doi:10.3389/fnins.2017.00167 · Cited by 102
Partial reduction of microglia does not affect tau pathology in aged mice
Bennett, R. E., Bryant, A., Hu, M., Robbins, A. B., Hopp, S. C., & Hyman, B. T. (2018) · Journal of Neuroinflammation · doi:10.1186/s12974-018-1348-5 · Cited by 91
Delizannis, A. T., Nonneman, A., Tsering, W., Bondt, A. D., den Wyngaert, I. V., Zhang, B., Meymand, E. S., Olufemi, M. F., Koivula, P. P., Maimaiti, S., et al. (2021) · Acta Neuropathologica Communications · doi:10.1186/s40478-021-01251-1 · Cited by 71
Effects of endogenous β‐amyloid overproduction on tau phosphorylation in cell culture
Wang, Z., Li, H., Li, X., Zhang, Q., Tian, Q., Wang, Q., Xu, H., & Wang, J. (2006) · Journal of Neurochemistry · doi:10.1111/j.1471-4159.2006.03956.x · Cited by 65
Self-citationSORLA attenuates EphA4 signaling and amyloid β–induced neurodegeneration
Huang, T. Y., Zhao, Y., Jiang, L.-L., Li, X., Liu, Y., Sun, Y., Piña-Crespo, J. C., Zhu, B., Masliah, E., Willnow, T. E., et al. (2017) · Journal of Experimental Medicine · doi:10.1084/jem.20171413 · Cited by 50
Self-citationNeuronal tau species transfer to astrocytes and induce their loss according to tau aggregation state
de Gérando, A. M., d’Orange, M., Augustin, E., Joséphine, C., Aurégan, G., Gaudin, M., Guillermier, M., Hérard, A., Stimmer, L., Petit, F., et al. (2021) · Brain · doi:10.1093/brain/awab011 · Cited by 50
Stupack, J., Xiong, X.-P., Jiang, L.-L., Zhang, T., Zhou, L., Campos, A. R., Ranscht, B., Mobley, W. C., Pasquale, E. B., Xu, H., et al. (2020) · Journal of Neuroscience · doi:10.1523/jneurosci.0723-20.2020 · Cited by 30
Self-citationMallach, A., Gobom, J., Zetterberg, H., Hardy, J., Piers, T. M., Wray, S., & Pocock, J. M. (2021) · Brain Communications · doi:10.1093/braincomms/fcab009 · Cited by 26
Cited by
Sorted by citations
Tau and neuroinflammation in Alzheimer’s disease: interplay mechanisms and clinical translation
Chen, Y., & Yu, Y. (2023) · Journal of Neuroinflammation · doi:10.1186/s12974-023-02853-3 · Cited by 516
Cellular and pathological functions of tau
Bravo, C. P., Naguib, S. A., & Gan, L. (2024) · Nature Reviews Molecular Cell Biology · doi:10.1038/s41580-024-00753-9 · Cited by 271
TREM2: Potential therapeutic targeting of microglia for Alzheimer's disease
Li, Y., Xu, H., Wang, H., Yang, K., Luan, J., & Wang, S. (2023) · Biomedicine & Pharmacotherapy · doi:10.1016/j.biopha.2023.115218 · Cited by 133
Self-citationImmune Activation in Alzheimer Disease
Mary, A., Mancuso, R., & Heneka, M. T. (2024) · Annual Review of Immunology · doi:10.1146/annurev-immunol-101921-035222 · Cited by 82
Targeting tau in Alzheimer's disease: from mechanisms to clinical therapy
Ye, J., Wan, H., Chen, S., & Liu, G. (2023) · Neural Regeneration Research · doi:10.4103/1673-5374.385847 · Cited by 74
Metadata
- Authors
- Zhu, B., Liu, Y., Hwang, S., Archuleta, K., Huang, H., Campos, A., Murad, R., Piña-Crespo, J., Xu, H., & Huang, T. Y.
- Affiliations
- Sanford Burnham Prebys Medical Discovery Institute (US)
- Chongqing Medical University (CN)
- Corresponding author
- Xu, Huaxi
- Huang, Timothy Y.
- Venue
- Molecular Neurodegeneration
- Published
- 2022-09-02
- Volume
- 17
- Issue
- 1
- Pages
- 58-58
- ISSN
- 1750-1326 (ISSN-L)
- PMC
- PMC9438095
- OpenAlex
- W4294169024
- Cited by
- 127
- References
- 69
- Citations by year
- 2026: 28 · 2025: 35 · 2024: 35 · 2023: 26 · 2022: 3
- FWCI
- 15.33
- Type
- journal article
- Language
- en
- Open access
- gold
- doi.org
- Locations
- Molecular Neurodegeneration (publishedVersion, cc-by)
- PubMed Central (publishedVersion, cc-by)
- PubMed (publishedVersion)
- DOAJ (DOAJ: Directory of Open Access Journals) (submittedVersion, cc-by-sa)
- Funders
- National Institute on Aging (R21 AG070676, RF1 056130)
- Topics
- Life Sciences › Neuroscience › Cellular and Molecular Neuroscience › Alzheimer's disease research and treatments
- Life Sciences › Neuroscience › Neurology › Neuroinflammation and Neurodegeneration Mechanisms
- Life Sciences › Biochemistry, Genetics and Molecular Biology › Molecular Biology › Extracellular vesicles in disease
- Keywords
- TREM2, tau pathology, Alzheimer's disease, microglia, exosomes, tau propagation, tau seeding, medial entorhinal cortex, hippocampus, memory impairment, TREM2 knockout mice
- MeSH terms
- Alzheimer Disease, Animals, Membrane Glycoproteins, Receptors, Immunologic, Microglia, Mice, Knockout, Proteomics, Mice, Exosomes
About these checks
Registry, retraction, Cites and statistics results are computed, not judged, with one exception: a printed reference that no index lists is read once by a model before it counts as a citation error. Claims are extracted by a model and kept only when their quote appears verbatim in the text; each cited source is then checked, with a model’s help, for whether it says what the claim relies on. Those verdicts can be wrong — read the claim’s quote and the cited source before relying on one.
Statistics and arithmetic are recomputed, not judged.
Confidence bands are shown only for fields calibrated on our annotated test set. None is calibrated yet, so no band is shown.
What counts as a claim ›How we measure confidence ›How we check this ›
Are you an author, or do you see a problem with this page? Request a review
