

The DOI matches its Crossref record; 50 of the 50 references it cites were found in a registry or an index.
Elevation of brain magnesium prevents synaptic loss and reverses cognitive deficits in Alzheimer’s disease mouse model
Open accessAbstract
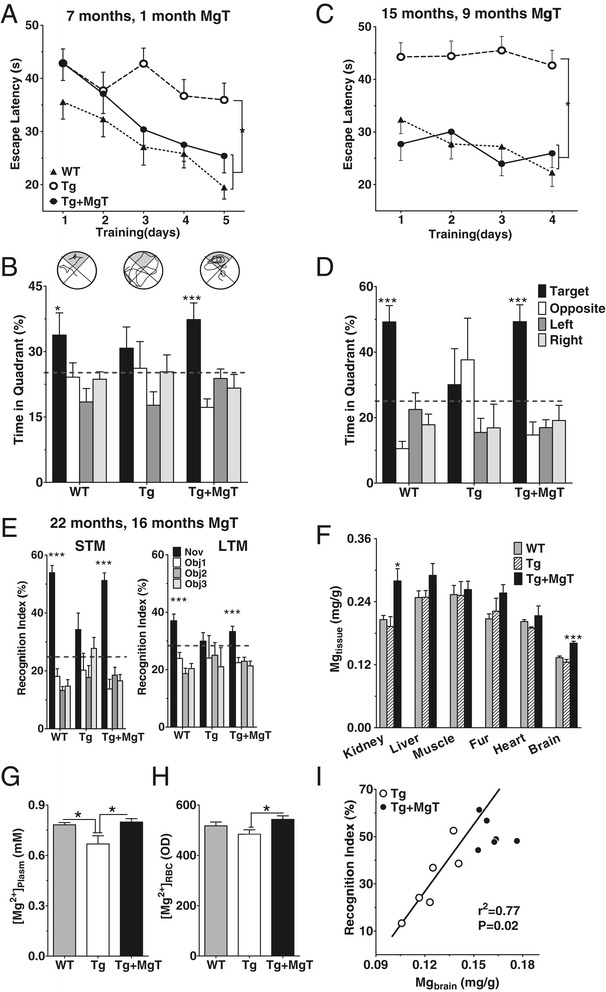
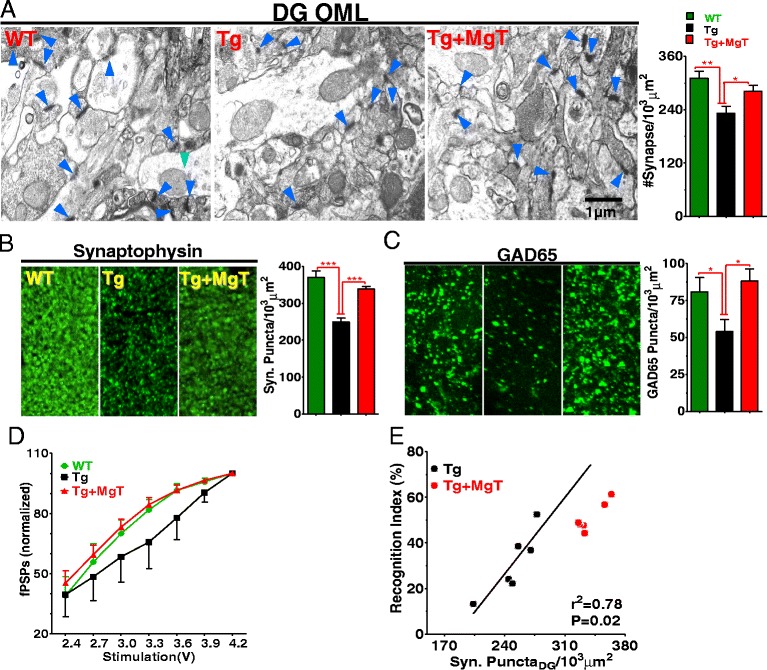
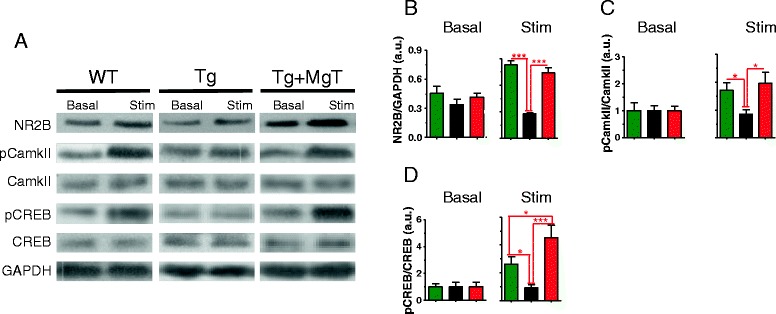
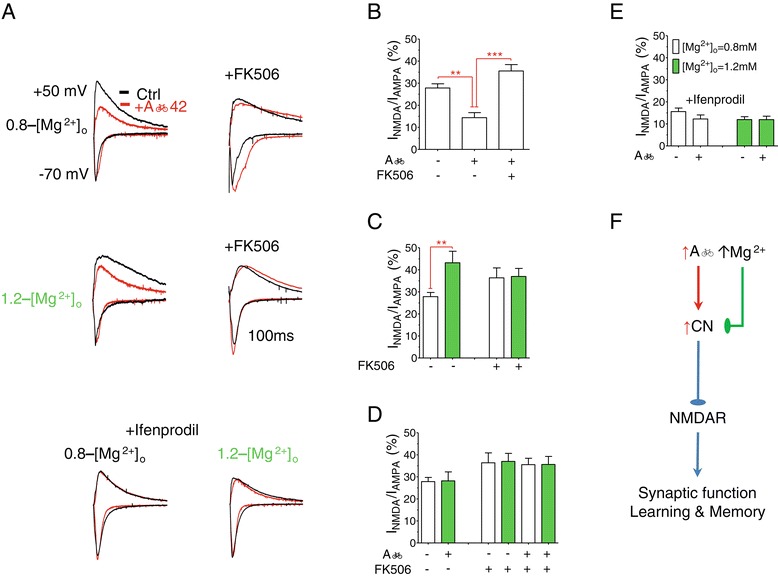
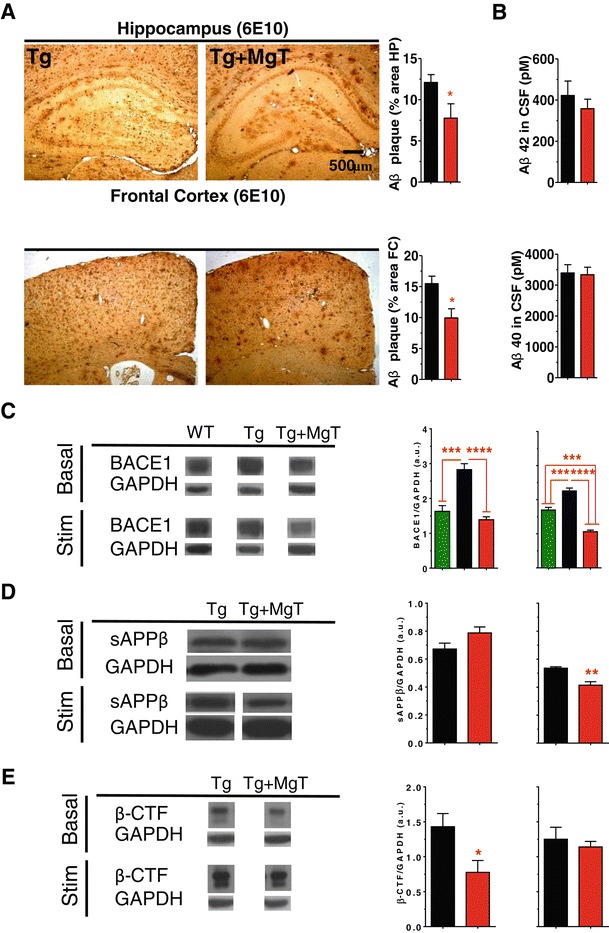
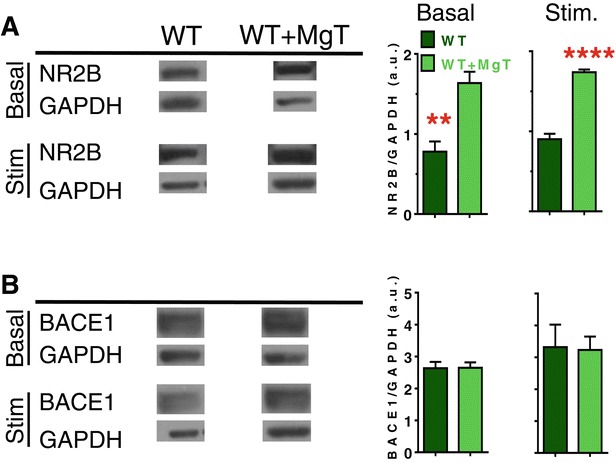
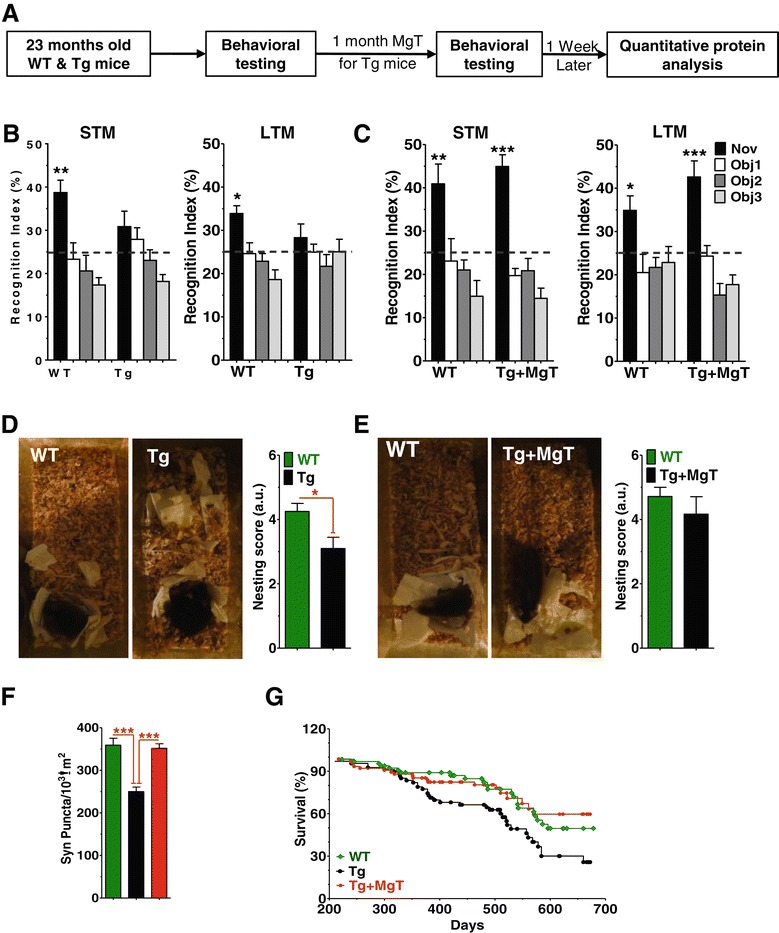
BACKGROUND: Profound synapse loss is one of the major pathological hallmarks associated with Alzheimer's disease, which might underlie memory impairment. Our previous work demonstrates that magnesium ion is a critical factor in controlling synapse density/plasticity. Here, we tested whether elevation of brain magnesium, using a recently developed compound (magnesium-L-threonate, MgT), can ameliorate the AD-like pathologies and cognitive deficits in the APPswe/PS1dE9 mice, a transgenic mouse model of Alzheimer's disease. RESULTS: MgT treatment reduced Aβ-plaque, prevented synapse loss and memory decline in the transgenic mice. Strikingly, MgT treatment was effective even when the treatment was given to the mice at the end-stage of their Alzheimer's disease-like pathological progression. To explore how elevation of brain magnesium ameliorates the AD-like pathologies in the brain of transgenic mice, we studied molecules critical for APP metabolism and signaling pathways implicated in synaptic plasticity/density. In the transgenic mice, the NMDAR signaling pathway was downregulated, while the BACE1 expression were upregulated. MgT treatment prevented the impairment of these signaling pathways, stabilized BACE1 expression and reduced sAPPβ and β-CTF in the transgenic mice. At the molecular level, elevation of extracellular magnesium prevented the high Aβ-induced reductions in synaptic NMDARs by preventing calcineurin overactivation in hippocampal slices. CONCLUSIONS: Our results suggest that elevation of brain magnesium exerts substantial synaptoprotective effects in a mouse model of Alzheimer's disease, and hence it might have therapeutic potential for treating Alzheimer's disease.
Overview
The claims and statistics of this paper haven’t been checked yet.
Run the check — free, no account needed. It reads the open-access text and checks the sources it cites.
Integrity signals
Registry
Cites
Statistics
Figures
Verification
Claims the paper makes
The claims and statistics of this paper haven’t been checked yet.
Run the check — free, no account needed. It reads the open-access text and checks the sources it cites.
Claims other papers make about this one
Each is checked against this paper’s own text: does it say what the citing paper says it does?
In the citing paper
“In addition, Mg2+ treatment can reduce soluble Aβ by stabilizing BACE-1 expression, thus reversing cognitive impairment and synaptic loss in AD mice [551].”
From Molecular and cellular mechanisms underlying the pathogenesis of Alzheimer’s disease (2020) · cites this paper as [551]
Self-check
Percentages, sums and reported differences re-computed from the paper’s own numbers.
The self-check needs the paper’s full text.
Citations
Cites
1 retracted
RETRACTED ARTICLE: APP binds DR6 to trigger axon pruning and neuron death via distinct caspases
Nikolaev, A., McLaughlin, T., O’Leary, D. D. M., & Tessier-Lavigne, M. (2009) · Nature · doi:10.1038/nature07767 · Cited by 992
RetractedDose translation from animal to human studies revisited.
Reagan‐Shaw, S., Nihal, M., & Ahmad, N. (2008) · The FASEB Journal · doi:10.1096/fj.07-9574lsf · Cited by 6,524
Place navigation impaired in rats with hippocampal lesions
Morris, R. G. M., Garrud, P., Rawlins, J. N. P., & O'Keefe, J. (1982) · Nature · doi:10.1038/297681a0 · Cited by 6,340
Hypothetical model of dynamic biomarkers of the Alzheimer's pathological cascade
Jack, C. R., Knopman, D. S., Jagust, W. J., Shaw, L. M., Aisen, P. S., Weiner, M. W., Petersen, R. C., & Trojanowski, J. Q. (2010) · The Lancet Neurology · doi:10.1016/s1474-4422(09)70299-6 · Cited by 4,806
Alzheimer's Disease Is a Synaptic Failure
Selkoe, D. J. (2002) · Science · doi:10.1126/science.1074069 · Cited by 4,420
Terry, R. D., Masliah, E., Salmon, D. P., Butters, N., DeTeresa, R., Hill, R., Hansen, L. A., & Katzman, R. (1991) · Annals of Neurology · doi:10.1002/ana.410300410 · Cited by 4,397
A new one-trial test for neurobiological studies of memory in rats. 1: behavioral data
Ennaceur, A., & Delacour, J. (1988) · Behavioural Brain Research · doi:10.1016/0166-4328(88)90157-x · Cited by 3,223
Synaptic Plasticity and Memory: An Evaluation of the Hypothesis
Martin, S. J., Grimwood, P. D., & Morris, R. G. M. (2000) · Annual Review of Neuroscience · doi:10.1146/annurev.neuro.23.1.649 · Cited by 2,794
Palop, J. J., Chin, J., Roberson, E. D., Wang, J., Thwin, M. T., Bien-Ly, N., Yoo, J., Ho, K. O., Yu, G.-Q., Kreitzer, A., et al. (2007) · Neuron · doi:10.1016/j.neuron.2007.07.025 · Cited by 1,653
Amyloid-β–induced neuronal dysfunction in Alzheimer's disease: from synapses toward neural networks
Palop, J. J., & Mucke, L. (2010) · Nature Neuroscience · doi:10.1038/nn.2583 · Cited by 1,651
Regulation of NMDA receptor trafficking by amyloid-β
Snyder, E. M., Nong, Y., Almeida, C. G., Paul, S., Moran, T., Choi, E. Y., Nairn, A. C., Salter, M. W., Lombroso, P. J., Gouras, G. K., et al. (2005) · Nature Neuroscience · doi:10.1038/nn1503 · Cited by 1,561
Altman, D. G., Carroli, G., Duley, L., Farrell, B., Moodley, J., Neilson, J., & Smith, D. (2002) · The Lancet · doi:10.1016/s0140-6736(02)08778-0 · Cited by 1,488
Alzheimer’s Disease: The Challenge of the Second Century
Holtzman, D. M., Morris, J. C., & Goate, A. M. (2011) · Science Translational Medicine · doi:10.1126/scitranslmed.3002369 · Cited by 1,424
NMDA receptor trafficking in synaptic plasticity and neuropsychiatric disorders
Lau, C. G., & Zukin, R. S. (2007) · Nature Reviews Neuroscience · doi:10.1038/nrn2153 · Cited by 1,159 · cited 2×
“The Aβ42 and Aβ40 monomers concentrations were determined using ELISA kit (human β amyloid [1-40] and [1-42] kits, Wako, Osaka, Japan).”
BackgroundMethodNagahara, A. H., Merrill, D. A., Coppola, G., Tsukada, S., Schroeder, B. E., Shaked, G. M., Wang, L., Blesch, A., Kim, A., Conner, J. M., et al. (2009) · Nature Medicine · doi:10.1038/nm.1912 · Cited by 1,034
Borchelt, D. R., Ratovitski, T., van Lare, J., Lee, M. K., Gonzales, V., Jenkins, N. A., Copeland, N. G., Price, D. L., & Sisodia, S. S. (1997) · Neuron · doi:10.1016/s0896-6273(00)80974-5 · Cited by 1,023
Neuronal calcium mishandling and the pathogenesis of Alzheimer's disease
Bezprozvanny, I., & Mattson, M. P. (2008) · Trends in Neurosciences · doi:10.1016/j.tins.2008.06.005 · Cited by 938
Age, Neuropathology, and Dementia
Savva, G. M., Wharton, S. B., Ince, P. G., Forster, G., Matthews, F. E., & Brayne, C. (2009) · New England Journal of Medicine · doi:10.1056/nejmoa0806142 · Cited by 900
Intranasal insulin improves cognition and modulates β-amyloid in early AD
Reger, M. A., Watson, G. S., Green, P. S., Wilkinson, C. W., Baker, L. D., Cholerton, B., Fishel, M. A., Plymate, S. R., Breitner, J. C. S., DeGroodt, W., et al. (2008) · Neurology · doi:10.1212/01.wnl.0000265401.62434.36 · Cited by 830
Epilepsy and Cognitive Impairments in Alzheimer Disease
Palop, J. J. (2009) · Archives of Neurology · doi:10.1001/archneurol.2009.15 · Cited by 684
Greer, P. L., & Greenberg, M. E. (2008) · Neuron · doi:10.1016/j.neuron.2008.09.002 · Cited by 661 · cited 2×
“density are regulated by numerous endogenous factors [11], with some having neuro-/synapto-trophic functions.”
BackgroundMethodSanchez, P. E., Zhu, L., Verret, L., Vossel, K. A., Orr, A. G., Cirrito, J. R., Devidze, N., Ho, K., Yu, G.-Q., Palop, J. J., et al. (2012) · Proceedings of the National Academy of Sciences · doi:10.1073/pnas.1121081109 · Cited by 638
Kuchibhotla, K. V., Goldman, S. T., Lattarulo, C. R., Wu, H.-Y., Hyman, B. T., & Bacskai, B. J. (2008) · Neuron · doi:10.1016/j.neuron.2008.06.008 · Cited by 614
Testing the Right Target and Right Drug at the Right Stage
Sperling, R. A., Jack, C. R., & Aisen, P. S. (2011) · Science Translational Medicine · doi:10.1126/scitranslmed.3002609 · Cited by 550
Reversing EphB2 depletion rescues cognitive functions in Alzheimer model
Cissé, M., Halabisky, B., Harris, J., Devidze, N., Dubal, D. B., Sun, B., Orr, A., Lotz, G., Kim, D. H., Hamto, P., et al. (2011) · Nature · doi:10.1038/nature09635 · Cited by 433
Targeting BACE1 with siRNAs ameliorates Alzheimer disease neuropathology in a transgenic model
Singer, O., Marr, R. A., Rockenstein, E. M., Crews, L. A., Coufal, N. G., Gage, F. H., Verma, I. M., & Masliah, E. (2005) · Nature Neuroscience · doi:10.1038/nn1531 · Cited by 420
Alzheimer's DiseasePreprint
Selkoe, D. J. (2011) · Cold Spring Harbor Perspectives in Biology · doi:10.1101/cshperspect.a004457 · Cited by 384
Alberdi, E. M., Sánchez‐Gómez, M. V., Cavaliere, F., Pérez‐Samartín, A., Zugaza, J. L., Trullás, R., Domercq, M., & Matute, C. (2010) · Cell Calcium · doi:10.1016/j.ceca.2009.12.010 · Cited by 382
Enhancement of Learning and Memory by Elevating Brain Magnesium
Slutsky, I., Abumaria, N., Wu, L., Huang, C., Zhang, L., Li, B., Zhao, X., Govindarajan, A., Zhao, M., Zhuo, M., et al. (2010) · Neuron · doi:10.1016/j.neuron.2009.12.026 · Cited by 381
Self-citationImpaired spatial learning in the APPSwe + PSEN1ΔE9 bigenic mouse model of Alzheimer’s disease
Reiserer, R. S., Harrison, F. E., Syverud, D. C., & McDonald, M. P. (2007) · Genes, Brain and Behavior · doi:10.1111/j.1601-183x.2006.00221.x · Cited by 324
Rosa, R. D., Garcia, A. A., Braschi, C., Capsoni, S., Maffei, L., Berardi, N., & Cattaneo, A. (2005) · Proceedings of the National Academy of Sciences · doi:10.1073/pnas.0500195102 · Cited by 302
McConlogue, L., Buttini, M., Anderson, J. P., Brigham, E. F., Chen, K. S., Freedman, S. B., Games, D., Johnson-Wood, K., Lee, M., Zeller, M., et al. (2007) · Journal of Biological Chemistry · doi:10.1074/jbc.m611687200 · Cited by 300 · cited 2×
“The Aβ42 and Aβ40 monomers concentrations were determined using ELISA kit (human β amyloid [1-40] and [1-42] kits, Wako, Osaka, Japan).”
BackgroundMethodDing, Y., Qiao, A., Wang, Z., Goodwin, J. S., Lee, E.-S., Block, M. L., Allsbrook, M., McDonald, M. P., & Fan, G.-H. (2008) · The Journal of Neuroscience · doi:10.1523/jneurosci.3153-08.2008 · Cited by 269
Feng, W., Qiu, C.-S., Kim, S. J., Muglia, L. M., Maas, J. W., Pineda, V. V., Xu, H.-M., Chen, Z., Storm, D. R., Muglia, L. J., et al. (2002) · Neuron · doi:10.1016/s0896-6273(02)01019-x · Cited by 257
Magnesium Sulfate in Eclampsia and Pre-Eclampsia
Lu, J. F., & Nightingale, C. H. (2000) · Clinical Pharmacokinetics · doi:10.2165/00003088-200038040-00002 · Cited by 232
Alzheimer Disease and Cognitive Reserve
Roe, C. M., Mintun, M. A., D’Angelo, G., Xiong, C., Grant, E., & Morris, J. C. (2008) · Archives of Neurology · doi:10.1001/archneur.65.11.1467 · Cited by 222
Matsuoka, Y., Jouroukhin, Y., Gray, A. J., Ma, L., Hirata‐Fukae, C., Li, H.-F., Feng, L., Lecanu, L., Walker, B. R., Planel, E., et al. (2008) · Journal of Pharmacology and Experimental Therapeutics · doi:10.1124/jpet.107.130526 · Cited by 221
Jang, H., Arce, F. T., Ramachandran, S., Capone, R. F., Azimova, R., Kagan, B. L., Nussinov, R., & Lal, R. (2010) · Proceedings of the National Academy of Sciences · doi:10.1073/pnas.0914251107 · Cited by 218
On the mechanism by which calcium and magnesium affect the release of transmitter by nerve impulses
Hubbard, J. I., Jones, S. F., & Landau, E. M. (1968) · The Journal of Physiology · doi:10.1113/jphysiol.1968.sp008495 · Cited by 210
Hubbard, J. I., Jones, S. F., & Landau, E. M. (1968) · The Journal of Physiology · doi:10.1113/jphysiol.1968.sp008413 · Cited by 206
Slutsky, I., Sadeghpour, S., Li, B., & Liu, G. (2004) · Neuron · doi:10.1016/j.neuron.2004.11.013 · Cited by 151
Self-citationDineley, K. T., Hogan, D., Zhang, W.-R., & Taglialatela, G. (2007) · Neurobiology of Learning and Memory · doi:10.1016/j.nlm.2007.03.010 · Cited by 149
Tamayev, R., Matsuda, S., Arancio, O., & D'Adamio, L. (2012) · EMBO Molecular Medicine · doi:10.1002/emmm.201100195 · Cited by 142
Brain aluminum, magnesium and phosphorus contents of control and Alzheimer-diseased patients
Andrási, E., Páli, N., Molnár, Z., & Kösel, S. (2005) · Journal of Alzheimer's Disease · doi:10.3233/jad-2005-7402 · Cited by 139
Methods of assessment of magnesium status in humans: a systematic review
Witkowski, M., Hubert, J., & Mazur, A. (2011) · Magnesium Research · doi:10.1684/mrh.2011.0292 · Cited by 130
Elimination of GD3 synthase improves memory and reduces amyloid-β plaque load in transgenic mice
Bernardo, A., Harrison, F. E., McCord, M., Zhao, J., Bruchey, A., Davies, S. S., Jackson Roberts, L., Mathews, P. M., Matsuoka, Y., Ariga, T., et al. (2009) · Neurobiology of Aging · doi:10.1016/j.neurobiolaging.2007.12.022 · Cited by 127
Shi, J., Townsend, M., & Constantine‐Paton, M. (2000) · Neuron · doi:10.1016/s0896-6273(00)00089-1 · Cited by 95
Altered ionized magnesium levels in mild-to-moderate Alzheimer's disease
Barbagallo, M., Belvedere, M., Bella, G. D., & Dominguez, L. J. (2011) · Magnesium Research · doi:10.1684/mrh.2011.0287 · Cited by 85
Rockenstein, E. M., Adame, A., Mante, M., Moessler, H., Windisch, M., & Masliah, E. (2003) · Journal of Neural Transmission · doi:10.1007/s00702-003-0025-7 · Cited by 83
Orthodromic activation of hippocampal CA1 region of the rat
Leung, L.-W. S. (1979) · Brain Research · doi:10.1016/0006-8993(79)90869-2 · Cited by 74
Cited by
Sorted by citations
Molecular and cellular mechanisms underlying the pathogenesis of Alzheimer’s disease
Guo, T., Zhang, D., Zeng, Y., Huang, T. Y., Xu, H., & Zhao, Y. (2020) · Molecular Neurodegeneration · doi:10.1186/s13024-020-00391-7 · Cited by 994
Magnesium and inflammation: Advances and perspectives
Maier, J. A. M., Castiglioni, S., Locatelli, L., Zocchi, M., & Mazur, A. (2020) · Seminars in Cell and Developmental Biology · doi:10.1016/j.semcdb.2020.11.002 · Cited by 225
Metal Ion Effects on Aβ and Tau Aggregation
Kim, A. C., Lim, S., & Kim, Y. K. (2018) · International Journal of Molecular Sciences · doi:10.3390/ijms19010128 · Cited by 194
Magnesium Is a Key Player in Neuronal Maturation and Neuropathology
Yamanaka, R., Shindo, Y., & Oka, K. (2019) · International Journal of Molecular Sciences · doi:10.3390/ijms20143439 · Cited by 184
Biometal Dyshomeostasis and Toxic Metal Accumulations in the Development of Alzheimer’s Disease
Li, Y. H., Jiao, Q., Xu, H., Du, X., Shi, L., Jia, F., & Jiang, H. F. (2017) · Frontiers in Molecular Neuroscience · doi:10.3389/fnmol.2017.00339 · Cited by 173
Metadata
- Authors
- Li, W., Yu, J., Liu, Y., Huang, X., Abumaria, N., Zhu, Y., Huang, X., Xiong, W., Ren, C., Liu, X.-G., Chui, D., & Liu, G.
- Affiliations
- Tsinghua University (CN)
- Sun Yat-sen University (CN)
- Peking University (CN)
- Corresponding author
- Liu, Guosong
- Venue
- Molecular Brain
- Published
- 2014-09-13
- Volume
- 7
- Issue
- 1
- Pages
- 65-65
- ISSN
- 1756-6606 (ISSN-L)
- PMC
- PMC4172865
- OpenAlex
- W2124506047
- Cited by
- 146
- References
- 50
- Citations by year
- 2026: 8 · 2025: 13 · 2024: 20 · 2023: 9 · 2022: 13 · 2021: 15 · 2020: 16 · 2019: 8 · 2018: 5 · 2017: 14 · 2016: 11 · 2015: 14
- FWCI
- 8.64
- Type
- journal article
- Language
- en
- Open access
- gold
- doi.org
- Locations
- Molecular Brain (publishedVersion, cc-by)
- PubMed Central (publishedVersion, cc-by)
- PubMed (publishedVersion)
- Funders
- National Natural Science Foundation of China (973 Program, 2013CB835102, 81270048, 30970957)
- National Key Research and Development Program of China (2011CB302201, 2009CB941303)
- Topics
- Life Sciences › Neuroscience › Cellular and Molecular Neuroscience › Alzheimer's disease research and treatments
- Life Sciences › Neuroscience › Cellular and Molecular Neuroscience › Neuroscience and Neuropharmacology Research
- Health Sciences › Medicine › Psychiatry and Mental health › Dementia and Cognitive Impairment Research
- Keywords
- Alzheimer's disease, magnesium L-threonate, synaptic loss, cognitive impairment, APP/PS1 mice, amyloid plaques, NMDA receptor signaling, BACE1, APP processing, calcineurin, hippocampus, memory impairment
- MeSH terms
- Aging, Alzheimer Disease, Analysis of Variance, Animals, Body Weight, Brain, Butyrates, Cognition Disorders, Disease Models, Animal, Female, Hippocampus, Humans, Learning, Male, Memory Disorders, Mice, Transgenic, Motor Activity, Synaptic Transmission, Synapses, Signal Transduction, Down-Regulation, Receptors, N-Methyl-D-Aspartate, Amyloid beta-Peptides, Aspartic Acid Endopeptidases, Amyloid Precursor Protein Secretases, Plaque, Amyloid
About these checks
Registry, retraction, Cites and statistics results are computed, not judged, with one exception: a printed reference that no index lists is read once by a model before it counts as a citation error. Claims are extracted by a model and kept only when their quote appears verbatim in the text; each cited source is then checked, with a model’s help, for whether it says what the claim relies on. Those verdicts can be wrong — read the claim’s quote and the cited source before relying on one.
Statistics and arithmetic are recomputed, not judged.
Confidence bands are shown only for fields calibrated on our annotated test set. None is calibrated yet, so no band is shown.
What counts as a claim ›How we measure confidence ›How we check this ›
Are you an author, or do you see a problem with this page? Request a review
