

The DOI matches its Crossref record; 60 of the 60 references it cites were found in a registry or an index.
CHiCAGO: robust detection of DNA looping interactions in Capture Hi-C data
Open accessPublished version of a preprint
Abstract
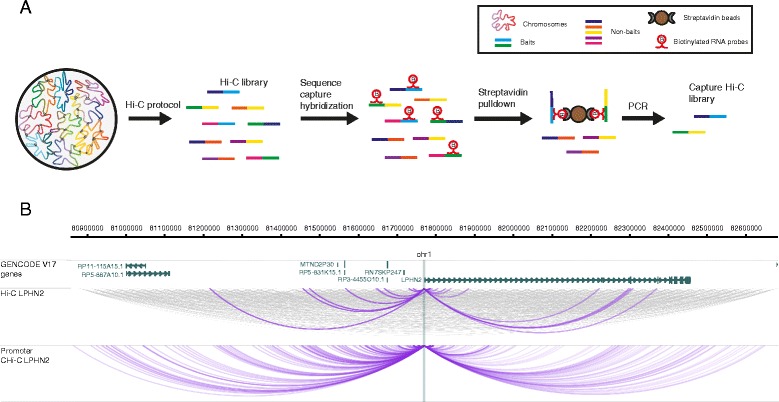
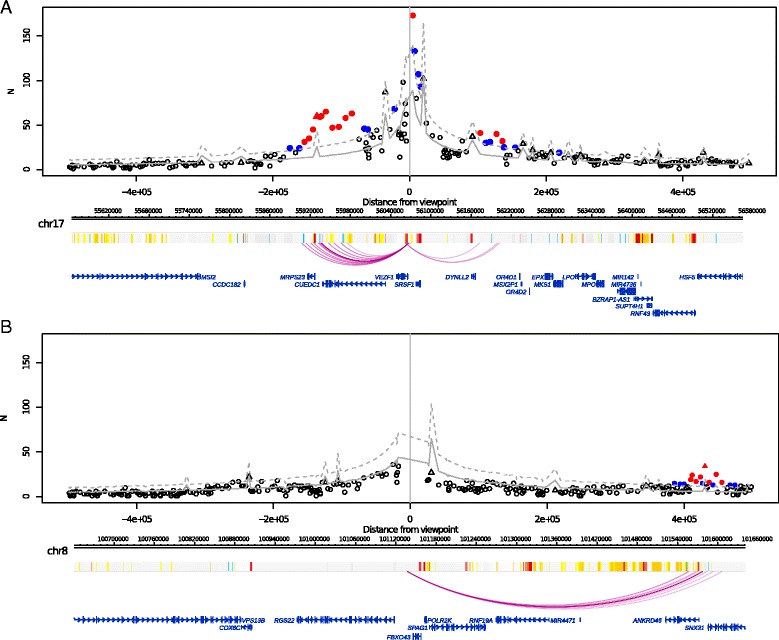
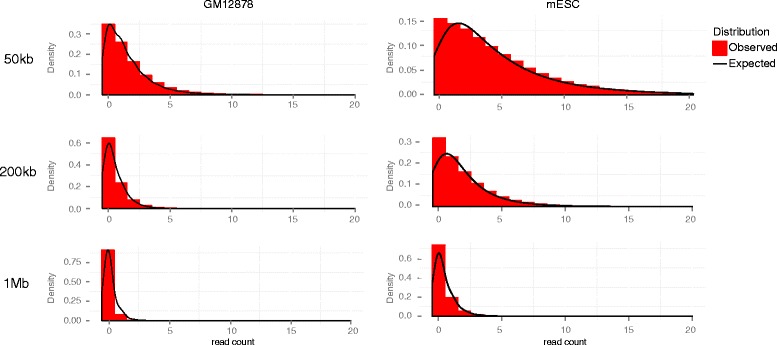
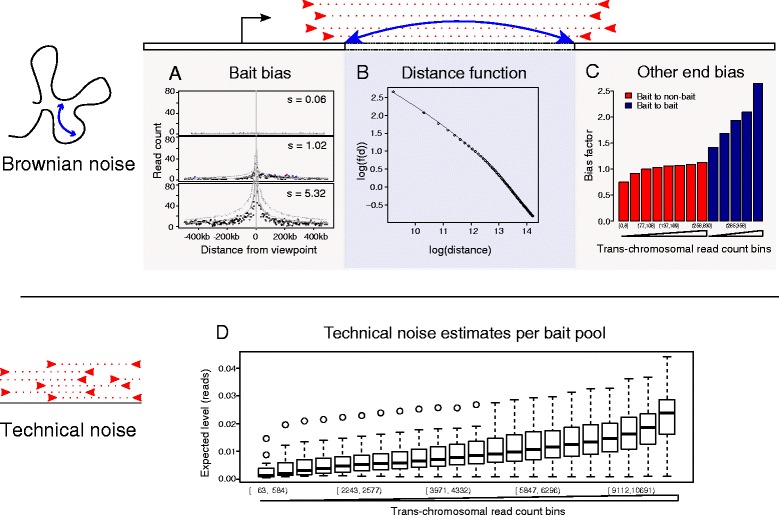
Capture Hi-C (CHi-C) is a method for profiling chromosomal interactions involving targeted regions of interest, such as gene promoters, globally and at high resolution. Signal detection in CHi-C data involves a number of statistical challenges that are not observed when using other Hi-C-like techniques. We present a background model and algorithms for normalisation and multiple testing that are specifically adapted to CHi-C experiments. We implement these procedures in CHiCAGO ( http://regulatorygenomicsgroup.org/chicago ), an open-source package for robust interaction detection in CHi-C. We validate CHiCAGO by showing that promoter-interacting regions detected with this method are enriched for regulatory features and disease-associated SNPs.
Overview
The claims and statistics of this paper haven’t been checked yet.
Run the check — free, no account needed. It reads the open-access text and checks the sources it cites.
Integrity signals
Registry
Cites
Statistics
Figures
Verification
Claims the paper makes
The claims and statistics of this paper haven’t been checked yet.
Run the check — free, no account needed. It reads the open-access text and checks the sources it cites.
Claims other papers make about this one
Each is checked against this paper’s own text: does it say what the citing paper says it does?
The source backs part of the claim, not all of it — or backs it for a different population, condition or comparison.
In the citing paper
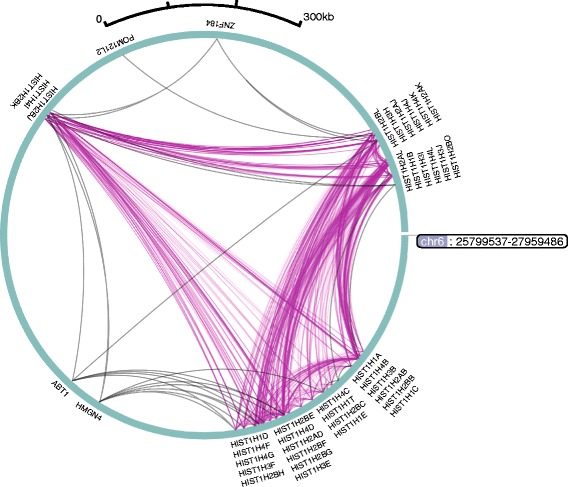
“A similar network of contacts is also detectable between the active promoters of multiple histone genes in many mammalian cell types [243, 279, 471, 492].”
From Transcriptional enhancers and their communication with gene promoters (2021) · cites this paper as [471]
Experimental — accuracy not yet measuredThe cited source says what the claim attributes to it.
In the citing paper
“many computational algorithms for the analysis of data from Hi-C and related techniques explicitly correct for distance decay, identifying “significant interactions” based on how unusual their contact frequency is at a given distance [277, 468–471].”
From Transcriptional enhancers and their communication with gene promoters (2021) · cites this paper as [471]
Self-check
Percentages, sums and reported differences re-computed from the paper’s own numbers.
The self-check needs the paper’s full text.
Citations
Cites
Controlling the False Discovery Rate: A Practical and Powerful Approach to Multiple Testing
Benjamini, Y., & Hochberg, Y. (1995) · Journal of the Royal Statistical Society Series B: Statistical Methodology · doi:10.1111/j.2517-6161.1995.tb02031.x · Cited by 109,482
Moderated estimation of fold change and dispersion for RNA-seq data with DESeq2
Love, M. I., Huber, W., & Anders, S. (2014) · Genome Biology · doi:10.1186/s13059-014-0550-8 · Cited by 95,106
A Simplex Method for Function Minimization
Nelder, J. A., & Mead, R. (1965) · The Computer Journal · doi:10.1093/comjnl/7.4.308 · Cited by 28,905
An integrated encyclopedia of DNA elements in the human genome
The ENCODE Project Consortium (2012) · Nature · doi:10.1038/nature11247 · Cited by 18,072
Differential expression analysis for sequence count data
Anders, S., & Huber, W. (2010) · Genome Biology · doi:10.1186/gb-2010-11-10-r106 · Cited by 15,581
Heinz, S., Benner, C., Spann, N., Bertolino, E., Lin, Y. C., Laslo, P., Cheng, J. X., Murre, C., Singh, H., & Glass, C. K. (2010) · Molecular Cell · doi:10.1016/j.molcel.2010.05.004 · Cited by 13,382
Topological domains in mammalian genomes identified by analysis of chromatin interactions
Dixon, J. R., Selvaraj, S., Yue, F., Kim, A., Li, Y., Shen, Y., Hu, M., Liu, J. S., & Ren, B. (2012) · Nature · doi:10.1038/nature11082 · Cited by 6,829
Systematic Localization of Common Disease-Associated Variation in Regulatory DNA
Maurano, M. T., Humbert, R., Rynes, E., Thurman, R. E., Haugen, E., Wang, H., Reynolds, A. P., Sandstrom, R., Qu, H., Brody, J., et al. (2012) · Science · doi:10.1126/science.1222794 · Cited by 3,716
Orchestrating high-throughput genomic analysis with Bioconductor
Huber, W. K., Carey, V. J., Gentleman, R. C., Anders, S., Carlson, M. R. J., Carvalho, B. S., Bravo, H. C., Davis, S. R., Gatto, L., Girke, T., et al. (2015) · Nature Methods · doi:10.1038/nmeth.3252 · Cited by 3,614
ChromHMM: automating chromatin-state discovery and characterization
Ernst, J., & Kellis, M. (2012) · Nature Methods · doi:10.1038/nmeth.1906 · Cited by 2,457
Research works printed but not linked: 1
- NCBI Gene Expression Omnibus. http://www.ncbi.nlm.nih.gov/geo/query/acc.cgi?acc=GSE81503 . Accessed 25 May 2016.
Cited by
Sorted by citations
Items 401–423 of 423
Lee, B. H., Wu, Z., & Rhie, S. K. (2023) · Figshare · doi:10.6084/m9.figshare.22614689
Wang, M., He, B., Hao, Y., Srinivasan, D., Shrinet, J., & Fraser, P. (2024) · Figshare · doi:10.6084/m9.figshare.26642446
Self-citationRay-Jones, H. F., Duffus, K., McGovern, A., Martin, P., Shi, C., Hankinson, J., Gough, O., Yarwood, A., Morris, A. P., Adamson, A. D., et al. (2020) · Figshare · doi:10.6084/m9.figshare.12246932
Ray-Jones, H. F., Duffus, K., McGovern, A., Martin, P., Shi, C., Hankinson, J., Gough, O., Yarwood, A., Morris, A. P., Adamson, A. D., et al. (2020) · Figshare · doi:10.6084/m9.figshare.12246887
Washington, C., Dapas, M., Biddanda, A., Magnaye, K. M., Aneas, I., Helling, B. A., Szczesny, B., Boorgula, M. P., Taub, M. A., Kenny, E. E., et al. (2022) · Figshare · doi:10.6084/m9.figshare.21251477
Ray-Jones, H. F., Duffus, K., McGovern, A., Martin, P., Shi, C., Hankinson, J., Gough, O., Yarwood, A., Morris, A. P., Adamson, A. D., et al. (2020) · Figshare · doi:10.6084/m9.figshare.12246896
Pahl, M. C., Coz, C. L., Su, C., Sharma, P. K., Thomas, R. M., Pippin, J. A., Cabrera, E. C., Johnson, M. E., Leonard, M. E., Lu, S., et al. (2022) · Figshare · doi:10.6084/m9.figshare.20001206
Functional characterization of a multi-cancer risk locus on chromosome band 2q33.1 near CASP8Preprint
Kong, H., Choi, J., Zhang, T., Gräwe, C., Xu, M., Thakur, R., Sowards, H., Hennessey, R. C., Vu, A. H., Shi, J., et al. (2026) · bioRxiv (Cold Spring Harbor Laboratory) · doi:10.64898/2026.01.06.697866
Romero, M. A., Chien, P., Nicoletti, C., Liliom, H. L., Cox, G., Skuratovsky, E., Saleh, K. K., Gibbs, D., Gane, L., Hoang, D.-H., et al. (2026) · bioRxiv (Cold Spring Harbor Laboratory) · doi:10.64898/2026.01.23.701436
Bonilla, B., Patty, B. J., Sambare, S., Dekker, J., Fazzio, T. G., & Hainer, S. (2026) · Genetics · doi:10.1093/genetics/iyag037
The functional and spatial organization of chromatin during Thymocyte development
Zouari, Y. B. (2018) · theses.fr (ABES) · doi:10.70675/1386d580z2888z41aaz8840z58384a36037b
Étude multi-omics des mutations des isocitrates déshydrogénases dans les leucémies aiguës myéloïdes
Hucteau, A. (2023) · theses.fr (ABES) · doi:10.70675/2ddbfecfzaa70z4d57z87cbzbcc9f3c01cc6
Advances and Frontier Prospects of Computational Detection Methods for Chromatin Loops
Yang, H. (2026) · Journal of Computer Science and Artificial Intelligence · doi:10.54097/cavgfa05
Functional characterization of a multi-cancer risk locus on chromosome band 2q33.1 near CASP8Preprint
Kong, H., Choi, J., Zhang, T., Gräwe, C., Xu, M., Thakur, R., Sowards, H., Hennessey, R. C., Vu, A. H., Shi, J., et al. (2026) · eLife · doi:10.7554/elife.110071
Functional characterization of a multi-cancer risk locus on chromosome band 2q33.1 near CASP8Preprint
Kong, H., Choi, J., Zhang, T., Gräwe, C., Xu, M., Thakur, R., Sowards, H., Hennessey, R. C., Vu, A. H., Shi, J., et al. (2026) · eLife · doi:10.7554/elife.110071.1
Polycomb chromatin topology enables long-range enhancer recruitment during craniofacial development
Zouari, Y. B., Joshi, O., Salvi, A., Kessler, S., Ducret, S., Ross, F., Holwerda, S. J. B., Vilain, N., Mamilla-Sanivaram, S., Smallwood, S., et al. (2026) · Nature Communications · doi:10.1038/s41467-026-73065-5
Topological Patterns of 3-Cliques in Chromatin Interaction Networks
Vīksna, J., Sizovs, A., Melkus, G., Ručevskis, P., Celms, E., Lāce, L., & Silina, S. (2026) · Communications in computer and information science · doi:10.1007/978-3-032-34456-4_8
Malysheva, V., Ray-Jones, H. F., Lakes, N., Brown, R. A., Cazares, T. A., Clay, O., Ohayon, D. E., Artemov, P., Wayman, J. A., Yang, Z. F., et al. (2026) · Nature Genetics · doi:10.1038/s41588-026-02681-0 · Cited by 6
Self-citationp-LoopF is associated with chromatin looping in large introns of Ginkgo biloba
He, B., Li, J., Fan, W., Liu, H., Teng, H., Lin, Q., Bu, M., Wu, S., Li, R., Xiong, S., et al. (2026) · Cell Research · doi:10.1038/s41422-026-01290-0
Analysis of Chromatin Structure Using Network Approaches: A Step-by-Step Guide
Aliaga, B., Raynal, F., & Pancaldi, V. (2026) · Methods in molecular biology · doi:10.1007/978-1-0716-5284-8_6
Thakur, R., Xu, M., Thornock, A., Yon, J., Anyaso-Samuel, S., Lauss, M., Rehling, T., Bui, L. T., Sowards, H., Duncan, G., et al. (2026) · The American Journal of Human Genetics · doi:10.1016/j.ajhg.2026.08.014 · Cited by 1
Massenet, J., Nicoletti, C., Caputo, L., Hüttner, S. S., Nicolau, M., Barajas, J. R., Rossi, M., Yang, Y., Wang, Y. X., Wang, Y. X., et al. (2026) · bioRxiv (Cold Spring Harbor Laboratory) · doi:10.64898/2026.09.28.754564
Metadata
- Authors
- Cairns, J., Freire-Pritchett, P., Wingett, S. W., Várnai, C., Dimond, A., Plagnol, V., Zerbino, D., Schoenfelder, S., Javierre, B.-M., Osborne, C., Fraser, P., & Spivakov, M.
- Affiliations
- Babraham Institute (GB)
- University College London (GB)
- European Bioinformatics Institute (GB)
- King's College London (GB)
- Corresponding author
- Spivakov, Mikhail
- ORCID
- Venue
- Genome Biology
- Published
- 2016-06-15
- Volume
- 17
- Issue
- 1
- Pages
- 127-127
- ISSN
- 1465-6906 (ISSN-L)
- 1474-760X
- PMC
- PMC4908757
- OpenAlex
- W2950020758
- Cited by
- 417
- References
- 60
- Citations by year
- 2026: 20 · 2025: 34 · 2024: 42 · 2023: 40 · 2022: 45 · 2021: 48 · 2020: 51 · 2019: 52 · 2018: 39 · 2017: 32 · 2016: 11
- FWCI
- 23.22
- Type
- journal article
- Language
- en
- Open access
- gold
- doi.org
- Licence
- cc-by
- Locations
- Genome biology (publishedVersion, cc-by)
- Europe PMC (PubMed Central) (publishedVersion, cc-by)
- PubMed Central (publishedVersion, cc-by)
- PubMed (publishedVersion)
- Research Portal (King's College London) (submittedVersion, cc-by)
- University of Birmingham Research Portal (University of Birmingham) (submittedVersion, cc-by)
- Spiral (Imperial College London) (submittedVersion, other-oa)
- Funders
- Biotechnology and Biological Sciences Research Council (GB)
- Topics
- Life Sciences › Biochemistry, Genetics and Molecular Biology › Molecular Biology › Genomics and Chromatin Dynamics
- Life Sciences › Biochemistry, Genetics and Molecular Biology › Molecular Biology › Bioinformatics and Genomic Networks
- Life Sciences › Biochemistry, Genetics and Molecular Biology › Cancer Research › Cancer-related molecular mechanisms research
- Keywords
- Capture Hi-C, chromatin looping, background modeling, normalization, multiple comparisons, Chicago, promoter interactions, regulatory elements, disease-associated SNPs
- MeSH terms
- Algorithms, Chromatin, Chromosomes, Humans, Software, Internet, Polymorphism, Single Nucleotide, Genomics
About these checks
Registry, retraction, Cites and statistics results are computed, not judged, with one exception: a printed reference that no index lists is read once by a model before it counts as a citation error. Claims are extracted by a model and kept only when their quote appears verbatim in the text; each cited source is then checked, with a model’s help, for whether it says what the claim relies on. Those verdicts can be wrong — read the claim’s quote and the cited source before relying on one.
Statistics and arithmetic are recomputed, not judged.
Confidence bands are shown only for fields calibrated on our annotated test set. None is calibrated yet, so no band is shown.
What counts as a claim ›How we measure confidence ›How we check this ›
Are you an author, or do you see a problem with this page? Request a review
