

The DOI matches its Crossref record; 60 of the 60 references it cites were found in a registry or an index.
CHiCAGO: robust detection of DNA looping interactions in Capture Hi-C data
Open accessPublished version of a preprint
Abstract
Capture Hi-C (CHi-C) is a method for profiling chromosomal interactions involving targeted regions of interest, such as gene promoters, globally and at high resolution. Signal detection in CHi-C data involves a number of statistical challenges that are not observed when using other Hi-C-like techniques. We present a background model and algorithms for normalisation and multiple testing that are specifically adapted to CHi-C experiments. We implement these procedures in CHiCAGO ( http://regulatorygenomicsgroup.org/chicago ), an open-source package for robust interaction detection in CHi-C. We validate CHiCAGO by showing that promoter-interacting regions detected with this method are enriched for regulatory features and disease-associated SNPs.
Overview
The claims and statistics of this paper haven’t been checked yet.
Run the check — free, no account needed. It reads the open-access text and checks the sources it cites.
Integrity signals
Registry
Cites
Statistics
Figures
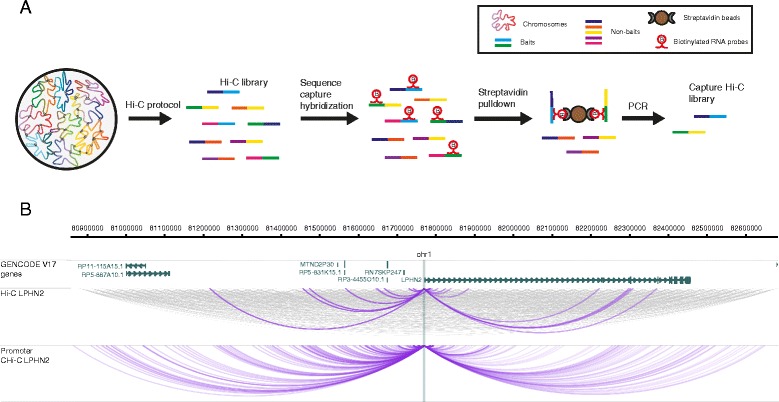
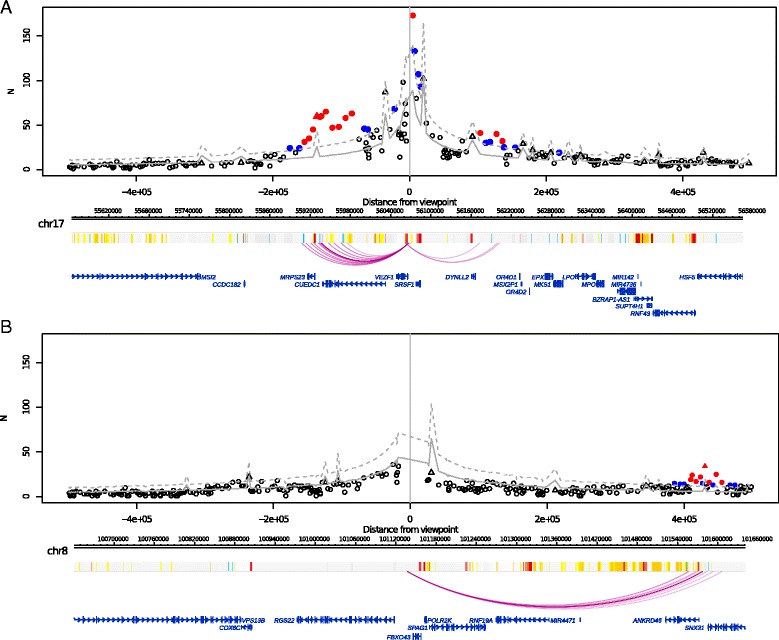
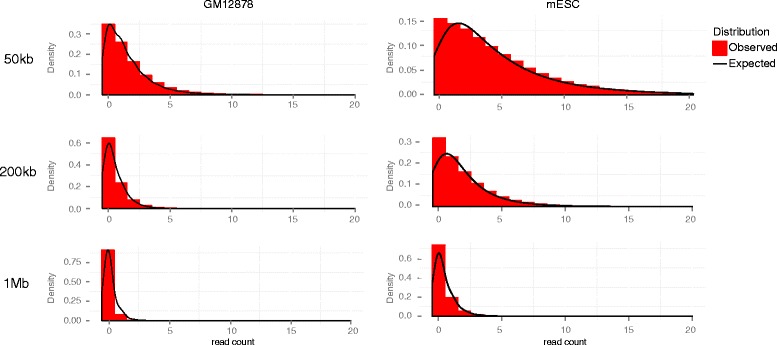
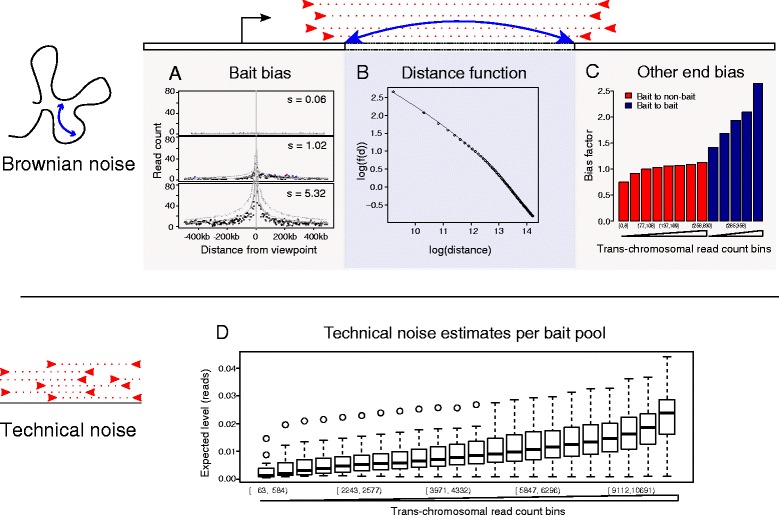
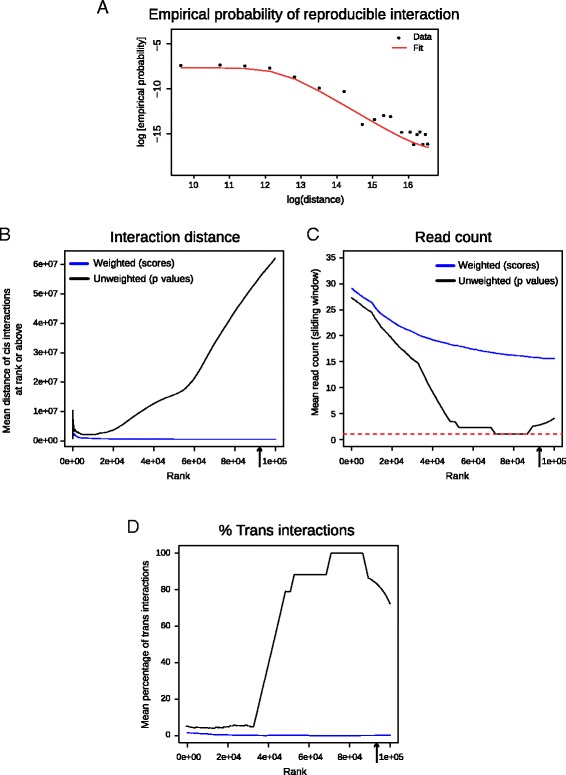
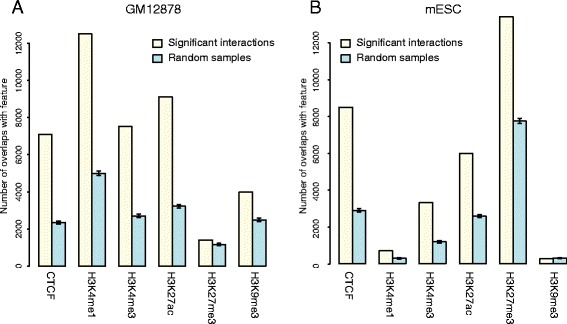
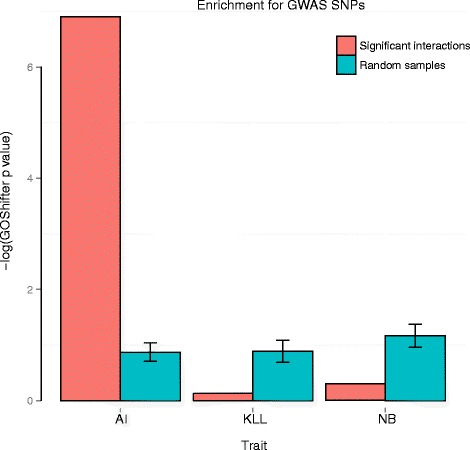
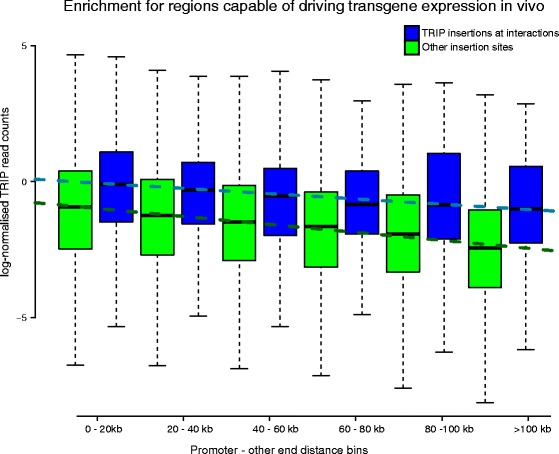
Verification
Claims the paper makes
The claims and statistics of this paper haven’t been checked yet.
Run the check — free, no account needed. It reads the open-access text and checks the sources it cites.
Claims other papers make about this one
Each is checked against this paper’s own text: does it say what the citing paper says it does?
The source backs part of the claim, not all of it — or backs it for a different population, condition or comparison.
In the citing paper
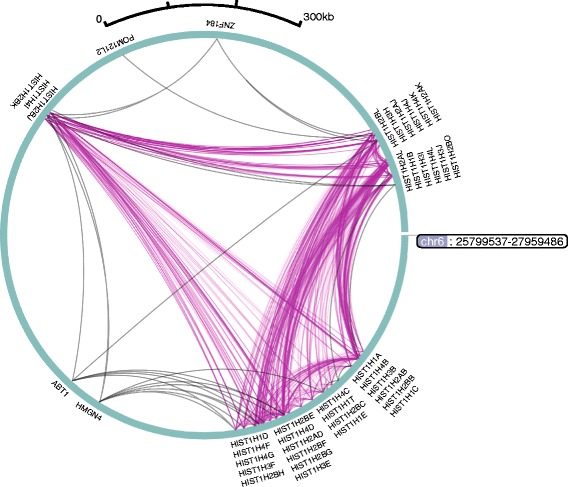
“A similar network of contacts is also detectable between the active promoters of multiple histone genes in many mammalian cell types [243, 279, 471, 492].”
From Transcriptional enhancers and their communication with gene promoters (2021) · cites this paper as [471]
Experimental — accuracy not yet measuredThe cited source says what the claim attributes to it.
In the citing paper
“many computational algorithms for the analysis of data from Hi-C and related techniques explicitly correct for distance decay, identifying “significant interactions” based on how unusual their contact frequency is at a given distance [277, 468–471].”
From Transcriptional enhancers and their communication with gene promoters (2021) · cites this paper as [471]
Self-check
Percentages, sums and reported differences re-computed from the paper’s own numbers.
The self-check needs the paper’s full text.
Citations
Cites
Controlling the False Discovery Rate: A Practical and Powerful Approach to Multiple Testing
Benjamini, Y., & Hochberg, Y. (1995) · Journal of the Royal Statistical Society Series B: Statistical Methodology · doi:10.1111/j.2517-6161.1995.tb02031.x · Cited by 109,482
Moderated estimation of fold change and dispersion for RNA-seq data with DESeq2
Love, M. I., Huber, W., & Anders, S. (2014) · Genome Biology · doi:10.1186/s13059-014-0550-8 · Cited by 95,106
A Simplex Method for Function Minimization
Nelder, J. A., & Mead, R. (1965) · The Computer Journal · doi:10.1093/comjnl/7.4.308 · Cited by 28,905
An integrated encyclopedia of DNA elements in the human genome
The ENCODE Project Consortium (2012) · Nature · doi:10.1038/nature11247 · Cited by 18,072
Differential expression analysis for sequence count data
Anders, S., & Huber, W. (2010) · Genome Biology · doi:10.1186/gb-2010-11-10-r106 · Cited by 15,581
Heinz, S., Benner, C., Spann, N., Bertolino, E., Lin, Y. C., Laslo, P., Cheng, J. X., Murre, C., Singh, H., & Glass, C. K. (2010) · Molecular Cell · doi:10.1016/j.molcel.2010.05.004 · Cited by 13,382
Topological domains in mammalian genomes identified by analysis of chromatin interactions
Dixon, J. R., Selvaraj, S., Yue, F., Kim, A., Li, Y., Shen, Y., Hu, M., Liu, J. S., & Ren, B. (2012) · Nature · doi:10.1038/nature11082 · Cited by 6,829
Systematic Localization of Common Disease-Associated Variation in Regulatory DNA
Maurano, M. T., Humbert, R., Rynes, E., Thurman, R. E., Haugen, E., Wang, H., Reynolds, A. P., Sandstrom, R., Qu, H., Brody, J., et al. (2012) · Science · doi:10.1126/science.1222794 · Cited by 3,716
Orchestrating high-throughput genomic analysis with Bioconductor
Huber, W. K., Carey, V. J., Gentleman, R. C., Anders, S., Carlson, M. R. J., Carvalho, B. S., Bravo, H. C., Davis, S. R., Gatto, L., Girke, T., et al. (2015) · Nature Methods · doi:10.1038/nmeth.3252 · Cited by 3,614
ChromHMM: automating chromatin-state discovery and characterization
Ernst, J., & Kellis, M. (2012) · Nature Methods · doi:10.1038/nmeth.1906 · Cited by 2,457
Research works printed but not linked: 1
- NCBI Gene Expression Omnibus. http://www.ncbi.nlm.nih.gov/geo/query/acc.cgi?acc=GSE81503 . Accessed 25 May 2016.
Cited by
Sorted by citations
GeneHancer: genome-wide integration of enhancers and target genes in GeneCards
Fishilevich, S., Nudel, R., Rappaport, N., Hadar, R., Plaschkes, I., Stein, T. I., Rosen, N., Kohn, A., Twik, M., Safran, M., et al. (2017) · Database · doi:10.1093/database/bax028 · Cited by 1,270
Long-range enhancer–promoter contacts in gene expression control
Schoenfelder, S., & Fraser, P. (2019) · Nature Reviews Genetics · doi:10.1038/s41576-019-0128-0 · Cited by 1,102
Self-citationJavierre, B. M., Burren, O. S., Wilder, S. P., Kreuzhuber, R., Hill, S. M., Sewitz, S., Cairns, J., Wingett, S. W., Várnai, C., Thiecke, M. J., et al. (2016) · Cell · doi:10.1016/j.cell.2016.09.037 · Cited by 1,046
Self-citationCicero predicts cis-regulatory DNA interactions from single-cell chromatin accessibility data
Pliner, H. A., Packer, J. S., McFaline-Figueroa, J. L., Cusanovich, D. A., Daza, R. M., Aghamirzaie, D., Srivatsan, S., Qiu, X., Jackson, D., Minkina, A., et al. (2018) · Molecular Cell · doi:10.1016/j.molcel.2018.06.044 · Cited by 789
HiCUP: pipeline for mapping and processing Hi-C data
Wingett, S., Ewels, P., Furlan-Magaril, M., Nagano, T., Schoenfelder, S., Fraser, P., & Andrews, S. (2015) · F1000Research · doi:10.12688/f1000research.7334.1 · Cited by 734
Self-citationMethods for mapping 3D chromosome architecture
Kempfer, R., & Pombo, A. (2019) · Nature Reviews Genetics · doi:10.1038/s41576-019-0195-2 · Cited by 533
Weeks, E. M., Ulirsch, J. C., Cheng, N., Trippe, B. L., Fine, R. S., Miao, J., Patwardhan, T. A., Kanai, M., Nasser, J., Fulco, C. P., et al. (2023) · Nature Genetics · doi:10.1038/s41588-023-01443-6 · Cited by 336
The second decade of 3C technologies: detailed insights into nuclear organizationPreprint
Denker, A., & de Laat, W. L. (2016) · Genes & Development · doi:10.1101/gad.281964.116 · Cited by 357
Highly rearranged chromosomes reveal uncoupling between genome topology and gene expression
Ghavi-Helm, Y., Jankowski, A., Meiers, S., Viales, R. R., Korbel, J. O., & Furlong, E. E. M. (2019) · Nature Genetics · doi:10.1038/s41588-019-0462-3 · Cited by 354
Genome-wide mapping and analysis of chromosome architecture
Schmitt, A. D., Hu, M., & Ren, B. (2016) · Nature Reviews Molecular Cell Biology · doi:10.1038/nrm.2016.104 · Cited by 344
Rubin, A. J., Barajas, B. C., Furlan-Magaril, M., Lopez-Pajares, V., Mumbach, M. R., Howard, I., Kim, D. S., Boxer, L. D., Cairns, J., Spivakov, M., et al. (2017) · Nature Genetics · doi:10.1038/ng.3935 · Cited by 293
Self-citationMiguel-Escalada, I., Bonàs‐Guarch, S., Cebola, I., Ponsa-Cobas, J., Mendieta-Esteban, J., Atla, G., Javierre, B. M., Rolando, D., Farabella, I., Morgan, C. C., et al. (2019) · Nature Genetics · doi:10.1038/s41588-019-0457-0 · Cited by 269
Self-citationAssociation analyses identify 31 new risk loci for colorectal cancer susceptibility
Law, P., Timofeeva, M. N., Fernández–Rozadilla, C., Broderick, P., Studd, J. B., Fernandez-Tajes, J. J., Farrington, S. M., Svinti, V., Palles, C., Orlando, G., et al. (2019) · Nature Communications · doi:10.1038/s41467-019-09775-w · Cited by 249
El Khattabi, L., Zhao, H., Kalchschmidt, J., Young, N., Jung, S., Van Blerkom, P., Kieffer-Kwon, P., Kieffer-Kwon, K.-R., Park, S., Wang, X., et al. (2019) · Cell · doi:10.1016/j.cell.2019.07.011 · Cited by 244
PRC1 catalytic activity is central to polycomb system function
Blackledge, N. P., Fursova, N. A., Kelley, J. R., Huseyin, M. K., Feldmann, A., & Klose, R. J. (2020) · Molecular Cell · doi:10.1016/j.molcel.2019.12.001 · Cited by 243
Dynamic Rewiring of Promoter-Anchored Chromatin Loops during Adipocyte Differentiation
Siersbæk, R., Madsen, J. G. S., Javierre, B. M., Nielsen, R., Bagge, E. K., Cairns, J., Wingett, S. W., Traynor, S., Spivakov, M., Fraser, P., et al. (2017) · Molecular Cell · doi:10.1016/j.molcel.2017.04.010 · Cited by 243
Self-citationIdentification of significant chromatin contacts from HiChIP data by FitHiChIP
Bhattacharyya, S., Chandra, V., Vijayanand, P., & Ay, F. (2019) · Nature Communications · doi:10.1038/s41467-019-11950-y · Cited by 238
Joshi, O., Wang, S.-Y., Kuznetsova, T., Atlasi, Y., Peng, T., Fabre, P. J., Habibi, E., Shaik, J., Saeed, S., Handoko, L., et al. (2015) · Cell stem cell · doi:10.1016/j.stem.2015.11.010 · Cited by 208
Self-citationVujkovic, M., Ramdas, S., Lorenz, K. M., Guo, X., Darlay, R., Cordell, H. J., He, J., Gindin, Y., Chung, C., Myers, R. P., et al. (2022) · Nature Genetics · doi:10.1038/s41588-022-01078-z · Cited by 205
GenPipes: an open-source framework for distributed and scalable genomic analyses
Bourgey, M., Dali, R., Eveleigh, R. J. M., Chen, K. C., Létourneau, L., Fillon, J., Michaud, M., Caron, M., Sandoval, J., Lefebvre, F., et al. (2019) · GigaScience · doi:10.1093/gigascience/giz037 · Cited by 204
The reference epigenome and regulatory chromatin landscape of chronic lymphocytic leukemia
Beekman, R., Chapaprieta, V., Russiñol, N., Vilarrasa‐Blasi, R., Verdaguer-Dot, N., Martens, J. H. A., Duran‐Ferrer, M., Kulis, M., Serra, F., Javierre, B. M., et al. (2018) · Nature Medicine · doi:10.1038/s41591-018-0028-4 · Cited by 196
Self-citationCohesin Disrupts Polycomb-Dependent Chromosome Interactions in Embryonic Stem Cells
Rhodes, J. D. P., Feldmann, A., Hernández-Rodríguez, B., Díaz, N., Brown, J. M., Fursova, N. A., Blackledge, N. P., Prathapan, P., Dobrinic, P., Huseyin, M. K., et al. (2020) · Cell Reports · doi:10.1016/j.celrep.2019.12.057 · Cited by 187
Ito, J., Sugimoto, R., Nakaoka, H., YAMADA, S., Kimura, T., Hayano, T., & Inoue, I. (2017) · PLoS Genetics · doi:10.1371/journal.pgen.1006883 · Cited by 181
Song, M., Yang, X., Ren, X., Maliskova, L., Li, B., Jones, I. R., Wang, C., Jacob, F., Wu, K., Traglia, M., et al. (2019) · Nature Genetics · doi:10.1038/s41588-019-0472-1 · Cited by 167
Thiecke, M. J., Wutz, G., Muhar, M., Tang, W., Bevan, S., Malysheva, V., Stocsits, R., Neumann, T., Zuber, J., Fraser, P., et al. (2020) · Cell Reports · doi:10.1016/j.celrep.2020.107929 · Cited by 177
Self-citationWaage, J., collaborators, A., Standl, M., Curtin, J. A., Jessen, L. E., Thorsen, J., Tian, C., Schoettler, N., Flores, C., Abdellaoui, A., et al. (2018) · Nature Genetics · doi:10.1038/s41588-018-0157-1 · Cited by 172
Measuring the reproducibility and quality of Hi-C data
Yardımcı, G. G., Özadam, H., Sauria, M. E. G., Ursu, O., Yan, K., Yang, T., Chakraborty, A., Kaul, A., Lajoie, B. R., Song, F., et al. (2019) · Genome biology · doi:10.1186/s13059-019-1658-7 · Cited by 173
A supervised learning framework for chromatin loop detection in genome-wide contact maps
Salameh, T. J., Wang, X., Song, F., Zhang, B., Wright, S. M., Khunsriraksakul, C., Ruan, Y., & Yue, F. (2020) · Nature Communications · doi:10.1038/s41467-020-17239-9 · Cited by 165
Global reorganisation of cis-regulatory units upon lineage commitment of human embryonic stem cells
Freire-Pritchett, P., Schoenfelder, S., Várnai, C., Wingett, S. W., Cairns, J., Collier, A. J., García-Vílchez, R., Furlan-Magaril, M., Osborne, C. S., Fraser, P., et al. (2017) · eLife · doi:10.7554/elife.21926 · Cited by 161
“PCHi-C data normalisation and signal detection using the CHiCAGO pipeline (Cairns et al., 2016) identified 75,795 significant cis-interactions between promoters and other genomic regions in ESCs and 75,624 in NECs.”
MethodInfluentialSelf-citationMarco, A., Meharena, H. S., Dileep, V., Raju, R. M., Davila-Velderrain, J., Zhang, A. L., Adaikkan, C., Young, J. Z., Gao, F., Kellis, M., et al. (2020) · Nature Neuroscience · doi:10.1038/s41593-020-00717-0 · Cited by 159
HiCcompare: an R-package for joint normalization and comparison of HI-C datasets
Stansfield, J. C., Cresswell, K. G., Vladimirov, V. I., & Dozmorov, M. G. (2018) · BMC Bioinformatics · doi:10.1186/s12859-018-2288-x · Cited by 149
Chesi, A., Wagley, Y., Johnson, M. E., Manduchi, E., Su, C., Lu, S., Leonard, M. E., Hodge, K. M., Pippin, J. A., Hankenson, K. D., et al. (2019) · Nature Communications · doi:10.1038/s41467-019-09302-x · Cited by 158
How best to identify chromosomal interactions: a comparison of approaches
Davies, J. O. J., Oudelaar, A. M., Higgs, D. R., & Hughes, J. R. (2017) · Nature Methods · doi:10.1038/nmeth.4146 · Cited by 155
A promoter interaction map for cardiovascular disease genetics
Montefiori, L. E., Sobreira, D. R., Sakabe, N. J., Aneas, I., Joslin, A. C., Hansen, G. T., Bozek, G., Moskowitz, I. P., McNally, E. M., & Nóbrega, M. A. (2018) · eLife · doi:10.7554/elife.35788 · Cited by 145
Inferring Interaction Networks From Multi-Omics Data
Hawe, J. S., Theis, F. J., & Heinig, M. (2019) · Frontiers in Genetics · doi:10.3389/fgene.2019.00535 · Cited by 148
Ursu, O., Boley, N. P., Taranova, M., Wang, Y. X. R., Yardımcı, G. G., Noble, W. S., & Kundaje, A. B. (2018) · Bioinformatics · doi:10.1093/bioinformatics/bty164 · Cited by 134
DeepTACT: predicting 3D chromatin contacts via bootstrapping deep learning
Li, W., Wong, W. H., & Jiang, R. (2019) · Nucleic Acids Research · doi:10.1093/nar/gkz167 · Cited by 133
Andrey, G., Schöpflin, R., Jerković, I., Heinrich, V., Ibrahim, D. M., Paliou, C., Hochradel, M., Timmermann, B., Haas, S. A., Vingron, M., et al. (2016) · Genome Research · doi:10.1101/gr.213066.116 · Cited by 126
Litchfield, K., Levy, M., Orlando, G., Loveday, C., Law, P., Migliorini, G., Holroyd, A., Broderick, P., Karlsson, R., Haugen, T. B., et al. (2017) · Nature Genetics · doi:10.1038/ng.3896 · Cited by 126
Chromatin-accessibility estimation from single-cell ATAC-seq data with scOpen
Li, Z., Kuppe, C., Ziegler, S. M., Cheng, M., Kabgani, N., Menzel, S., Zenke, M., Kramann, R., & Costa, I. G. (2021) · Nature Communications · doi:10.1038/s41467-021-26530-2 · Cited by 125
The state of play in higher eukaryote gene annotation
Mudge, J. M., & Harrow, J. (2016) · Nature Reviews Genetics · doi:10.1038/nrg.2016.119 · Cited by 132
Odhams, C. A., Roberts, A. L., Vester, S. K., Duarte, C., Beales, C. T., Clarke, A. J., Lindinger, S., Daffern, S. J., Zito, A., Chen, L., et al. (2019) · Nature Communications · doi:10.1038/s41467-019-10106-2 · Cited by 124
Rowley, M. J., Lyu, X., Rana, V., Ando‐Kuri, M., Karns, R., Bosco, G., & Corces, V. G. (2019) · Cell Reports · doi:10.1016/j.celrep.2019.01.116 · Cited by 114
Novo, C. L., Javierre, B.-M., Cairns, J., Segonds-Pichon, A., Wingett, S. W., Freire-Pritchett, P., Furlan-Magaril, M., Schoenfelder, S., Fraser, P., & Rugg-Gunn, P. J. (2018) · Cell Reports · doi:10.1016/j.celrep.2018.02.040 · Cited by 119
Self-citationTOP1 inhibition therapy protects against SARS-CoV-2-induced lethal inflammation
Ho, J., Mok, B. W.-Y., Campisi, L., Jordan, T. X., Yildiz, S., Parameswaran, S., Wayman, J. A., Gaudreault, N. N., Meekins, D. A., Indran, S. V., et al. (2021) · Cell · doi:10.1016/j.cell.2021.03.051 · Cited by 121
Self-citationWent, M., Sud, A., Försti, A., Halvarsson, B.-M., Weinhold, N., Kimber, S. T., van Duin, M., Þorleifsson, G., Holroyd, A., Johnson, D. C., et al. (2018) · Nature Communications · doi:10.1038/s41467-018-04989-w · Cited by 117
Promoter Capture Hi-C: High-resolution, Genome-wide Profiling of Promoter Interactions
Schoenfelder, S., Javierre, B. M., Furlan-Magaril, M., Wingett, S., & Fraser, P. (2018) · Journal of Visualized Experiments · doi:10.3791/57320 · Cited by 121
Self-citationA Dementia-Associated Risk Variant near TMEM106B Alters Chromatin Architecture and Gene Expression
Gallagher, M. D., Posavi, M., Huang, P., Unger, T. L., Berlyand, Y., Gruenewald, A. L., Chesi, A., Manduchi, E., Wells, A. D., Grant, S. F. A., et al. (2017) · The American Journal of Human Genetics · doi:10.1016/j.ajhg.2017.09.004 · Cited by 112
High-resolution genetic mapping of putative causal interactions between regions of open chromatin
Kumasaka, N., Knights, A. J., & Gaffney, D. J. (2018) · Nature Genetics · doi:10.1038/s41588-018-0278-6 · Cited by 103
Hi-C analysis: from data generation to integration
Pal, K., Forcato, M., & Ferrari, F. (2018) · Biophysical Reviews · doi:10.1007/s12551-018-0489-1 · Cited by 102
Madsen, J. G. S., Madsen, M. S., Rauch, A., Traynor, S., Hauwaert, E. L. V., Haakonsson, A. K., Javierre, B. M., Hyldahl, M., Fraser, P., & Mandrup, S. (2020) · Nature Genetics · doi:10.1038/s41588-020-0709-z · Cited by 97
Self-citationPan, D. Z., Garske, K. M., Alvarez, M., Bhagat, Y. V., Boocock, J., Nikkola, E., Miao, Z., Raulerson, C. K., Cantor, R. M., Civelek, M., et al. (2018) · Nature Communications · doi:10.1038/s41467-018-03554-9 · Cited by 95
Mapping effector genes at lupus GWAS loci using promoter Capture-C in follicular helper T cells
Su, C., Johnson, M. E., Torres, A., Thomas, R. M., Manduchi, E., Sharma, P. K., Mehra, P., Coz, C. L., Leonard, M. E., Lu, S., et al. (2020) · Nature Communications · doi:10.1038/s41467-020-17089-5 · Cited by 86
Hoang, P. H., Dobbins, S. E., Cornish, A. J., Chubb, D., Law, P., Kaiser, M., & Houlston, R. S. (2018) · Leukemia · doi:10.1038/s41375-018-0103-3 · Cited by 87
TET-dependent regulation of retrotransposable elements in mouse embryonic stem cells
de la Rica, L., Deniz, Ö., Cheng, K. C. L., Todd, C. D., Cruz, C., Houseley, J. M., & Branco, M. R. (2016) · Genome biology · doi:10.1186/s13059-016-1096-8 · Cited by 93
Identification of four novel associations for B-cell acute lymphoblastic leukaemia risk
Vijayakrishnan, J., Qian, M., Studd, J. B., Yang, W., Kinnersley, B., Law, P., Broderick, P., Raetz, E. A., Allan, J. M., Pui, C., et al. (2019) · Nature Communications · doi:10.1038/s41467-019-13069-6 · Cited by 95
Spatial patterns of CTCF sites define the anatomy of TADs and their boundaries
Nanni, L., Ceri, S., & Logie, C. (2020) · Genome Biology · doi:10.1186/s13059-020-02108-x · Cited by 88
An integrated model for detecting significant chromatin interactions from high-resolution Hi-C data
Carty, M., Zamparo, L., Şahin, M., González, Á., Pelossof, R., Elemento, O., & Leslie, C. S. (2017) · Nature Communications · doi:10.1038/ncomms15454 · Cited by 80
Increased enhancer–promoter interactions during developmental enhancer activation in mammals
Chen, Z., Snetkova, V., Bower, G., Jacinto, S. H., Clock, B., Dizehchi, A., Barozzi, I., Mannion, B. J., Alcaina‐Caro, A., López-Ríos, J., et al. (2024) · Nature Genetics · doi:10.1038/s41588-024-01681-2 · Cited by 98
Pollex, T., Rabinowitz, A. H., Gambetta, M. C., Marco-Ferreres, R., Viales, R. R., Jankowski, A., Schaub, C., & Furlong, E. E. M. (2024) · Nature Genetics · doi:10.1038/s41588-024-01678-x · Cited by 90
Multi-Omics Approaches in Immunological Research
Chu, X., Zhang, B., Koeken, V. A. C. M., Gupta, M. K., & Li, Y. (2021) · Frontiers in Immunology · doi:10.3389/fimmu.2021.668045 · Cited by 87
Transcriptional enhancers and their communication with gene promoters
Ray-Jones, H., & Spivakov, M. (2021) · Cellular and Molecular Life Sciences · doi:10.1007/s00018-021-03903-w · Cited by 81
Self-citationGlobal discovery of lupus genetic risk variant allelic enhancer activity
Lu, X., Chen, X., Forney, C. R., Donmez, O. A., Miller, D., Parameswaran, S., Hong, T., Huang, Y., Pujato, M. A., Cazares, T. A., et al. (2021) · Nature Communications · doi:10.1038/s41467-021-21854-5 · Cited by 77
Chromosome contacts in activated T cells identify autoimmune disease candidate genes
Burren, O. S., Rubio García, A., Javierre, B.-M., Rainbow, D. B., Cairns, J., Cooper, N. J., Lambourne, J. J., Schofield, E., Castro Dopico, X., Ferreira, R. C., et al. (2017) · Genome Biology · doi:10.1186/s13059-017-1285-0 · Cited by 80
Self-citationSpatial Genome Re-organization between Fetal and Adult Hematopoietic Stem Cells
Chen, C., Yu, W., Tober, J. M., Gao, P., He, B., Lee, K., Trieu, T., Blobel, G. A., Speck, N. A., & Tan, K. (2019) · Cell Reports · doi:10.1016/j.celrep.2019.11.065 · Cited by 79
Three-dimensional genome architecture and emerging technologies: looping in disease
Mishra, A., & Hawkins, R. D. (2017) · Genome Medicine · doi:10.1186/s13073-017-0477-2 · Cited by 79
Identification of 22 susceptibility loci associated with testicular germ cell tumors
Pluta, J. B., Pyle, L. C., Nead, K. T., Wilf, R., Li, M., Mitra, N., Weathers, B., D'Andrea, K. P., Almstrup, K., Anson‐Cartwright, L., et al. (2021) · Nature Communications · doi:10.1038/s41467-021-24334-y · Cited by 77
Lareau, C. A., & Aryee, M. J. (2017) · Bioinformatics · doi:10.1093/bioinformatics/btx623 · Cited by 72
Promoter capture Hi-C-based identification of recurrent noncoding mutations in colorectal cancer
Orlando, G., Law, P., Cornish, A. J., Dobbins, S. E., Chubb, D., Broderick, P., Litchfield, K., Hariri, F., Pastinen, T., Osborne, C. S., et al. (2018) · Nature Genetics · doi:10.1038/s41588-018-0211-z · Cited by 74
Self-citationYang, J., McGovern, A., Martin, P., Duffus, K., Ge, X. J., Zarrineh, P., Morris, A. P., Adamson, A. D., Fraser, P., Rattray, M., et al. (2020) · Nature Communications · doi:10.1038/s41467-020-18180-7 · Cited by 69
Self-citationChoy, M., Javierre, B. M., Williams, S. G., Baross, S. L., Liu, Y., Wingett, S., Akbarov, A., Wallace, C., Freire-Pritchett, P., Rugg‐Gunn, P. J., et al. (2018) · Nature Communications · doi:10.1038/s41467-018-04931-0 · Cited by 70
Self-citationFeng, A., Thomas, B. J., Purbey, P. K., de Melo, F. M., Liu, X., Daly, A. E., Sun, F., Lo, J. H.-H., Cheng, L., Carey, M., et al. (2024) · Immunity · doi:10.1016/j.immuni.2024.02.004 · Cited by 70
Biological constraints on GWAS SNPs at suggestive significance thresholds reveal additional BMI loci
Hammond, R. K., Pahl, M. C., Su, C., Cousminer, D. L., Leonard, M. E., Lu, S., Doege, C. A., Wagley, Y., Hodge, K. M., Lasconi, C., et al. (2021) · eLife · doi:10.7554/elife.62206 · Cited by 75
Qin, Y., Grimm, S. A., Roberts, J. D., Chrysovergis, K., & Wade, P. A. (2020) · Nature Communications · doi:10.1038/s41467-020-14796-x · Cited by 67
Zhang, S., Plummer, D., Lu, L., Cui, J., Xu, W., Wang, M., Liu, X., Prabhakar, N., Shrinet, J., Srinivasan, D., et al. (2022) · Nature Genetics · doi:10.1038/s41588-022-01116-w · Cited by 63
Self-citationEpigenetic modulation of a hardwired 3D chromatin landscape in two naive states of pluripotency
Atlasi, Y., Megchelenbrink, W., Peng, T., Habibi, E., Joshi, O., Wang, S.-Y., Wang, C., Logie, C., Poser, I., Marks, H., et al. (2019) · Nature Cell Biology · doi:10.1038/s41556-019-0310-9 · Cited by 62
Schofield, E. C., Carver, T., Achuthan, P., Freire-Pritchett, P., Spivakov, M., Todd, J. A., & Burren, O. S. (2016) · Bioinformatics · doi:10.1093/bioinformatics/btw173 · Cited by 65
Self-citationZhang, C., Chen, L., Lou, W., Su, J., Huang, J., Liu, A., Xu, Y., He, H., Gao, Y., Xu, D., et al. (2021) · Science Translational Medicine · doi:10.1126/scitranslmed.abf6045 · Cited by 66
Integrating epigenomic data and 3D genomic structure with a new measure of chromatin assortativity
Pancaldi, V., Pau, E. C. D. S., Javierre, B. M., Juan, D., Fraser, P., Spivakov, M., Valencia, A., & Rico, D. (2016) · Genome biology · doi:10.1186/s13059-016-1003-3 · Cited by 66
Self-citationCapture-C: a modular and flexible approach for high-resolution chromosome conformation capture
Downes, D. J., Smith, A., Karpińska, M. A., Velychko, T., Rue-Albrecht, K., Sims, D., Milne, T. A., Davies, J. O. J., Oudelaar, A. M., & Hughes, J. R. (2022) · Nature Protocols · doi:10.1038/s41596-021-00651-w · Cited by 62
Determining chromatin architecture with Micro Capture-C
Hamley, J. C., Li, H., Denny, N., Downes, D. J., & Davies, J. O. J. (2023) · Nature Protocols · doi:10.1038/s41596-023-00817-8 · Cited by 62
Genetic and Epigenetic Fine Mapping of Complex Trait Associated Loci in the Human Liver
Çalışkan, M., Manduchi, E., Rao, H. S., Segert, J. A., Beltrame, M. H., Trizzino, M., Park, Y., Baker, S. W., Chesi, A., Johnson, M. E., et al. (2019) · The American Journal of Human Genetics · doi:10.1016/j.ajhg.2019.05.010 · Cited by 57
Aged intestinal stem cells propagate cell-intrinsic sources of inflammaging in mice
Funk, M. C., Gleixner, J., Heigwer, F., Vonficht, D., Valentini, E., Aydin, Z., Tonin, E., Prete, S., Mahara, S., Throm, Y., et al. (2023) · Developmental Cell · doi:10.1016/j.devcel.2023.11.013 · Cited by 62
Wilson, N. K., Schoenfelder, S., Hannah, R., Castillo, M. S., Schütte, J., Ladopoulos, V., Mitchelmore, J., Goode, D. K., Calero‐Nieto, F. J., Moignard, V., et al. (2016) · Blood · doi:10.1182/blood-2015-10-677393 · Cited by 61
Self-citationPlatelet function is modified by common sequence variation in megakaryocyte super enhancers
Petersen, R., Lambourne, J. J., Javierre, B. M., Grassi, L., Kreuzhuber, R., Ruklisa, D., Rosa, I. M., Tomé, A. R., Elding, H., van Geffen, J. P., et al. (2017) · Nature Communications · doi:10.1038/ncomms16058 · Cited by 56
Self-citationSchoenfelder, S., Mifsud, B., Senner, C. E., Todd, C. D., Chrysanthou, S., Darbo, E., Hemberger, M., & Branco, M. R. (2018) · Nature Communications · doi:10.1038/s41467-018-06666-4 · Cited by 54
Self-citationWatt, S., Vasquez, L., Walter, K., Mann, A. L., Kundu, K., Chen, L., Sims, Y., Ecker, S., Burden, F., Farrow, S., et al. (2021) · Nature Communications · doi:10.1038/s41467-021-22548-8 · Cited by 63
Self-citationA model of active transcription hubs that unifies the roles of active promoters and enhancers
Zhu, I., Song, W., Ovcharenko, I., & Landsman, D. (2021) · Nucleic Acids Research · doi:10.1093/nar/gkab235 · Cited by 55
McGrath, J. M., & Panella, L. W. (2018) · Plant breeding reviews · doi:10.1002/9781119521358.ch5 · Cited by 55
Genome-wide association study of response to methotrexate in early rheumatoid arthritis patients
MATURA, O. B. O. T., Taylor, J., PAMERA, A., Consortia, Bongartz, T., Massey, J., Mifsud, B., Spiliopoulou, A., Scott, I. C., Wang, J., et al. (2018) · The Pharmacogenomics Journal · doi:10.1038/s41397-018-0025-5 · Cited by 53
Rennie, S., Dalby, M., van Duin, L., & Andersson, R. (2018) · Nature Communications · doi:10.1038/s41467-017-02798-1 · Cited by 55
Selfish: discovery of differential chromatin interactions via a self-similarity measure
Ardakany, A. R., Ay, F., & Lonardi, S. (2019) · Bioinformatics · doi:10.1093/bioinformatics/btz362 · Cited by 52
Moyo, M., Parker, J. B., & Chakravarti, D. (2020) · Nature Communications · doi:10.1038/s41467-020-14701-6 · Cited by 53
Bell, E., Curry, E. W., Megchelenbrink, W., Jouneau, L., Brochard, V., Tomaz, R. A., Mau, K. H. T., Atlasi, Y., de Souza, R. A., Marks, H., et al. (2020) · Nature Communications · doi:10.1038/s41467-020-14916-7 · Cited by 50
Chovanec, P., Collier, A. J., Krueger, C., Várnai, C., Semprich, C. I., Schoenfelder, S., Corcoran, A. E., & Rugg‐Gunn, P. J. (2021) · Nature Communications · doi:10.1038/s41467-021-22201-4 · Cited by 48
Self-citationRaviram, R., Rocha, P. P., Luo, V. M., Swanzey, E., Miraldi, E. R., Chuong, E. B., Feschotte, C., Bonneau, R., & Skok, J. A. (2018) · Genome biology · doi:10.1186/s13059-018-1598-7 · Cited by 50
Accurate and reproducible functional maps in 127 human cell types via 2D genome segmentation
Zhang, Y., & Hardison, R. C. (2017) · Nucleic Acids Research · doi:10.1093/nar/gkx659 · Cited by 47
Sud, A., Thomsen, H., Law, P., Försti, A., Filho, M. I. D. S., Holroyd, A., Broderick, P., Orlando, G., Lenive, O., Wright, L. B., et al. (2017) · Nature Communications · doi:10.1038/s41467-017-00320-1 · Cited by 49
Palermo, J., Chesi, A., Zimmerman, A. J., Sonti, S., Pahl, M. C., Lasconi, C., Brown, E., Pippin, J. A., Wells, A. D., Doldur-Balli, F., et al. (2023) · Science Advances · doi:10.1126/sciadv.abq0844 · Cited by 48
Transcriptionally active enhancers in human cancer cells
Lidschreiber, K., Jung, L. A., von der Emde, H., Dave, K., Taipale, J., Cramer, P., & Lidschreiber, M. (2021) · Molecular Systems Biology · doi:10.15252/msb.20209873 · Cited by 49
Metadata
- Authors
- Cairns, J., Freire-Pritchett, P., Wingett, S. W., Várnai, C., Dimond, A., Plagnol, V., Zerbino, D., Schoenfelder, S., Javierre, B.-M., Osborne, C., Fraser, P., & Spivakov, M.
- Affiliations
- Babraham Institute (GB)
- University College London (GB)
- European Bioinformatics Institute (GB)
- King's College London (GB)
- Corresponding author
- Spivakov, Mikhail
- ORCID
- Venue
- Genome Biology
- Published
- 2016-06-15
- Volume
- 17
- Issue
- 1
- Pages
- 127-127
- ISSN
- 1465-6906 (ISSN-L)
- 1474-760X
- PMC
- PMC4908757
- OpenAlex
- W2950020758
- Cited by
- 417
- References
- 60
- Citations by year
- 2026: 20 · 2025: 34 · 2024: 42 · 2023: 40 · 2022: 45 · 2021: 48 · 2020: 51 · 2019: 52 · 2018: 39 · 2017: 32 · 2016: 11
- FWCI
- 23.22
- Type
- journal article
- Language
- en
- Open access
- gold
- doi.org
- Licence
- cc-by
- Locations
- Genome biology (publishedVersion, cc-by)
- Europe PMC (PubMed Central) (publishedVersion, cc-by)
- PubMed Central (publishedVersion, cc-by)
- PubMed (publishedVersion)
- Research Portal (King's College London) (submittedVersion, cc-by)
- University of Birmingham Research Portal (University of Birmingham) (submittedVersion, cc-by)
- Spiral (Imperial College London) (submittedVersion, other-oa)
- Funders
- Biotechnology and Biological Sciences Research Council (GB)
- Topics
- Life Sciences › Biochemistry, Genetics and Molecular Biology › Molecular Biology › Genomics and Chromatin Dynamics
- Life Sciences › Biochemistry, Genetics and Molecular Biology › Molecular Biology › Bioinformatics and Genomic Networks
- Life Sciences › Biochemistry, Genetics and Molecular Biology › Cancer Research › Cancer-related molecular mechanisms research
- Keywords
- Capture Hi-C, chromatin looping, background modeling, normalization, multiple comparisons, Chicago, promoter interactions, regulatory elements, disease-associated SNPs
- MeSH terms
- Algorithms, Chromatin, Chromosomes, Humans, Software, Internet, Polymorphism, Single Nucleotide, Genomics
About these checks
Registry, retraction, Cites and statistics results are computed, not judged, with one exception: a printed reference that no index lists is read once by a model before it counts as a citation error. Claims are extracted by a model and kept only when their quote appears verbatim in the text; each cited source is then checked, with a model’s help, for whether it says what the claim relies on. Those verdicts can be wrong — read the claim’s quote and the cited source before relying on one.
Statistics and arithmetic are recomputed, not judged.
Confidence bands are shown only for fields calibrated on our annotated test set. None is calibrated yet, so no band is shown.
What counts as a claim ›How we measure confidence ›How we check this ›
Are you an author, or do you see a problem with this page? Request a review
