

The DOI matches its Crossref record; 36 of the 37 references it cites were found in a registry or an index.
Functional assessment of human enhancer activities using whole-genome STARR-sequencing
Open accessAbstract
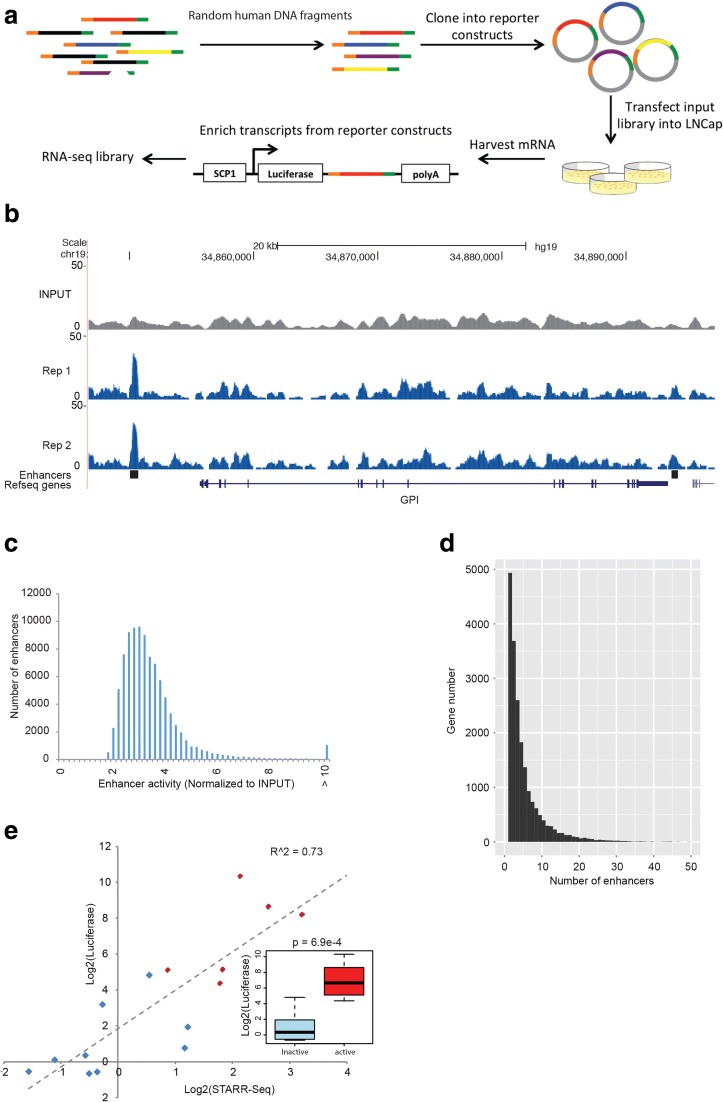
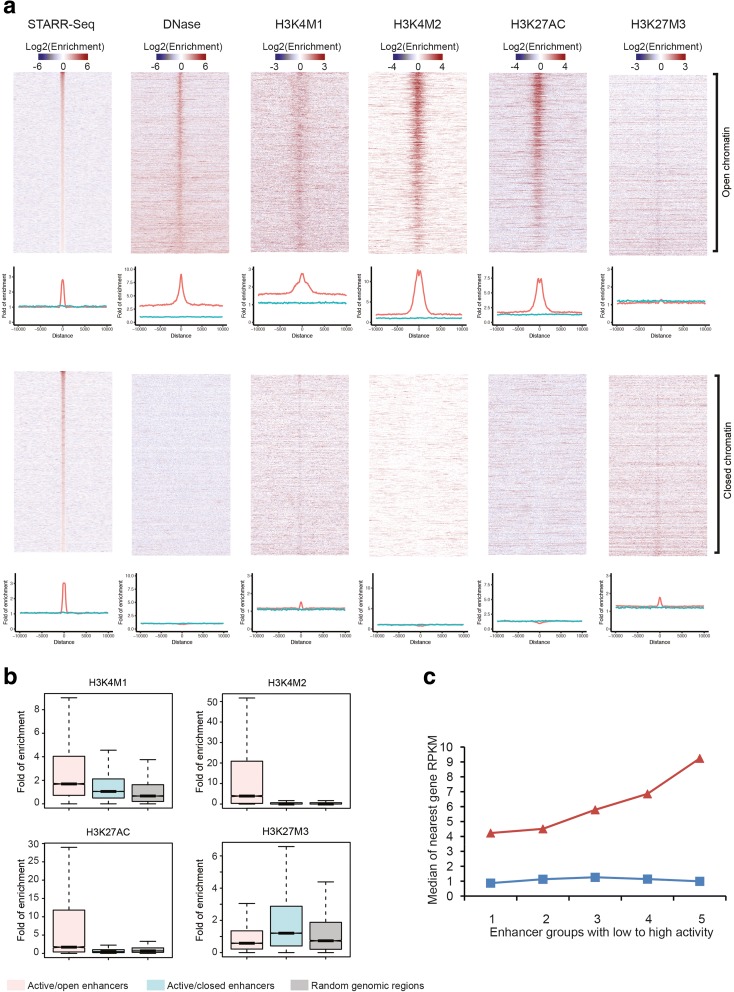
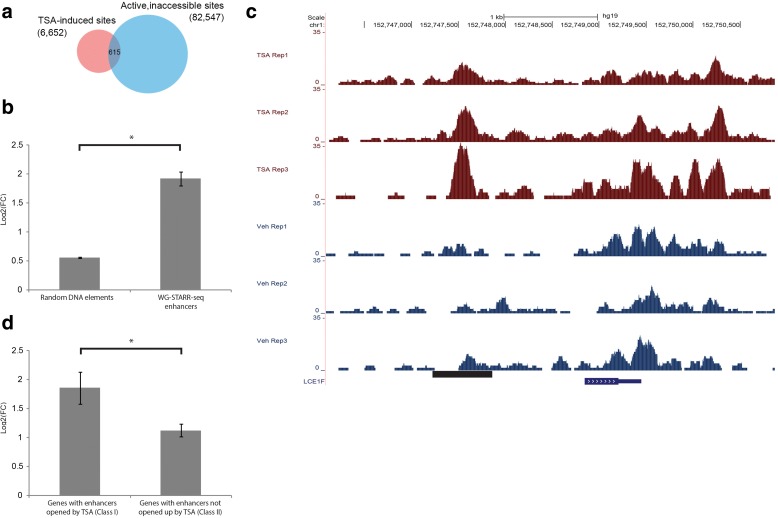
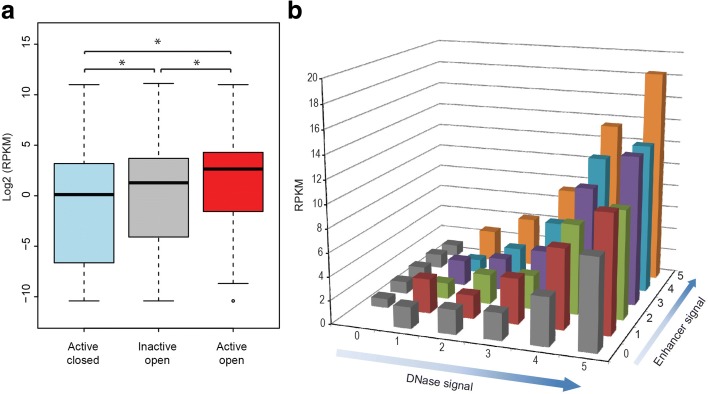
BACKGROUND: Genome-wide quantification of enhancer activity in the human genome has proven to be a challenging problem. Recent efforts have led to the development of powerful tools for enhancer quantification. However, because of genome size and complexity, these tools have yet to be applied to the whole human genome. RESULTS: In the current study, we use a human prostate cancer cell line, LNCaP as a model to perform whole human genome STARR-seq (WHG-STARR-seq) to reliably obtain an assessment of enhancer activity. This approach builds upon previously developed STARR-seq in the fly genome and CapSTARR-seq techniques in targeted human genomic regions. With an improved library preparation strategy, our approach greatly increases the library complexity per unit of starting material, which makes it feasible and cost-effective to explore the landscape of regulatory activity in the much larger human genome. In addition to our ability to identify active, accessible enhancers located in open chromatin regions, we can also detect sequences with the potential for enhancer activity that are located in inaccessible, closed chromatin regions. When treated with the histone deacetylase inhibitor, Trichostatin A, genes nearby this latter class of enhancers are up-regulated, demonstrating the potential for endogenous functionality of these regulatory elements. CONCLUSION: WHG-STARR-seq provides an improved approach to current pipelines for analysis of high complexity genomes to gain a better understanding of the intricacies of transcriptional regulation.
Overview
The claims and statistics of this paper haven’t been checked yet.
Run the check — free, no account needed. It reads the open-access text and checks the sources it cites.
Integrity signals
Registry
Cites
Statistics
Figures
Verification
Claims the paper makes
The claims and statistics of this paper haven’t been checked yet.
Run the check — free, no account needed. It reads the open-access text and checks the sources it cites.
Claims other papers make about this one
Each is checked against this paper’s own text: does it say what the citing paper says it does?
The cited source says what the claim attributes to it.
In the citing paper
“In contrast with MPRAs relying on re-synthesis of candidate sequences, genome-wide ‘shotgun MPRAs’108,174,183,188 nicely avoid a priori assumptions about which sequences to test.”
From Towards a comprehensive catalogue of validated and target-linked human enhancers (2020) · cites this paper as [183]
The cited source says what the claim attributes to it.
In the citing paper
“MPRAs have been applied to assess biochemically annotated candidate enhancers77,176-178, candidate enhancers harbouring variants that potentially mediate eQTLs179-182, and even scans of the entire human genome108,183.”
From Towards a comprehensive catalogue of validated and target-linked human enhancers (2020) · cites this paper as [183]
Self-check
Percentages, sums and reported differences re-computed from the paper’s own numbers.
The self-check needs the paper’s full text.
Citations
Cites
Fast gapped-read alignment with Bowtie 2
Langmead, B., & Salzberg, S. L. (2012) · Nature Methods · doi:10.1038/nmeth.1923 · Cited by 56,400
Robinson, M. D., McCarthy, D. J., & Smyth, G. K. (2010) · Bioinformatics · doi:10.1093/bioinformatics/btp616 · Cited by 41,364
Cutadapt removes adapter sequences from high-throughput sequencing reads
Martin, M. (2011) · EMBnet.journal · doi:10.14806/ej.17.1.200 · Cited by 33,889
Ultrafast and memory-efficient alignment of short DNA sequences to the human genome.
Langmead, B., Trapnell, C., Pop, M., & Salzberg, S. L. (2009) · Genome Biology · doi:10.1186/gb-2009-10-3-r25 · Cited by 21,849
Model-based Analysis of ChIP-Seq (MACS)
Zhang, Y., Liu, T., Meyer, C. A., Eeckhoute, J., Johnson, D. S., Bernstein, B. E., Nusbaum, C., Myers, R. M., Brown, M., Li, W., et al. (2008) · Genome Biology · doi:10.1186/gb-2008-9-9-r137 · Cited by 18,386
An integrated encyclopedia of DNA elements in the human genome
The ENCODE Project Consortium (2012) · Nature · doi:10.1038/nature11247 · Cited by 18,072
Heinz, S., Benner, C., Spann, N., Bertolino, E., Lin, Y. C., Laslo, P., Cheng, J. X., Murre, C., Singh, H., & Glass, C. K. (2010) · Molecular Cell · doi:10.1016/j.molcel.2010.05.004 · Cited by 13,382
Trapnell, C., Roberts, A., Goff, L. A., Pertea, G. M., Kim, D., Kelley, D. R., Pimentel, H., Salzberg, S. L., Rinn, J. L., & Pachter, L. S. (2012) · Nature Protocols · doi:10.1038/nprot.2012.016 · Cited by 12,145
Buenrostro, J. D., Giresi, P. G., Zaba, L. C., Chang, H. Y., & Greenleaf, W. J. (2013) · Nature Methods · doi:10.1038/nmeth.2688 · Cited by 6,422
Integrative analysis of 111 reference human epigenomes
Roadmap Epigenomics Consortium, Kundaje, A., Meuleman, W., Ernst, J., Bilenky, M., Yen, A., Heravi-Moussavi, A., Kheradpour, P., Zhang, Z., Wang, J., et al. (2015) · Nature · doi:10.1038/nature14248 · Cited by 6,368
Self-citationA bivalent chromatin structure marks key developmental genes in embryonic stem cells
Bernstein, B. E., Mikkelsen, T. S., Xie, X., Kamal, M., Huebert, D. J., Cuff, J., Fry, B., Meissner, A., Wernig, M., Plath, K., et al. (2006) · Cell · doi:10.1016/j.cell.2006.02.041 · Cited by 5,361
A unique chromatin signature uncovers early developmental enhancers in humans
Rada-Iglesias, A., Bajpai, R., Swigut, T., Brugmann, S. A., Flynn, R. A., & Wysocka, J. (2011) · Nature · doi:10.1038/nature09692 · Cited by 2,233
Transcriptional enhancers: from properties to genome-wide predictions
Shlyueva, D., Stampfel, G., & Stark, A. (2014) · Nature Reviews Genetics · doi:10.1038/nrg3682 · Cited by 1,356
Genome-Wide Quantitative Enhancer Activity Maps Identified by STARR-seq
Arnold, C. D., Gerlach, D., Stelzer, C., Boryń, Ł. M., Rath, M., & Stark, A. (2013) · Science · doi:10.1126/science.1232542 · Cited by 1,125
The selection and function of cell type-specific enhancers
Heinz, S., Romanoski, C. E., Benner, C., & Glass, C. K. (2015) · Nature Reviews Molecular Cell Biology · doi:10.1038/nrm3949 · Cited by 1,010
Systematic mapping of functional enhancer–promoter connections with CRISPR interference
Fulco, C. P., Munschauer, M., Anyoha, R., Munson, G., Grossman, S. R., Perez, E. M., Kane, M., Cleary, B., Lander, E. S., & Engreitz, J. M. (2016) · Science · doi:10.1126/science.aag2445 · Cited by 643
Massively parallel functional dissection of mammalian enhancers in vivo
Patwardhan, R. P., Hiatt, J. B., Witten, D. M., Kim, M. J., Smith, R. P., May, D., Lee, C., Andrie, J. M., Lee, S.-I., Cooper, G. M., et al. (2012) · Nature Biotechnology · doi:10.1038/nbt.2136 · Cited by 536
Enhancer–core-promoter specificity separates developmental and housekeeping gene regulation
Zabidi, M. A., Arnold, C. D., Schernhuber, K., Pagani, M., Rath, M., Frank, O., & Stark, A. (2015) · Nature · doi:10.1038/nature13994 · Cited by 471
F-Seq: a feature density estimator for high-throughput sequence tags
Boyle, A. P., Guinney, J., Crawford, G. E., & Furey, T. S. (2008) · Bioinformatics · doi:10.1093/bioinformatics/btn480 · Cited by 365
Inoue, F., Kircher, M., Martin, B., Cooper, G. M., Witten, D. M., McManus, M. T., Ahituv, N., & Shendure, J. (2017) · Genome Research · doi:10.1101/gr.212092.116 · Cited by 331
Kheradpour, P., Ernst, J., Melnikov, A., Rogov, P., Wang, L., Zhang, X., Alston, J., Mikkelsen, T. S., & Kellis, M. (2013) · Genome Research · doi:10.1101/gr.144899.112 · Cited by 315
Enhancers as information integration hubs in development: lessons from genomics
Buecker, C., & Wysocka, J. (2012) · Trends in Genetics · doi:10.1016/j.tig.2012.02.008 · Cited by 295
High-resolution interrogation of functional elements in the noncoding genome
Sanjana, N. E., Wright, J. B., Zheng, K., Shalem, O., Fontanillas, P., Joung, J., Cheng, C. S., Regev, A., & Zhang, F. (2016) · Science · doi:10.1126/science.aaf7613 · Cited by 290
Decoding enhancers using massively parallel reporter assays
Inoue, F., & Ahituv, N. (2015) · Genomics · doi:10.1016/j.ygeno.2015.06.005 · Cited by 272
A tiling-deletion-based genetic screen for cis-regulatory element identification in mammalian cells
Diao, Y., Fang, R., Li, B., Meng, Z., Yu, J., Qiu, Y., Lin, K. C., Huang, H., Liu, T., Marina, R. J., et al. (2017) · Nature Methods · doi:10.1038/nmeth.4264 · Cited by 259
Smith, R. P., Taher, L., Patwardhan, R. P., Kim, M. J., Inoue, F., Shendure, J., Ovcharenko, I., & Ahituv, N. (2013) · Nature Genetics · doi:10.1038/ng.2713 · Cited by 239
High-throughput functional testing of ENCODE segmentation predictions
Kwasnieski, J. C., Fiore, C., Chaudhari, H. G., & Cohen, B. A. (2014) · Genome Research · doi:10.1101/gr.173518.114 · Cited by 224
Arnold, C. D., Gerlach, D., Spies, D., Matts, J. A., Sytnikova, Y. A., Pagani, M., Lau, N. C., & Stark, A. (2014) · Nature Genetics · doi:10.1038/ng.3009 · Cited by 175
High-throughput and quantitative assessment of enhancer activity in mammals by CapStarr-seq
Vanhille, L., Griffon, A., Maqbool, M. A., Zacarias-Cabeza, J., Dao, L. T. M., Fernandez, N., Ballester, B., Andrau, J. C., & Spicuglia, S. (2015) · Nature Communications · doi:10.1038/ncomms7905 · Cited by 158
Shlyueva, D., Stelzer, C., Gerlach, D., Yáñez-Cuna, J. O., Rath, M., Boryń, Ł. M., Arnold, C. D., & Stark, A. (2014) · Molecular Cell · doi:10.1016/j.molcel.2014.02.026 · Cited by 142
Deciphering the transcriptional cis-regulatory code
Yáñez-Cuna, J. O., Kvon, E. Z., & Stark, A. (2012) · Trends in Genetics · doi:10.1016/j.tig.2012.09.007 · Cited by 126
STARR-seq — Principles and applications
Muerdter, F., Boryń, Ł. M., & Arnold, C. D. (2015) · Genomics · doi:10.1016/j.ygeno.2015.06.001 · Cited by 109
Murtha, M. J., Keskin, Z. T., Tang, Z., Strino, F., Chen, X. X., Wang, Y., Xi, X., Basilico, C., Brown, S. M., Bonneau, R., et al. (2014) · Nature Methods · doi:10.1038/nmeth.2885 · Cited by 94
Function-based identification of mammalian enhancers using site-specific integration
Dickel, D. E., Zhu, Y., Nord, A. S., Wylie, J. N., Akiyama, J. A., Afzal, V., Plajzer-Frick, I., Kirkpatrick, A. M., Göttgens, B., Bruneau, B. G., et al. (2014) · Nature Methods · doi:10.1038/nmeth.2886 · Cited by 87
Highly parallel assays of tissue-specific enhancers in whole Drosophila embryos
Gisselbrecht, S. S., Barrera, L. A., Porsch, M., Aboukhalil, A., Estep, P. W., Vedenko, A., Palagi, A., Kim, Y., Zhu, X., Busser, B. W., et al. (2013) · Nature Methods · doi:10.1038/nmeth.2558 · Cited by 65
The Greater Complexity of Eukaryotic Genomes Requires Elaborate Mechanisms for Gene Regulation
Berg, J. M., Tymoczko, J. L., & Stryer, L. (2002) · Cited by 1
Research works printed but not linked: 1
- Liu Y, Yu S, Dhiman V, Brunetti T, Scott H, White K. Genome-wide functional assessment of enhancer activities in the human genome. Gene Expression Omnibus. 2017. https://www.ncbi.nlm.nih.gov/geo/query/acc.cgi?acc=GSE82204 .
Cited by
Sorted by citations
Comprehensive functional genomic resource and integrative model for the human brain
Wang, D., Liu, S., Warrell, J., Won, H., Shi, X., Navarro, F. C. P., Clarke, D., Gu, M., Emani, P., Yang, Y. T., et al. (2018) · Science · doi:10.1126/science.aat8464 · Cited by 965
Self-citationDefining the genetic, genomic, cellular, and diagnostic architectures of psychiatric disorders
Sullivan, P. F., & Geschwind, D. H. (2019) · Cell · doi:10.1016/j.cell.2019.01.015 · Cited by 452
“Techniques such as self-transcribing active-regulatory-region sequencing (STARR-seq) permit large-scale validation (which suggests enhancer functionality) (Arnold et al., 2013; Liu et al., 2017b), while analysis in an appropriate cell type with epigenome-editing technologies can confirm target identity (de la Torre-Ub…”
MethodTowards a comprehensive catalogue of validated and target-linked human enhancers
Gasperini, M., Tome, J. M., & Shendure, J. (2020) · Nature Reviews Genetics · doi:10.1038/s41576-019-0209-0 · Cited by 396
Sequence determinants of human gene regulatory elements
Sahu, B., Hartonen, T., Pihlajamaa, P., Wei, B., Dave, K., Zhu, F., Kaasinen, E., Lidschreiber, K., Lidschreiber, M., Daub, C. O., et al. (2022) · Nature Genetics · doi:10.1038/s41588-021-01009-4 · Cited by 198
Wang, X., He, L., Goggin, S. M., Saadat, A., Wang, L., Sinnott-Armstrong, N., Claussnitzer, M., & Kellis, M. (2018) · Nature Communications · doi:10.1038/s41467-018-07746-1 · Cited by 159
Metadata
- Authors
- Liu, Y., Yu, S., Dhiman, V. K., Brunetti, T., Eckart, H., & White, K. P.
- Affiliations
- Argonne National Laboratory (US)
- University of Chicago (US)
- Corresponding author
- White, Kevin P.
- Venue
- Genome Biology
- Published
- 2017-11-20
- Volume
- 18
- Issue
- 1
- Pages
- 219-219
- ISSN
- 1465-6906 (ISSN-L)
- 1474-760X
- PMC
- PMC5694901
- OpenAlex
- W2769418303
- Cited by
- 136
- References
- 37
- Citations by year
- 2026: 6 · 2025: 18 · 2024: 21 · 2023: 15 · 2022: 17 · 2021: 15 · 2020: 19 · 2019: 13 · 2018: 11 · 2017: 1
- FWCI
- 5.67
- Type
- journal article
- Language
- en
- Open access
- gold
- doi.org
- Locations
- Genome biology (publishedVersion, cc-by)
- PubMed Central (publishedVersion, cc-by)
- PubMed (publishedVersion)
- OSTI OAI (U.S. Department of Energy Office of Scientific and Technical Information) (submittedVersion)
- DOAJ (DOAJ: Directory of Open Access Journals) (submittedVersion, cc-by-sa)
- Funders
- National Institutes of Health (U54HG006996)
- Topics
- Life Sciences › Biochemistry, Genetics and Molecular Biology › Molecular Biology › Genomics and Chromatin Dynamics
- Life Sciences › Biochemistry, Genetics and Molecular Biology › Molecular Biology › Chromatin Remodeling and Cancer
- Life Sciences › Biochemistry, Genetics and Molecular Biology › Molecular Biology › Epigenetics and DNA Methylation
- Keywords
- enhancer activity, STARR-seq, LNCaP cells, open chromatin, closed chromatin, histone deacetylase inhibition, trichostatin A, transcriptional regulation, library preparation, prostate cancer
- MeSH terms
- Whole Genome Sequencing, Cell Line, Chromatin, Enhancer Elements, Genetic, Humans, Genomic Library, Genome, Human, Genomics, Chromatin Immunoprecipitation, High-Throughput Nucleotide Sequencing
About these checks
Registry, retraction, Cites and statistics results are computed, not judged, with one exception: a printed reference that no index lists is read once by a model before it counts as a citation error. Claims are extracted by a model and kept only when their quote appears verbatim in the text; each cited source is then checked, with a model’s help, for whether it says what the claim relies on. Those verdicts can be wrong — read the claim’s quote and the cited source before relying on one.
Statistics and arithmetic are recomputed, not judged.
Confidence bands are shown only for fields calibrated on our annotated test set. None is calibrated yet, so no band is shown.
What counts as a claim ›How we measure confidence ›How we check this ›
Are you an author, or do you see a problem with this page? Request a review
