

The DOI matches its Crossref record; 73 of the 73 references it cites were found in a registry or an index.
Feature selection and dimension reduction for single-cell RNA-Seq based on a multinomial model
Open accessPublished version of a preprint
Abstract
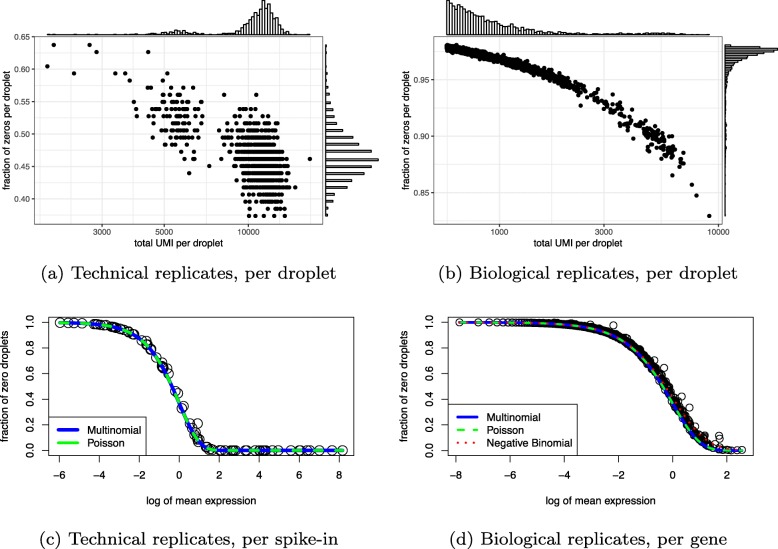
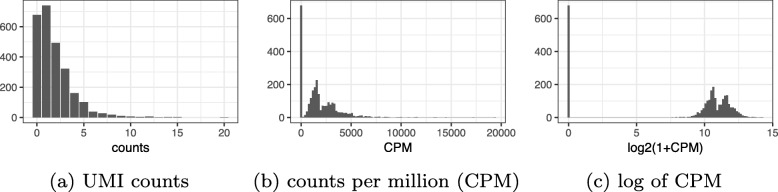
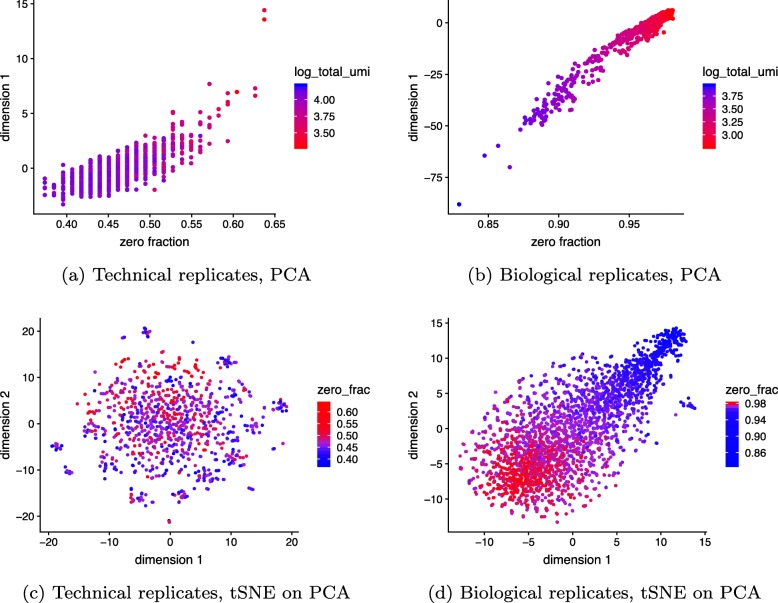
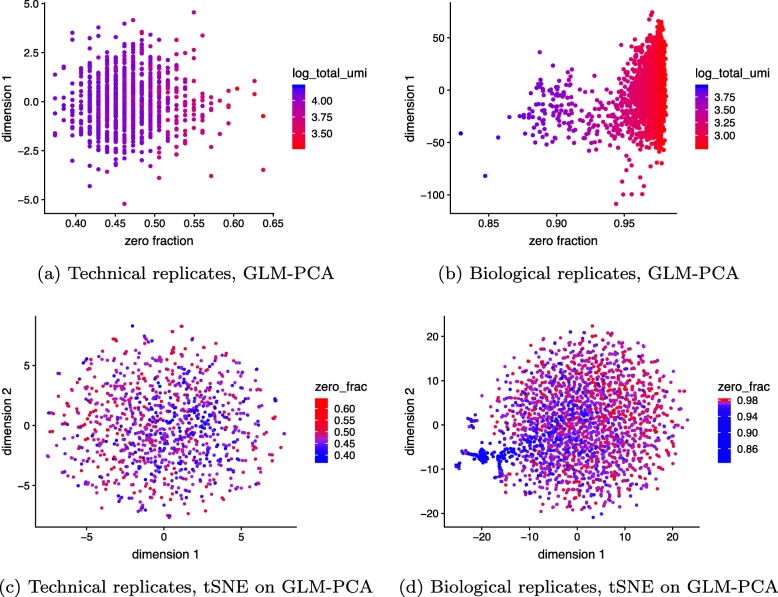
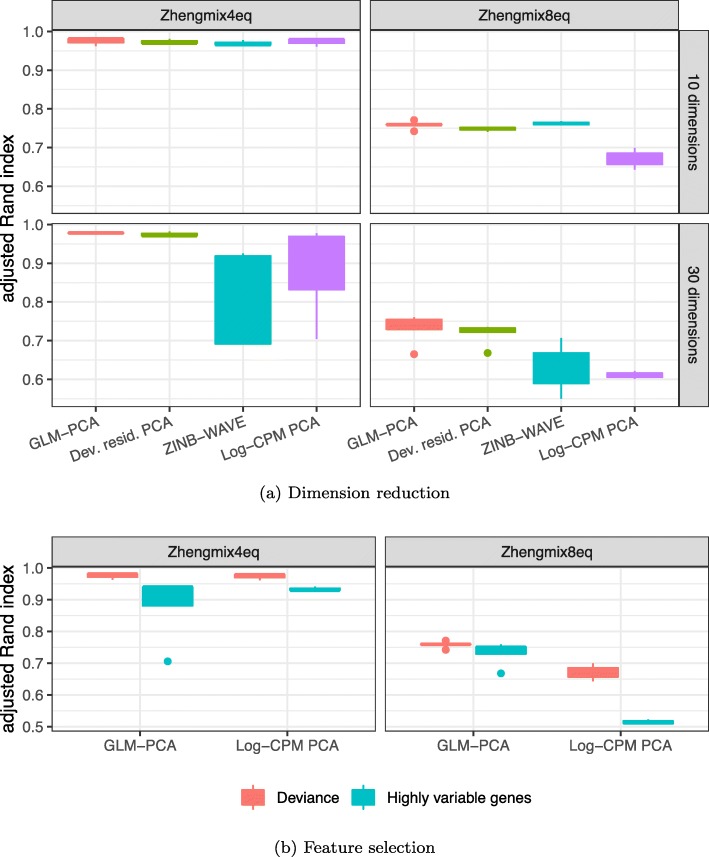
Single-cell RNA-Seq (scRNA-Seq) profiles gene expression of individual cells. Recent scRNA-Seq datasets have incorporated unique molecular identifiers (UMIs). Using negative controls, we show UMI counts follow multinomial sampling with no zero inflation. Current normalization procedures such as log of counts per million and feature selection by highly variable genes produce false variability in dimension reduction. We propose simple multinomial methods, including generalized principal component analysis (GLM-PCA) for non-normal distributions, and feature selection using deviance. These methods outperform the current practice in a downstream clustering assessment using ground truth datasets.
Overview
The claims and statistics of this paper haven’t been checked yet.
Run the check — free, no account needed. It reads the open-access text and checks the sources it cites.
Integrity signals
Registry
Cites
Statistics
Figures
Verification
Claims the paper makes
The claims and statistics of this paper haven’t been checked yet.
Run the check — free, no account needed. It reads the open-access text and checks the sources it cites.
Claims other papers make about this one
Each is checked against this paper’s own text: does it say what the citing paper says it does?
In the citing paper
“Deviance identifies highly informative genes by fitting a gene-wise model that assumes constant expression across all cells and quantifying which genes violate this assumption47.”
From Best practices for single-cell analysis across modalities (2023) · cites this paper as [47]
Self-check
Percentages, sums and reported differences re-computed from the paper’s own numbers.
The self-check needs the paper’s full text.
Citations
Cites
Algorithm AS 136: A K-Means Clustering Algorithm
Hartigan, J. A., & Wong, M. A. (1979) · Applied Statistics · doi:10.2307/2346830 · Cited by 14,523
Integrating single-cell transcriptomic data across different conditions, technologies, and species
Butler, A., Hoffman, P., Smibert, P., Papalexi, E., & Satija, R. (2018) · Nature Biotechnology · doi:10.1038/nbt.4096 · Cited by 13,174
Analysis of a complex of statistical variables into principal components.
Hotelling, H. (1933) · Journal of Educational Psychology · doi:10.1037/h0071325 · Cited by 9,691
Advances in Neural Information Processing Systems 14
(2002) · The MIT Press eBooks · doi:10.7551/mitpress/1120.001.0001 · Cited by 9,187
Hubert, L., & Arabie, P. (1985) · Journal of Classification · doi:10.1007/bf01908075 · Cited by 8,219
Massively parallel digital transcriptional profiling of single cells
Zheng, G. X. Y., Terry, J. M., Belgrader, P., Ryvkin, P., Bent, Z. W., Wilson, R., Ziraldo, S. B., Wheeler, T. D., McDermott, G. P., Zhu, J., et al. (2017) · Nature Communications · doi:10.1038/ncomms14049 · Cited by 7,353
Trapnell, C., Cacchiarelli, D., Grimsby, J., Pokharel, P., Li, S., Morse, M., Lennon, N. J., Livak, K. J., Mikkelsen, T. S., & Rinn, J. L. (2014) · Nature Biotechnology · doi:10.1038/nbt.2859 · Cited by 7,314
Highly parallel genome-wide expression profiling of individual cells using nanoliter droplets.
Macosko, E. Z., Basu, A., Satija, R., Nemesh, J., Shekhar, K., Goldman, M., Tirosh, I., Bialas, A. R., Kamitaki, N., Martersteck, E. M., et al. (2015) · Cell · doi:10.1016/j.cell.2015.05.002 · Cited by 7,110
UMAP: Uniform Manifold Approximation and Projection for Dimension Reduction
McInnes, L., Healy, J., & Melville, J. (2018) · arXiv · doi:10.48550/arxiv.1802.03426 · Cited by 7,101
Hafemeister, C., & Satija, R. (2019) · Genome Biology · doi:10.1186/s13059-019-1874-1 · Cited by 4,479 · cited 1×
“Recently, Pearson residuals based on a negative binomial null model have also been independently proposed as the sctransform method [60].”
Method
Cited by
Sorted by citations
Items 301–400 of 476
Non-genetic differences underlie variability in proliferation among esophageal epithelial clones
Hueros, R. A. R., Gier, R. A., & Shaffer, S. M. (2024) · PLoS Computational Biology · doi:10.1371/journal.pcbi.1012360 · Cited by 3
Analysis of a Single Cell RNA-seq Workflow by Random Matrix Theory Methods
Leviyang, S. (2024) · Bulletin of Mathematical Biology · doi:10.1007/s11538-024-01376-z · Cited by 4
Jepsen, V. H., Hänel, A., Picard, D. J., Bhave, R., Hasselmann, R., Mehtonen, J., Schliehe‐Diecks, J., Kath, C., Suppiyar, V., Prasad, Y., et al. (2025) · HemaSphere · doi:10.1002/hem3.70116 · Cited by 5
Spatial mutual nearest neighbors for spatial transcriptomics data
Zhou, H., Panwar, P., Guo, B., Hallinan, C., Ghazanfar, S., & Hicks, S. C. (2025) · Bioinformatics · doi:10.1093/bioinformatics/btaf403 · Cited by 3
Self-citationExtremely Sparse Johnson-Lindenstrauss Transform: From Theory to Algorithm
Yin, R., Liu, Y., Wang, W., & Meng, D. (2020) · Proceedings · doi:10.1109/icdm50108.2020.00180 · Cited by 3
SEMITONES: Single-cEll Marker IdentificaTiON by Enrichment ScoringPreprint
Vlot, A. H. C., Maghsudi, S., & Ohler, U. (2020) · bioRxiv (Cold Spring Harbor Laboratory) · doi:10.1101/2020.11.17.386664 · Cited by 3
Beshiri, M. L., Capaldo, B. J., Lake, R. G., Ku, A. T., Burner, D. N., Tice, C. M., Tran, C., Kostas, J., Alilin, A. N., Yin, J., et al. (2022) · bioRxiv (Cold Spring Harbor Laboratory) · doi:10.1101/2022.03.24.484651 · Cited by 3
User Engagement Metrics and Patterns in Phendo, an Endometriosis Research Mobile AppPreprint
Elhadad, N., Urteaga, I., Gorman, S. L., & McKillop, M. M. (2022) · Research Square · doi:10.21203/rs.3.rs-1862924/v1 · Cited by 4
Kim, M. C., Gate, R. E., Lee, D. S., Lu, A. C., Gordon, E. D., Shifrut, E., Marson, A., Ntranos, V., & Ye, C. (2022) · bioRxiv (Cold Spring Harbor Laboratory) · doi:10.1101/2022.11.09.515836 · Cited by 3
Genome-wide profiling of DNA repair proteins identifies higher-order coordination in single cellsPreprint
de Luca, K. L., Rullens, P. M. J., Karpińska, M. A., de Vries, S. S., Gacek‐Matthews, A., Pongor, L. S., Legube, G., Jachowicz, J. W., Oudelaar, A. M., & Kind, J. (2023) · bioRxiv (Cold Spring Harbor Laboratory) · doi:10.1101/2023.05.10.540169 · Cited by 3
Elsborg, J., & Salvatore, M. (2023) · bioRxiv (Cold Spring Harbor Laboratory) · doi:10.1101/2023.08.24.554441 · Cited by 3
Improved differential expression analysis of miRNA-seq data by modeling competition to be countedPreprint
Jun, S.-H., Halushka, M. K., & McCall, M. N. (2024) · bioRxiv (Cold Spring Harbor Laboratory) · doi:10.1101/2024.05.07.592964 · Cited by 3
Interpretable single-cell factor decomposition using sciREDPreprint
Pouyabahar, D., Andrews, T. S., & Bader, G. D. (2024) · bioRxiv (Cold Spring Harbor Laboratory) · doi:10.1101/2024.08.01.605536 · Cited by 3
Statistical significance of clustering for count data
Dai, Y., Wu, D., & Liu, Y. (2025) · Biometrics · doi:10.1093/biomtc/ujaf120 · Cited by 2
scDenorm: a denormalization tool for integrating single-cell transcriptomics data
Huang, Y., Pournara, A. V., Ao, Y., Huang, Z., Zhang, H. Y., Zhang, Y., Liu, S., Brāzma, A., Papatheodorou, I., Yang, X., et al. (2026) · GigaScience · doi:10.1093/gigascience/giag032 · Cited by 1
Probabilistic modelling of single-cell bisulfite sequencing data with MethylVI
Weinberger, E., Qiu, W., Tian, W., Zeng, Q., Ergen, C., Kronfeld, O., Kim, M., Yosef, N., Ecker, J. R., & Lee, S. (2026) · Nature Machine Intelligence · doi:10.1038/s42256-026-01225-9 · Cited by 2
Guarducci, C., Abravanel, D. L., Russo, D., Prasad, K., Fu, J., Nagy, Z., Rao, V., Nardone, A., Kuang, Y., Feit, A. S., et al. (2026) · Genome Medicine · doi:10.1186/s13073-026-01690-2 · Cited by 2
O’Callaghan, A., Eling, N., Marioni, J. C., & Vallejos, C. A. (2022) · F1000Research · doi:10.12688/f1000research.74416.1 · Cited by 4
Prater, K. E., & Lin, K. (2024) · Glia · doi:10.1002/glia.24633 · Cited by 3
Youtsey, L. S., Reece, K. S., Snyder, R. A., & McDowell, J. R. (2025) · Frontiers in Marine Science · doi:10.3389/fmars.2025.1574486 · Cited by 2
LOUKMAN, S., Mrid, R. B., Bouchmaa, N., Hboub, H., Fatimy, R. E., & Benhida, R. (2025) · Computational and Structural Biotechnology Reports · doi:10.1016/j.csbr.2025.100059 · Cited by 2
Witjes, V. L., de Jong, I. C., Velkers, F. C., Rebel, J. M. J., Stegeman, A., Bolhuis, J. E., & Meijer, E. (2025) · Applied Animal Behaviour Science · doi:10.1016/j.applanim.2025.106822 · Cited by 2
Percolate: An Exponential Family JIVE Model to Design DNA-Based Predictors of Drug Response
Mourragui, S. M. C., Loog, M., van Nee, M. M., van de Wiel, M. A., Reinders, M. J. T., & Wessels, L. F. A. (2023) · Lecture notes in computer science · doi:10.1007/978-3-031-29119-7_8 · Cited by 2
DSAVE: Detection of misclassified cells in single-cell RNA-Seq data
Gustafsson, J., Robinson, J. L., Inda-Díaz, J. S., Björnson, E., Jörnsten, R. J., & Nielsen, J. (2020) · PLoS ONE · doi:10.1371/journal.pone.0243360 · Cited by 2
Jee, D. J., Kong, Y., & Chun, H. (2022) · IEEE Transactions on Computational Biology and Bioinformatics · doi:10.1109/tcbb.2022.3172723 · Cited by 2
Comparison of scRNA-seq data analysis method combinations
Xu, L., Xue, T., Ding, W., & Shen, L. (2022) · Briefings in Functional Genomics · doi:10.1093/bfgp/elac027 · Cited by 2
Pre-processing, Dimension Reduction, and Clustering for Single-Cell RNA-seq Data
Hu, J., Wang, Y., Zhou, X., & Chen, M. (2022) · Springer handbooks of computational statistics · doi:10.1007/978-3-662-65902-1_2 · Cited by 2
EVALUATING THE COMPLEXITY OF GENE COEXPRESSION ESTIMATION FOR SINGLE-CELL DATA
Zhang, J., & Singh, R. (2023) · Journal of Machine Learning for Modeling and Computing · doi:10.1615/jmachlearnmodelcomput.2023047230 · Cited by 2
Benchmarking UMI-based single cell RNA-sequencing preprocessing workflowsPreprint
You, Y., Tian, L., Su, S., Dong, X., Jabbari, J. S., Hickey, P. F., & Ritchie, M. E. (2021) · bioRxiv (Cold Spring Harbor Laboratory) · doi:10.1101/2021.06.17.448895 · Cited by 2
Fang, J., Chan, C. C. W., Owzar, K., Wang, L., Qin, D., Li, Q.-J., & Xie, J. (2022) · bioRxiv (Cold Spring Harbor Laboratory) · doi:10.1101/2022.01.03.474840 · Cited by 2
Total-mRNA-Aware Analysis for Droplet-Based Single Cell SequencingPreprint
Lian, Q., Ma, J., Hua, K., Rong, Z., Cai, J., Jiang, X., Zhou, J., Xu, J., Zhang, Z., Fan, L., et al. (2022) · Research Square · doi:10.21203/rs.3.rs-2211167/v1 · Cited by 2
User-friendly exploration of epigenomic data in single cells using sinceiPreprint
Bhardwaj, V., & Mourragui, S. M. C. (2024) · bioRxiv (Cold Spring Harbor Laboratory) · doi:10.1101/2024.07.27.605424 · Cited by 4
APOE E4 Alzheimer’s Risk Converges on an Oligodendrocyte Subtype in the Human Entorhinal CortexPreprint
Huuki-Myers, L. A., Divecha, H. R., Bach, S. V., Valentine, M. R., Eagles, N. J., Mulvey, B., Bharadwaj, R. A., Zhang, R., Evans, J. R., Grant‐Peters, M., et al. (2025) · bioRxiv (Cold Spring Harbor Laboratory) · doi:10.1101/2025.11.20.689483 · Cited by 4
FlashDeconv reveals resolution horizons in atlas-scale spatial transcriptomicsPreprint
Yang, C., Zhang, X., & Chen, J. (2025) · bioRxiv (Cold Spring Harbor Laboratory) · doi:10.64898/2025.12.22.696108 · Cited by 2
LLM-scCurator: Data-centric feature distillation for zero-shot cell-type annotationPreprint
Furudate, K., & Takahashi, K. (2025) · bioRxiv (Cold Spring Harbor Laboratory) · doi:10.64898/2025.12.28.696778 · Cited by 2
Clonal embeddings allow exploratory analysis of lineage-resolved single-cell dataPreprint
Isaev, S., Erickson, A. G., Adameyko, I., & Kharchenko, P. V. (2026) · bioRxiv (Cold Spring Harbor Laboratory) · doi:10.64898/2026.04.30.720820 · Cited by 2
Local causal pathway discovery for single-cell RNA sequencing count data: a benchmark study
Ma, S., Wang, J., Bieganek, C., Tourani, R., & Aliferis, C. (2023) · Journal of Translational Genetics and Genomics · doi:10.20517/jtgg.2022.22 · Cited by 1
Simmons, S., Adiconis, X., Haywood, N., Parker, J. J., Lin, Z., Liao, Z., Tuncali, I., Al’Khafaji, A. M., Shin, A., Jagadeesh, K. A., et al. (2026) · Genome biology · doi:10.1186/s13059-026-04062-6 · Cited by 3
Venturino, A., Alamalhoda, M., Negrello, T., Jin, K., van Velthoven, C. T. J., Cubero, R. J., Yeung, J., Koppensteiner, P., Tasic, B., & Siegert, S. (2026) · Science Advances · doi:10.1126/sciadv.adz6517 · Cited by 1
Dugo, E., Piva, F., Giulietti, M., Giannella, L., & Ciavattini, A. (2025) · Journal of Cellular and Molecular Medicine · doi:10.1111/jcmm.70932 · Cited by 1
Tong, Y., Hong, R., Li, M., Yang, N., Deng, W., Tang, H., Zeng, T., & Liu, R. (2025) · Briefings in Bioinformatics · doi:10.1093/bib/bbaf568 · Cited by 1
Wang, C., Chen, Z., & Xi, R. (2025) · The Annals of Applied Statistics · doi:10.1214/25-aoas2102 · Cited by 2
Lv, Y. X., Qi, L., Wang, P., Liu, H., Chen, C., Gu, J., Kang, X., & Chen, C. (2026) · Bioinformatics · doi:10.1093/bioinformatics/btag084 · Cited by 1
Zhang, Y., Yang, B., Yu, Y., Wang, X., Niu, C., Zhang, Y., Liu, Y., Li, J., Zhang, C., Yang, J., et al. (2026) · Nature Communications · doi:10.1038/s41467-026-70582-1 · Cited by 1
PLNFGL: joint estimation of multi-condition gene networks from single-cell RNA-seq data
Zhai, W., Zhou, D., Yuan, Z., & Ji, J. (2026) · Bioinformatics · doi:10.1093/bioinformatics/btag485 · Cited by 1
Pouralibaba, H. R., Mohammadi, N., Afshari, F., Safavi, S. A., Yassaie, M., & Atahoseini, S. M. (2021) · Indian Phytopathology · doi:10.1007/s42360-021-00324-4 · Cited by 1
Liu, Y., Shi, B., Wu, A., Peng, X., Yuan, Z., Liu, L., & Liu, L. (2021) · Life · doi:10.3390/life11070716 · Cited by 1
Computational Analysis of Single-Cell RNA-Seq Data
Hwang, B. (2022) · Methods in molecular biology · doi:10.1007/978-1-0716-2815-7_12 · Cited by 1
Statistical Methods for Spatially Re-solved Transcriptomic Data Analysis
王, 琳. (2023) · Bioprocess · doi:10.12677/bp.2023.131008 · Cited by 1
Optimal Supervised Reduction of High Dimensional Transcription Data
Bailey, R., Sarkar, A., Singh, A., Dobra, A., & Kahveci, T. (2023) · IEEE Transactions on Computational Biology and Bioinformatics · doi:10.1109/tcbb.2023.3280557 · Cited by 1
Early Alzheimer’s Prediction Using Dimensionality Reduction Techniques
Paplomatas, P., & Vrahatis, A. G. (2023) · Springer eBooks · doi:10.1007/978-3-319-75922-7_65 · Cited by 1
MUFFIN: a suite of tools for the analysis of functional sequencing data
de Langen, P., & Ballester, B. (2024) · NAR Genomics and Bioinformatics · doi:10.1093/nargab/lqae051 · Cited by 1
Best holdout assessment is sufficient for cancer transcriptomic model selection
Crawford, J., Chikina, M. D., & Greene, C. S. (2024) · Patterns · doi:10.1016/j.patter.2024.101115 · Cited by 2
The Interplay of Ontogeny and Phylogeny at the Transcriptome Level of the Tetrapod Heart
Cordero, G. A., Holloway, A. K., Friedrich, T., Eme, J., Eckalbar, W. L., Kusumi, K., Janzen, F. J., Hicks, J. W., Conlon, F. L., Bruneau, B. G., et al. (2025) · Journal of Experimental Zoology Part B Molecular and Developmental Evolution · doi:10.1002/jez.b.23312 · Cited by 1
Street, K., Zhang, Y., Siegmund, K. D., & Shibata, D. (2025) · Scientific Reports · doi:10.1038/s41598-025-24703-3 · Cited by 2
Next generation statistical framework for next generation spatial transcriptomics data
Mangane, F., & Bost, P. (2026) · BMC Methods · doi:10.1186/s44330-026-00055-w · Cited by 1
Persistent features of intermittent transcription
Wilkinson, M., Darmanis, S., Pisco, A. O., & Huber, G. (2020) · Scientific Reports · doi:10.1038/s41598-020-60094-3 · Cited by 1
Ma, Y. (2020) · Louisiana State University · doi:10.31390/gradschool_dissertations.5427 · Cited by 1
minicore: Fast scRNA-seq clustering with various distancesPreprint
Baker, D. N., Dyjack, N., Braverman, V., Hicks, S. C., & Langmead, B. (2021) · bioRxiv (Cold Spring Harbor Laboratory) · doi:10.1101/2021.03.24.436859 · Cited by 1
Self-citationCompound models and Pearson residuals for single-cell RNA-seq data without UMIsPreprint
Lause, J., Ziegenhain, C., Hartmanis, L., Berens, P., & Kobak, D. (2023) · bioRxiv (Cold Spring Harbor Laboratory) · doi:10.1101/2023.08.02.551637 · Cited by 1
glmpca: Dimension Reduction of Non-Normally Distributed Data
Townes, F. W., & Street, K. (2019) · doi:10.32614/cran.package.glmpca · Cited by 1
Self-citationStrategies for addressing pseudoreplication in multi-patient scRNA-seq dataPreprint
Malfait, M., Gilis, J., den Berge, K. V., Assefa, A. T., Verbist, B. M. P., & Clement, L. (2024) · bioRxiv (Cold Spring Harbor Laboratory) · doi:10.1101/2024.06.15.599144 · Cited by 3
GeneJepa: A Predictive World Model of the TranscriptomePreprint
Litman, E., Myers, T. D., Agarwal, V., Mittal, E., Li, O., Gopinath, A., & Kassis, T. (2025) · bioRxiv (Cold Spring Harbor Laboratory) · doi:10.1101/2025.10.14.682378 · Cited by 4
Mulvey, B., Divecha, H. R., Tippani, M., Bach, S. V., Bharadwaj, R. A., Rosario, I. D., Maguire, S. E., Miller, R. A., Salisbury, A. J., Chandra, A., et al. (2025) · bioRxiv (Cold Spring Harbor Laboratory) · doi:10.1101/2025.10.29.685354 · Cited by 1
Self-citationJoint imputation and deconvolution of gene expression across spatial transcriptomics platformsPreprint
Zheng, H., Sarkar, H., & Raphael, B. J. (2025) · Genome Research · doi:10.1101/gr.280555.125 · Cited by 1
Dataset structure outweighs method choice in single-cell cell-type annotationPreprint
Wardhana, O. (2026) · bioRxiv (Cold Spring Harbor Laboratory) · doi:10.64898/2026.08.28.747622 · Cited by 1
Approximate kNN Classification for Biomedical Data
Anagnostou, P., Barbas, P., Vrahatis, A. G., & Tasoulis, S. K. (2020) · IEEE International Conference on Big Data (BigData) · doi:10.1109/bigdata50022.2020.9378126 · Cited by 15
Netskar, H. (2019) · NORA - Norwegian Open Research Archives
Methods for Single Cell and Longevity Genomics
Townes, F. W. (2019) · Digital Access to Scholarship at Harvard (DASH) (Harvard University)
Self-citationOocytes, a single cell and a tissuePreprint
Wu, D., & Dean, J. (2020) · bioRxiv (Cold Spring Harbor Laboratory) · doi:10.1101/2020.02.17.952929
Next Generation Sequencing Methods: Pushing the Boundaries
Finnegan, L. A., Crispie, F., Claesson, M. J., Cotter, P. D., & Kenny, J. G. (2020) · Elsevier eBooks · doi:10.1016/b978-0-08-100596-5.22688-7
Single-Cell Transcriptome Sequencing Using Microfluidics
Chen, Y., Jung, S., Choi, Y., & Yoon, E. (2020) · Springer eBooks · doi:10.1007/978-981-10-4857-9_42-1
Lee, H., Kim, C., Jeong, J., Jung, K., & Han, B. (2020) · bioRxiv (Cold Spring Harbor Laboratory) · doi:10.1101/2020.09.17.301911
Single-cell RNA sequencing in cardiovascular science
Aghagolzadeh, P., & Pedrazzini, T. (2021) · Elsevier eBooks · doi:10.1016/b978-0-12-822258-4.00014-6
Assessing and removing the effect of unwanted technical variations in microbiome dataPreprint
Fachrul, M., Méric, G., Inouye, M., Pamp, S. J., & Salim, A. (2021) · bioRxiv (Cold Spring Harbor Laboratory) · doi:10.1101/2021.05.21.445058
Lin, K., Lei, J., & Roeder, K. (2021) · Journal of the American Statistical Association · doi:10.1080/01621459.2021.1892701
Precision medicine methodology development with application to survival and genomics data
Cho, H. (2021) · Carolina Digital Repository (University of North Carolina at Chapel Hill) · doi:10.17615/45y7-xv78
Feature Selection in High-dimensional Space Using Graph-Based Methods.Preprint
Ghosh, S., Mukherjee, S., & Agarwal, D. (2021) · arXiv (Cornell University)
Miyashiro, K., & Eberwine, J. H. (2021) · Elsevier eBooks · doi:10.1016/b978-0-12-823577-5.00034-9
COVID-19 Biomarkers Detection Using ‘KnowSeq’ R Package
Bajo-Morales, J., Castillo-Secilla, D., Herrera, L. J., & Rojas, I. (2021) · Lecture notes in computer science · doi:10.1007/978-3-030-88163-4_37
A Poisson reduced-rank regression model for association mapping in sequencing dataPreprint
Fitzgerald, T., Jones, A., & Engelhardt, B. E. (2022) · bioRxiv (Cold Spring Harbor Laboratory) · doi:10.1101/2022.05.31.494236
Optimal separation of high dimensional transcriptome for complex multigenic traits
Sarkar, A., Singh, A., Bailey, R., Dobra, A., & Kahveci, T. (2022) · ACM International Conference on Bioinformatics, Computational Biology, and Health Informatics (ACM-BCB) · doi:10.1145/3535508.3545506
Mahalingam, D. R., & Jayanthi, K. (2023) · Lecture notes in electrical engineering · doi:10.1007/978-981-19-7753-4_29
Early Alzheimer’s Prediction Using Dimensionality Reduction Techniques
Paplomatas, P., & Vrahatis, A. G. (2023) · Springer eBooks · doi:10.1007/978-3-319-75479-6_65-1
Xu, Y., Wang, S., Li, H., Feng, Q., Li, Y., & Wang, J. (2024) · bioRxiv (Cold Spring Harbor Laboratory) · doi:10.1101/2024.02.25.581975
Additional file 1 of Feature selection revisited in the single-cell era
Yang, P., Huang, H., & Liu, C. (2021) · Figshare · doi:10.6084/m9.figshare.17104024
fastglmpca: Fast Algorithms for Generalized Principal Component Analysis
Weine, E., Carbonetto, P. S., & Stephens, M. (2024) · doi:10.32614/cran.package.fastglmpca
Deol, K., Weber, G. M., & Yu, Y. W. (2024) · Bioinformatics Advances · doi:10.1093/bioadv/vbae095
Liu, Y. K., Carbonetto, P. S., Takahama, M., Gruenbaum, A., Xie, D., Chevrier, N., & Stephens, M. (2024) · The Annals of Applied Statistics · doi:10.1214/24-aoas1894 · Cited by 1
Interpretable single-cell factor decomposition using sciREDPreprint
Bader, G. D., Pouyabahar, D., & Andrews, T. S. (2024) · Research Square · doi:10.21203/rs.3.rs-4819117/v1
Dai, H., Meng, X., Pan, Z., Yang, Q., Song, H., Gao, Y., & Wang, X. (2024) · IEEE Journal of Biomedical and Health Informatics · doi:10.1109/jbhi.2024.3487174
A Novel Recurrent Neural Net based Dimension Reduction Technique for Effectual Data Visualization
John, M., Sharma, Y. K., Balaji, N. V., Suri, S., Nishanthi, R., & Goyal, S. (2024) · Global Conference on Communications and Information Technologies (GCCIT) · doi:10.1109/gccit63234.2024.10861954
Crafted experiments to evaluate feature selection methods for single-cell RNA-seq data
Liu, S., Corcoran, D. L., García‐Recio, S., Marron, J. S., & Perou, C. M. (2025) · NAR Genomics and Bioinformatics · doi:10.1093/nargab/lqaf023 · Cited by 1
Gao, Y., Duan, H., Meng, F., Zhang, C., Li, X., & Li, F. (2025) · IET Systems Biology · doi:10.1049/syb2.12107
Recovering undersampled single-cell transcriptomes with HyperCellPreprint
Bzdok, D., Hodgson, L. M., & Krishnaswamy, S. (2025) · Research Square · doi:10.21203/rs.3.rs-6436032/v1
Missing data in single-cell transcriptomes reveals transcriptional shiftsPreprint
Chen, R., Chung, Y.-C., Kelly, B., Moore, H., Basu, S., Lvovs, D., Gueguen, P., & Sanin, D. E. (2025) · bioRxiv (Cold Spring Harbor Laboratory) · doi:10.1101/2025.08.15.669765
Zhang, Z., Chen, J., Wu, H., Li, K. Y., Adams, P. D., Itkin‐Ansari, P., & Yip, K. Y.-L. (2025) · bioRxiv (Cold Spring Harbor Laboratory) · doi:10.1101/2025.10.01.679835
Resolution Tradeoffs in Modularity Clustering of Single Cell RNA-Seq Datasets
Leviyang, S. (2025) · IEEE Transactions on Computational Biology and Bioinformatics · doi:10.1109/tcbbio.2025.3627868
Metadata
- Authors
- Townes, F. W., Hicks, S. C., Aryee, M. J., & Irizarry, R. A.
- Affiliations
- Harvard University (US)
- Johns Hopkins University (US)
- Venue
- Genome Biology
- Published
- 2019-12
- Volume
- 20
- Issue
- 1
- Pages
- 295-295
- ISSN
- 1465-6906 (ISSN-L)
- 1474-760X
- PMC
- PMC6927135
- OpenAlex
- W2998065416
- Cited by
- 471
- References
- 68
- Citations by year
- 2026: 49 · 2025: 56 · 2024: 78 · 2023: 76 · 2022: 70 · 2021: 80 · 2020: 48 · 2019: 14
- FWCI
- 17.71
- Type
- journal article
- Language
- en
- Update notices
- correction (2020-07-22)
- Open access
- gold
- doi.org
- Licence
- Locations
- Genome biology (publishedVersion, cc-by)
- bioRxiv (Cold Spring Harbor Laboratory) (acceptedVersion, cc-by-nc-nd)
- PubMed Central (publishedVersion, cc-by)
- PubMed (publishedVersion)
- DOAJ (DOAJ: Directory of Open Access Journals) (submittedVersion)
- Funders
- National Institutes of Health
- National Human Genome Research Institute (R00HG009007, R01HG005220, P41HG004059)
- National Cancer Institute (T32CA009337)
- National Institute of General Medical Sciences (R01GM083084)
- Topics
- Life Sciences › Biochemistry, Genetics and Molecular Biology › Molecular Biology › Single-cell and spatial transcriptomics
- Life Sciences › Biochemistry, Genetics and Molecular Biology › Molecular Biology › Gene expression and cancer classification
- Life Sciences › Biochemistry, Genetics and Molecular Biology › Molecular Biology › Genomics and Phylogenetic Studies
- Keywords
- single-cell RNA sequencing, feature selection, dimensionality reduction, multinomial model, unique molecular identifiers, highly variable genes, generalized principal component analysis, cell clustering
- MeSH terms
- Models, Statistical, Sequence Analysis, RNA, Single-Cell Analysis
About these checks
Registry, retraction, Cites and statistics results are computed, not judged, with one exception: a printed reference that no index lists is read once by a model before it counts as a citation error. Claims are extracted by a model and kept only when their quote appears verbatim in the text; each cited source is then checked, with a model’s help, for whether it says what the claim relies on. Those verdicts can be wrong — read the claim’s quote and the cited source before relying on one.
Statistics and arithmetic are recomputed, not judged.
Confidence bands are shown only for fields calibrated on our annotated test set. None is calibrated yet, so no band is shown.
What counts as a claim ›How we measure confidence ›How we check this ›
Are you an author, or do you see a problem with this page? Request a review
