

The DOI matches its Crossref record; 64 of the 64 references it cites were found in a registry or an index.
An epigenome-wide association study of sex-specific chronological ageing
Open accessPublished version of a preprint
Abstract
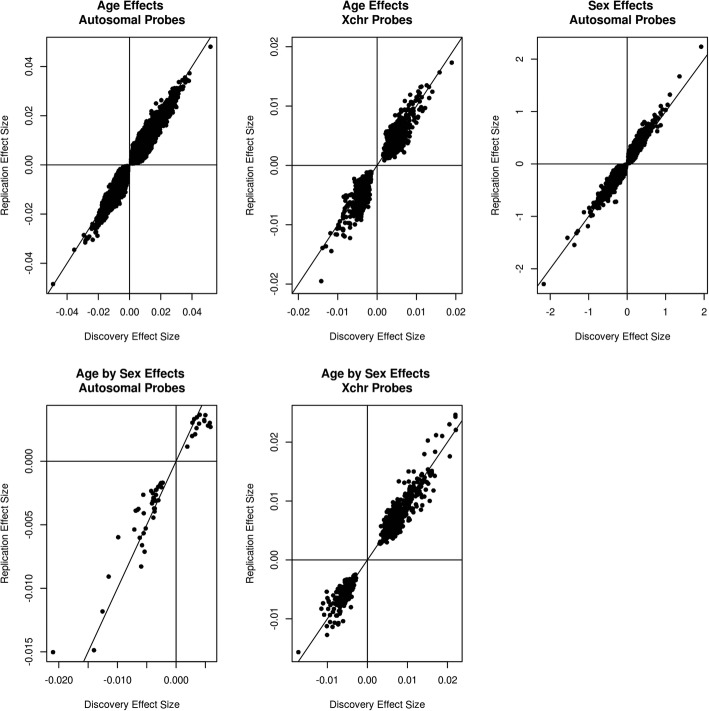
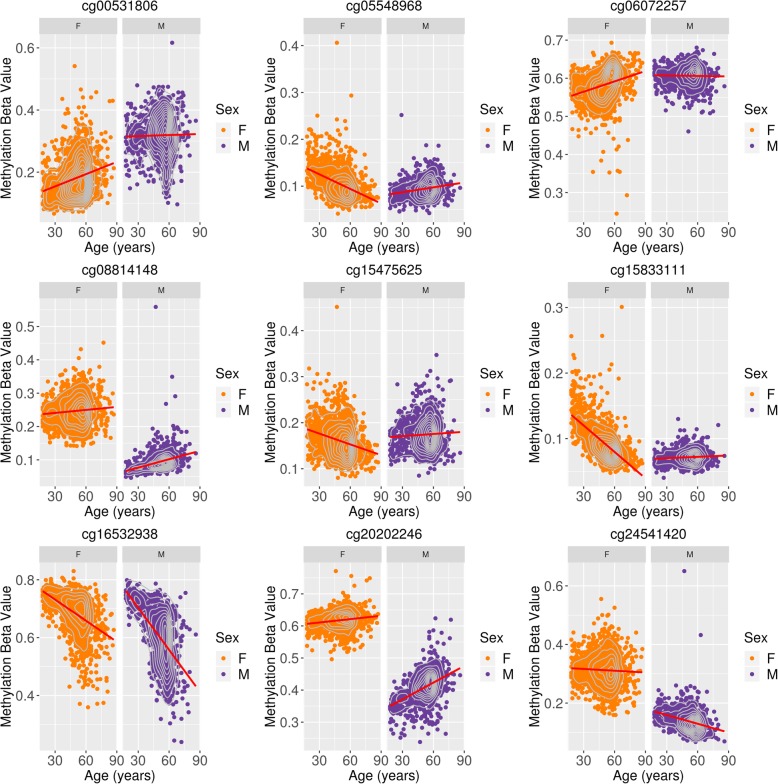
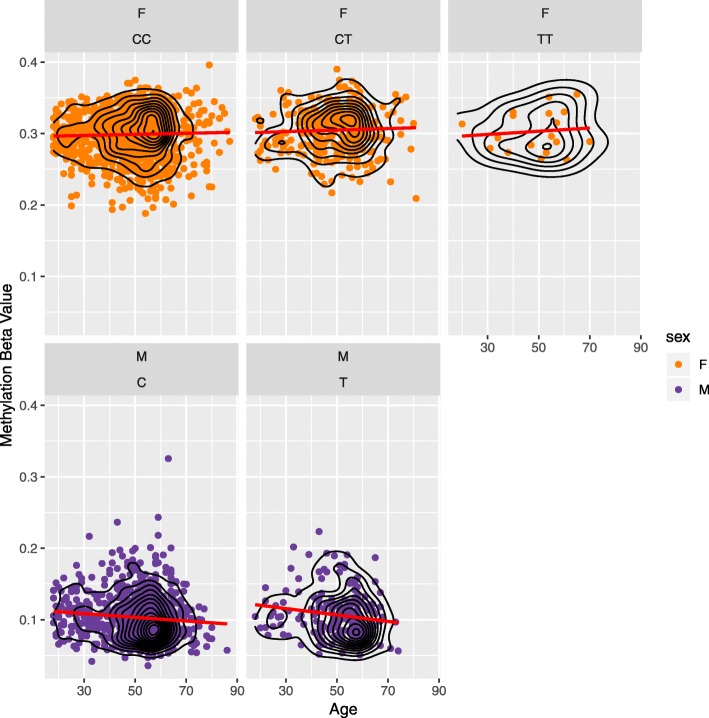
Background: Advanced age is associated with cognitive and physical decline and is a major risk factor for a multitude of disorders. There is also a gap in life expectancy between males and females. DNA methylation differences have been shown to be associated with both age and sex. Here, we investigate age-by-sex differences in blood-based DNA methylation in an unrelated cohort of 2586 individuals between the ages of 18 and 87 years, with replication in a further 4450 individuals between the ages of 18 and 93 years. Methods: Linear regression models were applied, with stringent genome-wide significance thresholds ( p < 3.6 × 10 −8 ) used in both the discovery and replication data. A second, highly conservative mixed linear model method that better controls the false-positive rate was also applied, using the same genome-wide significance thresholds. Results: Using the linear regression method, 52 autosomal and 597 X-linked CpG sites, mapping to 251 unique genes, replicated with concordant effect size directions in the age-by-sex interaction analysis. The site with the greatest difference mapped to GAGE10 , an X-linked gene. Here, DNA methylation levels remained stable across the male adult age range (DNA methylation by age r = 0.02) but decreased across female adult age range (DNA methylation by age r = − 0.61). One site (cg23722529) with a significant age-by-sex interaction also had a quantitative trait locus (rs17321482) that is a genome-wide significant variant for prostate cancer. The mixed linear model method identified 11 CpG sites associated with the age-by-sex interaction. Conclusion: The majority of differences in age-associated DNA methylation trajectories between sexes are present on the X chromosome. Several of these differences occur within genes that have been implicated in sexually dimorphic traits.
Overview
The claims and statistics of this paper haven’t been checked yet.
Run the check — free, no account needed. It reads the open-access text and checks the sources it cites.
Integrity signals
Registry
Cites
Statistics
Figures
Verification
Claims the paper makes
The claims and statistics of this paper haven’t been checked yet.
Run the check — free, no account needed. It reads the open-access text and checks the sources it cites.
Claims other papers make about this one
Each is checked against this paper’s own text: does it say what the citing paper says it does?
The cited source says what the claim attributes to it.
In the citing paper
“As advanced aging is the strongest factor for AD, we also compared our results with those from Yusipov et al. [94] and McCartney et al. [35], which identified 8 and 52 autosomal CpGs differentially affected by aging, but we did not find any overlap with these previous studies.”
From Distinct sex-specific DNA methylation differences in Alzheimer’s disease (2022) · cites this paper as [35]
Self-check
Percentages, sums and reported differences re-computed from the paper’s own numbers.
The self-check needs the paper’s full text.
Citations
Cites
Subramanian, A., Tamayo, P., Mootha, V. K., Mukherjee, S., Ebert, B. L., Gillette, M. A., Paulovich, A., Pomeroy, S. L., Golub, T. R., Lander, E. S., et al. (2005) · Proceedings of the National Academy of Sciences · doi:10.1073/pnas.0506580102 · Cited by 53,625
limma powers differential expression analyses for RNA-sequencing and microarray studies
Ritchie, M. E., Phipson, B., Wu, D., Hu, Y., Law, C. W., Shi, W., & Smyth, G. K. (2015) · Nucleic Acids Research · doi:10.1093/nar/gkv007 · Cited by 40,458
The Molecular Signatures Database Hallmark Gene Set Collection
Liberzon, A., Birger, C., Thorvaldsdóttir, H., Ghandi, M., Mesirov, J. P., & Tamayo, P. (2015) · Cell Systems · doi:10.1016/j.cels.2015.12.004 · Cited by 13,807
DNA methylation age of human tissues and cell types
Horvath, S. (2013) · Genome Biology · doi:10.1186/gb-2013-14-10-r115 · Cited by 7,075
Genome-wide methylation profiles reveal quantitative views of human aging rates
Hannum, G., Guinney, J., Zhao, L., Zhang, L., Hughes, G., Sadda, S., Klotzle, B., Bibikova, M., Fan, J.-B., Gao, Y., et al. (2013) · Molecular Cell · doi:10.1016/j.molcel.2012.10.016 · Cited by 4,270
Functional mapping and annotation of genetic associations with FUMA
Watanabe, K., Taskesen, E., van Bochoven, A., & Posthuma, D. (2017) · Nature Communications · doi:10.1038/s41467-017-01261-5 · Cited by 4,083
Buniello, A., MacArthur, J. A. L., Cerezo, M., Harris, L. W., Hayhurst, J., Malangone, C., McMahon, A., Morales, J., Mountjoy, E., Sollis, E., et al. (2019) · Nucleic Acids Research · doi:10.1093/nar/gky1120 · Cited by 4,000
An epigenetic biomarker of aging for lifespan and healthspan
Levine, M. E., Lu, A. T., Quach, A., Chen, B. H., Assimes, T. L., Bandinelli, S., Hou, L., Baccarelli, A. A., Stewart, J. D., Li, Y., et al. (2018) · Aging · doi:10.18632/aging.101414 · Cited by 3,675
DNA methylation-based biomarkers and the epigenetic clock theory of ageing
Horvath, S., & Raj, K. (2018) · Nature Reviews Genetics · doi:10.1038/s41576-018-0004-3 · Cited by 3,095
DNA methylation GrimAge strongly predicts lifespan and healthspan
Lu, A. T., Quach, A., Wilson, J. G., Reiner, A. P., Aviv, A., Raj, K., Hou, L., Baccarelli, A. A., Li, Y., Stewart, J. D., et al. (2019) · Aging · doi:10.18632/aging.101684 · Cited by 2,540
The new NHGRI-EBI Catalog of published genome-wide association studies (GWAS Catalog)
MacArthur, J., Bowler, E., Cerezo, M., Gil, L., Hall, P., Hastings, E., Junkins, H., McMahon, A., Milano, A., Morales, J., et al. (2017) · Nucleic Acids Research · doi:10.1093/nar/gkw1133 · Cited by 2,161
Telomere loss: mitotic clock or genetic time bomb?
Harley, C. B. (1991) · Mutation Research/DNAging · doi:10.1016/0921-8734(91)90018-7 · Cited by 1,139
Bentham, J., Morris, D. L., Graham, D. S. C., Pinder, C. L., Tombleson, P., Behrens, T. W., Martin, J. J., Fairfax, B. P., Knight, J. C., Chen, L., et al. (2015) · Nature Genetics · doi:10.1038/ng.3434 · Cited by 1,004
Association analyses of more than 140,000 men identify 63 new prostate cancer susceptibility loci
Study, T. P., Schumacher, F. R., (APCB), A. P. C. B., Study, T. I., Canary PASS Investigators, Breast and Prostate Cancer Cohort Consortium (BPC3), The PRACTICAL (Prostate Cancer Association Group to Investigate Cancer-Associated Alterations in the Genome) Consortium, (CAPS), C. O. T. P. I. S., Prostate Cancer Genome-wide Association Study of Uncommon Susceptibility Loci (PEGASUS), The Genetic Associations and Mechanisms in Oncology (GAME-ON)/Elucidating Loci Involved in Prostate Cancer Susceptibility (ELLIPSE) Consortium, et al. (2018) · Nature Genetics · doi:10.1038/s41588-018-0142-8 · Cited by 902
Genome partitioning of genetic variation for complex traits using common SNPs
Yang, J., Manolio, T. A., Pasquale, L. R., Boerwinkle, E., Caporaso, N., Cunningham, J. M., de Andrade, M., Feenstra, B., Feingold, E., Hayes, M. G., et al. (2011) · Nature Genetics · doi:10.1038/ng.823 · Cited by 890
Self-citationmissMethyl: an R package for analyzing data from Illumina’s HumanMethylation450 platform
Phipson, B., Maksimovic, J., & Oshlack, A. (2015) · Bioinformatics · doi:10.1093/bioinformatics/btv560 · Cited by 870
Multiple newly identified loci associated with prostate cancer susceptibility
Collaborators, T. U. G. P. C. S., Eeles, R. A., Collaborators, T. U. P. S., Kote‐Jarai, Z., Giles, G. G., Olama, A. A. A., Guy, M., Jugurnauth, S. K., Mulholland, S., Leongamornlert, D. A., et al. (2008) · Nature Genetics · doi:10.1038/ng.90 · Cited by 843
Pe'er, I., Yelensky, R., Altshuler, D., & Daly, M. J. (2008) · Genetic Epidemiology · doi:10.1002/gepi.20303 · Cited by 783
An epigenetic clock analysis of race/ethnicity, sex, and coronary heart disease
Horvath, S., Gurven, M., Levine, M. E., Trumble, B. C., Kaplan, H. S., Allayee, H., Ritz, B. R., Chen, B. H., Lu, A. T.-H., Rickabaugh, T. M., et al. (2016) · Genome biology · doi:10.1186/s13059-016-1030-0 · Cited by 749
Austad, S. N., & Fischer, K. E. (2016) · Cell Metabolism · doi:10.1016/j.cmet.2016.05.019 · Cited by 619
Systematic identification of genetic influences on methylation across the human life course
Gaunt, T. R., Shihab, H. A., Hemani, G., Min, J. L., Woodward, G., Lyttleton, O., Zheng, J., Duggirala, A., McArdle, W. L., Ho, K., et al. (2016) · Genome Biology · doi:10.1186/s13059-016-0926-z · Cited by 598
Sex and gender differences in health: Science & Society Series on Sex and Science
Regitz‐Zagrosek, V. (2012) · The EMBO Reports · doi:10.1038/embor.2012.87 · Cited by 572
Jung, M., & Pfeifer, G. P. (2015) · BMC Biology · doi:10.1186/s12915-015-0118-4 · Cited by 563
Zhang, Q., Vallerga, C. L., Walker, R. M., Lin, T., Henders, A. K., Montgomery, G. W., He, J., Fan, D., Fowdar, J., Kennedy, M., et al. (2019) · Genome Medicine · doi:10.1186/s13073-019-0667-1 · Cited by 487
Self-citationMethylation of ELOVL 2 gene as a new epigenetic marker of age
Garagnani, P., Bacalini, M. G., Pirazzini, C., Gori, D., Giuliani, C., Mari, D., Di Blasio, A. M., Gentilini, D., Vitale, G., Collino, S., et al. (2012) · Aging Cell · doi:10.1111/acel.12005 · Cited by 473
A meta-analysis of 87,040 individuals identifies 23 new susceptibility loci for prostate cancer
Olama, A. A. A., Kote‐Jarai, Z., Berndt, S. I., Conti, D. V., Schumacher, F. R., Han, Y., Benlloch, S., Hazelett, D. J., Wang, Z., Saunders, E. J., et al. (2014) · Nature Genetics · doi:10.1038/ng.3094 · Cited by 461
Genome-wide association study identifies 112 new loci for body mass index in the Japanese population
Akiyama, M., Okada, Y., Kanai, M., Takahashi, A., Momozawa, Y., Ikeda, M., Iwata, N., Ikegawa, S., Hirata, M., Matsuda, K., et al. (2017) · Nature Genetics · doi:10.1038/ng.3951 · Cited by 455
Smith, B. H., Campbell, A., Linksted, P., Fitzpatrick, B., Jackson, C., Kerr, S. M., Deary, I. J., MacIntyre, D. J., Campbell, H., McGilchrist, M., et al. (2013) · International Journal of Epidemiology · doi:10.1093/ije/dys084 · Cited by 401
Self-citationVijg, J., & Suh, Y. (2013) · Annual Review of Physiology · doi:10.1146/annurev-physiol-030212-183715 · Cited by 399
The Relationship of DNA Methylation with Age, Gender and Genotype in Twins and Healthy Controls
Boks, M. P., Derks, E. M., Weisenberger, D. J., Strengman, E., Janson, E., Sommer, I. E., Kahn, R. S., & Ophoff, R. A. (2009) · PLoS ONE · doi:10.1371/journal.pone.0006767 · Cited by 378
Common sequence variants on 2p15 and Xp11.22 confer susceptibility to prostate cancer
Guðmundsson, J., Sulem, P., Rafnar, Þ., Bergþorsson, J. Þ., Manolescu, A. R., Gudbjartsson, D. F., Agnarsson, B. A., Sigurðsson, Á., Benediktsdóttir, K. R., Blöndal, T., et al. (2008) · Nature Genetics · doi:10.1038/ng.89 · Cited by 371
Weckerle, C. E., & Niewold, T. (2011) · Clinical reviews in allergy and immunology · doi:10.1007/s12016-009-8192-4 · Cited by 286
The Genotype-Tissue Expression (GTEx) project
Lonsdale, J., Thomas, J., Salvatore, M., Phillips, R., Lo, E., Shad, S., Hasz, R., Walters, G., Garcia, F., Young, N., et al. (2013) · Nature Genetics · doi:10.1038/ng.2653 · Cited by 263
Jung, S.-E., Lim, S. M., Hong, S. R., Lee, E. H., Shin, K.-J., & Lee, H. Y. (2019) · Forensic Science International: Genetics · doi:10.1016/j.fsigen.2018.09.010 · Cited by 202
Estimation of a significance threshold for epigenome-wide association studies
Saffari, A., Silver, M. J., Zavattari, P., Moi, L., Columbano, A., Meaburn, E. L., & Dudbridge, F. (2018) · Genetic Epidemiology · doi:10.1002/gepi.22086 · Cited by 183
Characterization of the GAGE genes that are expressed in various human cancers and in normal testis.
Backer, O. D., Arden, K. C., Boretti, M., Vantomme, V., Smet, C. D., Czekay, S., Viars, C. S., Plaen, E. D., Brasseur, F., Chomez, P., et al. (1999) · PubMed · Cited by 167
Alarcón-Riquelme, M. E., Ziegler, J. T., Molineros, J. E., Howard, T. D., Moreno‐Estrada, A., Sánchez, E., Ainsworth, H. C., Ortiz-Tello, P. A., Comeau, M. E., Rasmussen, A., et al. (2015) · Arthritis & Rheumatology · doi:10.1002/art.39504 · Cited by 167
OSCA: a tool for omic-data-based complex trait analysis
Zhang, F., Chen, W., Zhu, Z., Zhang, Q., Nabais, M. F., Qi, T., Deary, I. J., Wray, N. R., Visscher, P. M., McRae, A. F., et al. (2019) · Genome biology · doi:10.1186/s13059-019-1718-z · Cited by 147
Self-citationRatnu, V. S., Emami, M. R., & Bredy, T. W. (2017) · Journal of Neuroscience Research · doi:10.1002/jnr.23886 · Cited by 144
Genetic prediction of male pattern baldness
Hagenaars, S. P., Hill, W. D., Harris, S. E., Ritchie, S. J., Davies, G., Liewald, D. C. M., Galé, C. R., Porteous, D. J., Deary, I. J., & Marioni, R. E. (2017) · PLoS Genetics · doi:10.1371/journal.pgen.1006594 · Cited by 140
Self-citationPITPNC1 Recruits RAB1B to the Golgi Network to Drive Malignant Secretion
Halberg, N., Sengelaub, C. A., Navrazhina, K., Molina, H., Uryu, K., & Tavazoie, S. F. (2016) · Cancer Cell · doi:10.1016/j.ccell.2016.02.013 · Cited by 137
Zhang, Y., Castillo-Morales, A., Jiang, M., Zhu, Y., Hu, L., Urrutia, A. O., Kong, X., & Hurst, L. D. (2013) · Molecular Biology and Evolution · doi:10.1093/molbev/mst148 · Cited by 136
McCartney, D. L., Stevenson, A. J., Walker, R. M., Gibson, J., Morris, S. W., Campbell, A., Murray, A. D., Whalley, H. C., Porteous, D. J., McIntosh, A. M., et al. (2018) · Alzheimer s & Dementia Diagnosis Assessment & Disease Monitoring · doi:10.1016/j.dadm.2018.05.006 · Cited by 136
Self-citationAshpole, N. M., Logan, S., Yabluchanskiy, A., Mitschelen, M. C., Han, Y., Farley, J. A., Hodges, E. L., Ungvari, Z. I., Csiszár, A., Chen, S., et al. (2017) · GeroScience · doi:10.1007/s11357-017-9971-0 · Cited by 133
Dissection of genetic variation and evidence for pleiotropy in male pattern baldness
Yap, C. X., Sidorenko, J., Wu, Y., Kemper, K. E., Yang, J., Wray, N. R., Robinson, M. R., & Visscher, P. M. (2018) · Nature Communications · doi:10.1038/s41467-018-07862-y · Cited by 124
Self-citationLessard, C. J., Sajuthi, S. P., Zhao, J., Kim, K.-W., Ice, J. A., Li, H., Ainsworth, H. C., Rasmussen, A., Kelly, J. A., Marion, M. C., et al. (2015) · Arthritis & Rheumatology · doi:10.1002/art.39548 · Cited by 103
Mischo, A., Kubuschok, B., Ertan, K., Preuss, K., Romeike, B. F. M., Regitz, E., Schormann, C., de Bruijn, D. R. H., Wadle, A., Neumann, F., et al. (2005) · International Journal of Cancer · doi:10.1002/ijc.21352 · Cited by 102
Bacalini, M. G., Deelen, J., Pirazzini, C., De Cecco, M., Giuliani, C., Lanzarini, C., Ravaioli, F., Marasco, E., van Heemst, D., Suchiman, H. E. D., et al. (2017) · The Journals of Gerontology: Series A · doi:10.1093/gerona/glw185 · Cited by 100
Sex differences in the hypothalamus in the different stages of human life
Swaab, D. F., Chung, W. C. J., Kruijver, F. P. M., Hofman, M. A., & Hestiantoro, A. (2003) · Neurobiology of Aging · doi:10.1016/s0197-4580(03)00059-9 · Cited by 99
Sigalotti, L., Coral, S., Altomonte, M., Natali, L., Gaudino, G., Cacciotti, P., Libener, R., Colizzi, F., Vianale, G., Martini, F., et al. (2002) · British Journal of Cancer · doi:10.1038/sj.bjc.6600174 · Cited by 88
Sex differences of leukocytes DNA methylation adjusted for estimated cellular proportions
Inoshita, M., Numata, S., Tajima, A., Kinoshita, M., Umehara, H., Yamamori, H., Hashimoto, R., Imoto, I., & Ohmori, T. (2015) · Biology of Sex Differences · doi:10.1186/s13293-015-0029-7 · Cited by 71
Epigenetic mechanisms in sexual differentiation of the brain and behaviour
Forger, N. G. (2016) · Philosophical Transactions of the Royal Society B Biological Sciences · doi:10.1098/rstb.2015.0114 · Cited by 70
An overview of the GAGE cancer/testis antigen family with the inclusion of newly identified members
Gjerstorff, M. F., & Ditzel, H. J. (2008) · Tissue Antigens · doi:10.1111/j.1399-0039.2007.00997.x · Cited by 66
Maio, M., Coral, S., Sigalotti, L., Elisei, R., Romei, C., Rossi, G., Cortini, E., Colizzi, F., Fenzi, G., Altomonte, M., et al. (2003) · The Journal of Clinical Endocrinology & Metabolism · doi:10.1210/jc.2002-020830 · Cited by 65
Overexpression and mutations of p53 in metastatic malignant melanomas
Hartmann, A., Blaszyk, H., Cunningham, J. S., McGovern, R. M., Jj, S., Helander, S. D., Pittelkow, M. R., Sommer, S. S., & Kovach, J. S. (1996) · International Journal of Cancer · doi:10.1002/(sici)1097-0215(19960729)67:3 · Cited by 63
Common Variants on Xq28 Conferring Risk of Schizophrenia in Han Chinese
Wong, E., So, H., Li, M., Wang, Q., Butler, A. W., Paul, B., Wu, H.-M., Hui, T. C. K., Choi, S.-C., So, M., et al. (2013) · Schizophrenia Bulletin · doi:10.1093/schbul/sbt104 · Cited by 61
Alberts, S. C., Archie, E. A., Gesquiere, L. R., Jeanne Altmann, A., Vaupel, J. W., & Christensen, K. (2014) · University of Southern Denmark Research Portal (University of Southern Denmark) · Cited by 58
Accounting for sex in the genome
(2017) · Nature Medicine · doi:10.1038/nm.4445 · Cited by 48
Haring, R., John, U., Völzke, H., Nauck, M. A., Dörr, M., Felix, S. B., & Wallaschofski, H. (2012) · Gender Medicine · doi:10.1016/j.genm.2012.10.007 · Cited by 34
Wang, L., Wu, J., Yuan, J. X., Zhu, X., Wu, H., & Li, M. (2016) · Frontiers of Medicine · doi:10.1007/s11684-016-0429-z · Cited by 27
Ruschenburg, I., Kubitz, A., Schlott, T., Korabiowska, M., & Droese, M. (1999) · International Journal of Molecular Medicine · doi:10.3892/ijmm.4.4.445 · Cited by 22
Improved prediction of chronological age from DNA methylation limits it as a biomarker of ageingPreprint
Zhang, Q., Vallerga, C. L., Walker, R. M., Lin, T., Henders, A. K., Montgomery, G. W., He, J., Fan, D., Fowdar, J., Kennedy, M. A., et al. (2018) · bioRxiv (Cold Spring Harbor Laboratory) · doi:10.1101/327890 · Cited by 16
Self-citationMadden, R. A., McCartney, D. L., Walker, R. M., Hillary, R. F., Bermingham, M. L., Rawlik, K., Morris, S. W., Campbell, A. I., Porteous, D. J., Deary, I. J., et al. (2019) · bioRxiv (Cold Spring Harbor Laboratory) · doi:10.1101/664045 · Cited by 10
Self-citationTakao, H., Shibata, E., & Ohtomo, K. (2016) · CardioVascular and Interventional Radiology · doi:10.1007/s00270-016-1377-3 · Cited by 9
Research works printed but not linked: 1
- R Core Team. R development Core team. R a Lang. Environ. Stat Comput 2017; 55: 275–286.
Cited by
Sorted by citations
Sex differences in biological aging with a focus on human studies
Hägg, S., & Jylhävä, J. (2021) · eLife · doi:10.7554/elife.63425 · Cited by 442
Genome-wide association studies identify 137 genetic loci for DNA methylation biomarkers of aging
McCartney, D. L., Min, J. L., Richmond, R. C., Lu, A. T.-H., Sobczyk, M., Davies, G., Broer, L., Guo, X., Jeong, A., Jung, J., et al. (2021) · Genome biology · doi:10.1186/s13059-021-02398-9 · Cited by 310
Self-citationCausality-enriched epigenetic age uncouples damage and adaptation
Ying, K., Liu, H., Tarkhov, A. E., Sadler, M. C., Lu, A. T.-H., Moqri, M., Horvath, S., Kutalik, Z., Shen, X., & Gladyshev, V. N. (2024) · Nature Aging · doi:10.1038/s43587-023-00557-0 · Cited by 235
Olbrecht, S., Busschaert, P., Qian, J., Vanderstichele, A., Loverix, L., Gorp, T. V., Nieuwenhuysen, E. V., Han, S., den Broeck, A. V., Coosemans, A., et al. (2021) · Genome Medicine · doi:10.1186/s13073-021-00922-x · Cited by 195
Simpson, D. J., & Chandra, T. (2021) · Aging Cell · doi:10.1111/acel.13452 · Cited by 195
Self-citation
Metadata
- Authors
- McCartney, D. L., Zhang, F., Hillary, R. F., Zhang, Q., Stevenson, A. J., Walker, R. M., Bermingham, M. L., Boutin, T., Morris, S. W., Campbell, A., Murray, A. D., Whalley, H. C., Porteous, D. J., Hayward, C., Evans, K. L., Chandra, T., Deary, I. J., McIntosh, A. M., Yang, J., Visscher, P. M., McRae, A. F., & Marioni, R. E.
- Affiliations
- Institute of Genetics and Cancer (GB)
- The University of Queensland (AU)
- University of Aberdeen (GB)
- Royal Edinburgh Hospital (GB)
- University of Edinburgh (GB)
- Corresponding author
- Marioni, Riccardo E.
- ORCID
- McCartney, Daniel L.
- Zhang, Futao
- Hillary, Robert F.
- Zhang, Qian
- Stevenson, Anna J.
- Walker, Rosie M.
- Bermingham, Mairead L.
- Boutin, Thibaud
- Campbell, Archie
- Murray, Alison D.
- Whalley, Heather C.
- Porteous, David J.
- Hayward, Caroline
- Evans, Kathryn L.
- Chandra, Tamir
- Deary, Ian J.
- McIntosh, Andrew M.
- Yang, Jian
- Visscher, Peter M.
- McRae, Allan F.
- Marioni, Riccardo E.
- Venue
- Genome Medicine
- Published
- 2019-12-31
- Volume
- 12
- Issue
- 1
- Pages
- 1-1
- ISSN
- 1756-994X (ISSN-L)
- PMC
- PMC6938636
- OpenAlex
- W2992920781
- Cited by
- 152
- References
- 63
- Citations by year
- 2026: 7 · 2025: 32 · 2024: 26 · 2023: 17 · 2022: 26 · 2021: 40 · 2020: 4
- FWCI
- 6.12
- Type
- journal article
- Language
- en
- Open access
- gold
- doi.org
- Locations
- Genome Medicine (publishedVersion, cc-by)
- bioRxiv (Cold Spring Harbor Laboratory) (acceptedVersion, cc-by)
- Europe PMC (PubMed Central) (publishedVersion, cc-by)
- PubMed Central (publishedVersion, cc-by)
- PubMed (publishedVersion)
- Aberdeen University Research Archive (Aberdeen University) (submittedVersion)
- Edinburgh Research Explorer (University of Edinburgh) (submittedVersion, cc-by)
- DOAJ (DOAJ: Directory of Open Access Journals) (submittedVersion)
- Funders
- Wellcome Trust (104036/Z/14/Z, 108890/Z/15/Z)
- Alzheimer’s Research UK (ARUK-PG2017B-10)
- National Health and Medical Research Council (1078037, 1083656)
- Topics
- Life Sciences › Biochemistry, Genetics and Molecular Biology › Molecular Biology › Epigenetics and DNA Methylation
- Life Sciences › Biochemistry, Genetics and Molecular Biology › Genetics › Genetic Associations and Epidemiology
- Life Sciences › Biochemistry, Genetics and Molecular Biology › Molecular Biology › Genomics and Chromatin Dynamics
- Keywords
- DNA methylation, chronological aging, sex differences, X chromosome, epigenome-wide association study, sexually dimorphic traits, blood DNA methylation, linear mixed models
- MeSH terms
- Adult, Aged, Aging, Female, Gene Expression Regulation, Humans, Male, Middle Aged, Sex Characteristics, Linear Models, CpG Islands, DNA Methylation, Quantitative Trait Loci, Chromosomes, Human, X, Genome-Wide Association Study
About these checks
Registry, retraction, Cites and statistics results are computed, not judged, with one exception: a printed reference that no index lists is read once by a model before it counts as a citation error. Claims are extracted by a model and kept only when their quote appears verbatim in the text; each cited source is then checked, with a model’s help, for whether it says what the claim relies on. Those verdicts can be wrong — read the claim’s quote and the cited source before relying on one.
Statistics and arithmetic are recomputed, not judged.
Confidence bands are shown only for fields calibrated on our annotated test set. None is calibrated yet, so no band is shown.
What counts as a claim ›How we measure confidence ›How we check this ›
Are you an author, or do you see a problem with this page? Request a review
