

The DOI matches its Crossref record; 31 of the 31 references it cites were found in a registry or an index.
Spatially resolved transcriptomics reveals genes associated with the vulnerability of middle temporal gyrus in Alzheimer’s disease
Published version of a preprint
Abstract
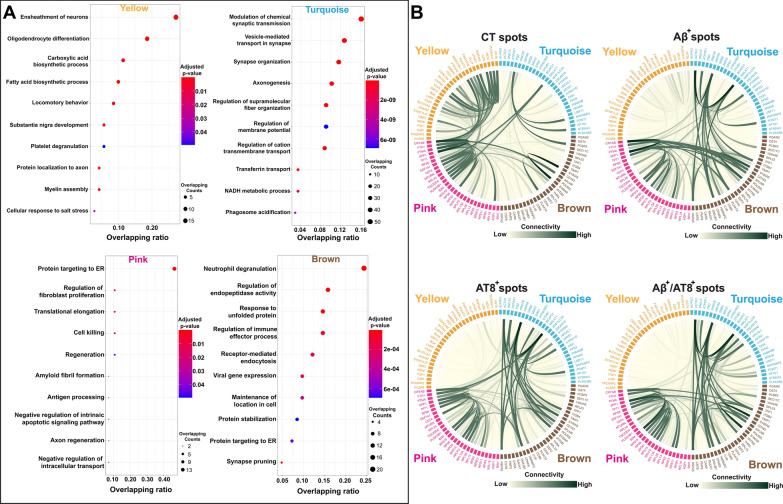
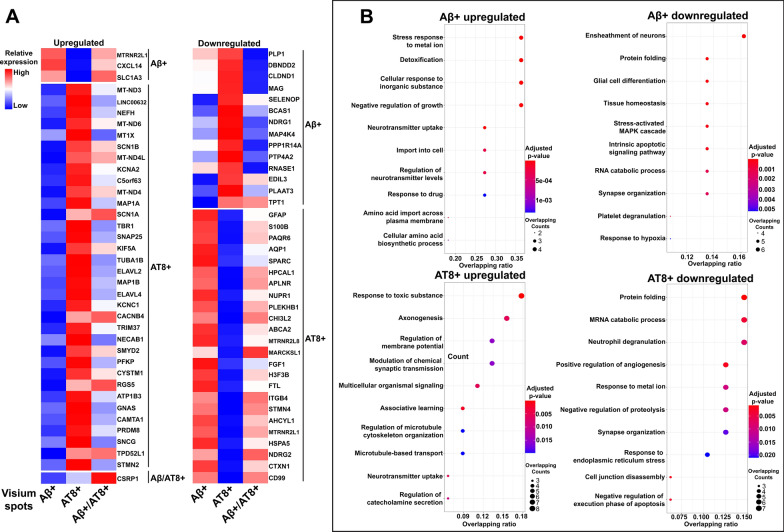
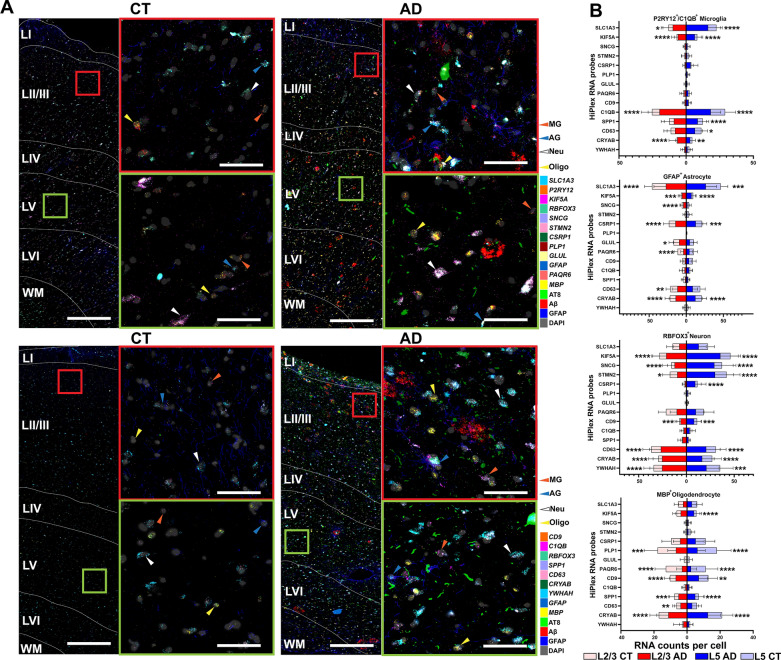
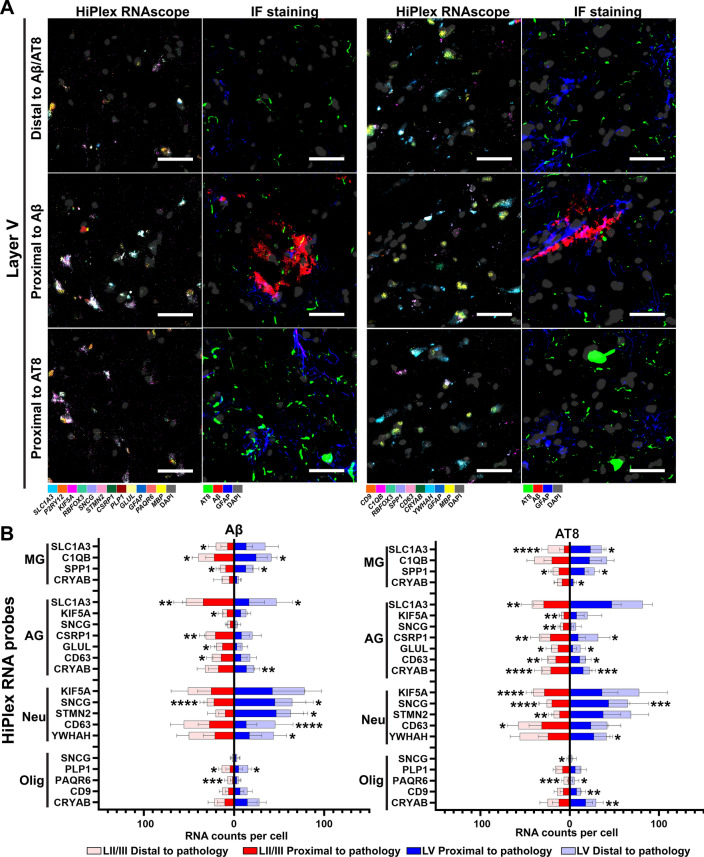
Human middle temporal gyrus (MTG) is a vulnerable brain region in early Alzheimer’s disease (AD), but little is known about the molecular mechanisms underlying this regional vulnerability. Here we utilize the 10 × Visium platform to define the spatial transcriptomic profile in both AD and control (CT) MTG. We identify unique marker genes for cortical layers and the white matter, and layer-specific differentially expressed genes (DEGs) in human AD compared to CT. Deconvolution of the Visium spots showcases the significant difference in particular cell types among cortical layers and the white matter. Gene co-expression analyses reveal eight gene modules, four of which have significantly altered co-expression patterns in the presence of AD pathology. The co-expression patterns of hub genes and enriched pathways in the presence of AD pathology indicate an important role of cell–cell-communications among microglia, oligodendrocytes, astrocytes, and neurons, which may contribute to the cellular and regional vulnerability in early AD. Using single-molecule fluorescent in situ hybridization, we validated the cell-type-specific expression of three novel DEGs (e.g., KIF5A , PAQR6 , and SLC1A3 ) and eleven previously reported DEGs associated with AD pathology (i.e., amyloid beta plaques and intraneuronal neurofibrillary tangles or neuropil threads) at the single cell level. Our results may contribute to the understanding of the complex architecture and neuronal and glial response to AD pathology of this vulnerable brain region.
Overview
The claims and statistics of this paper haven’t been checked yet.
Run the check — free, no account needed. It reads the open-access text and checks the sources it cites.
Integrity signals
Registry
Cites
Statistics
Figures
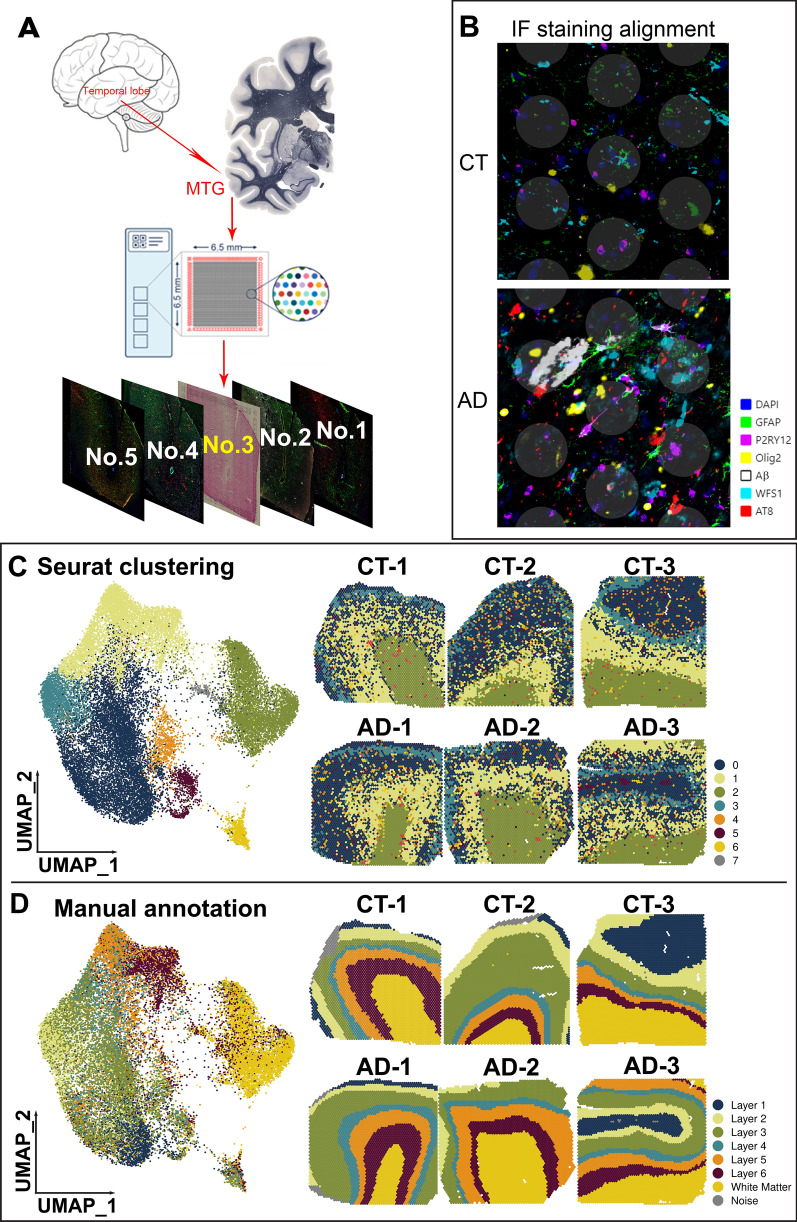
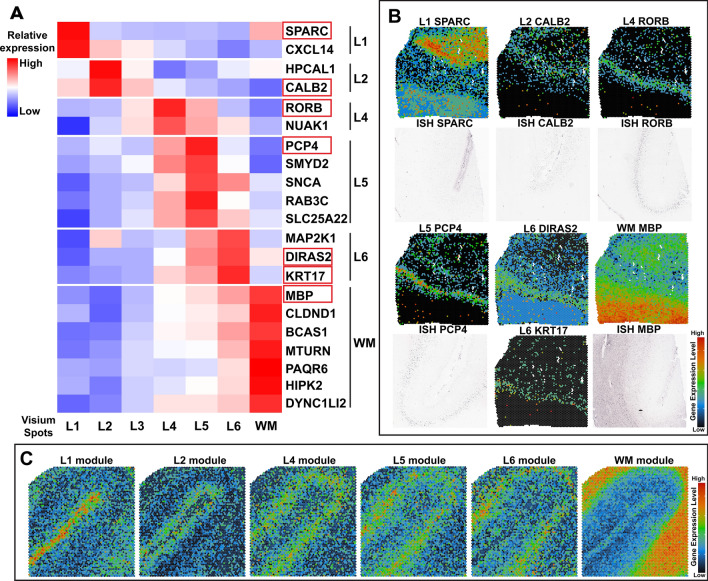
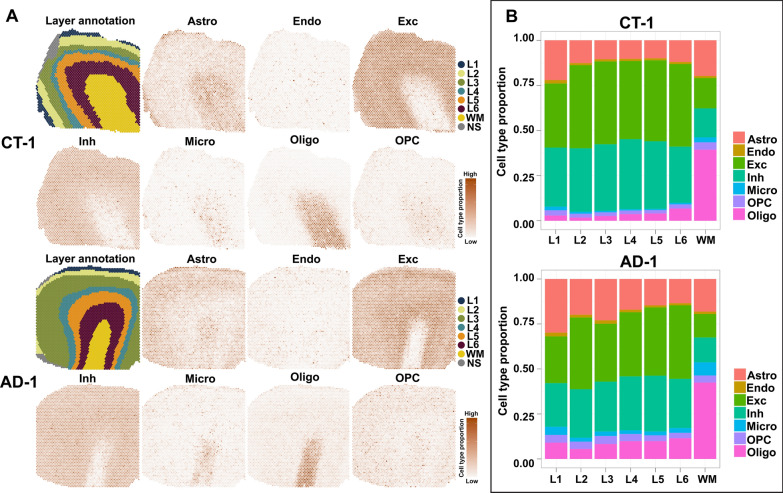
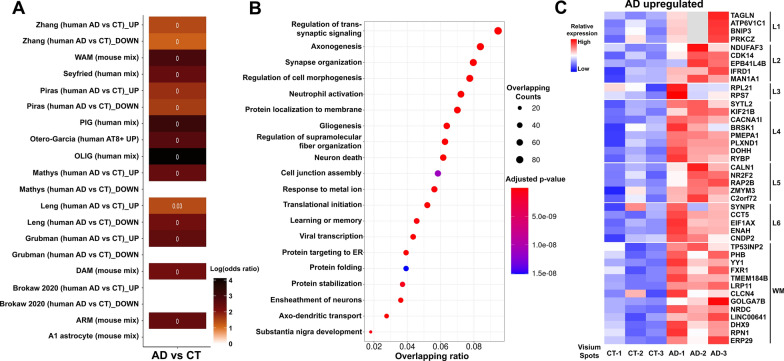
Verification
Claims the paper makes
The claims and statistics of this paper haven’t been checked yet.
Run the check — free, no account needed. It reads the open-access text and checks the sources it cites.
Claims other papers make about this one
Each is checked against this paper’s own text: does it say what the citing paper says it does?
The source backs part of the claim, not all of it — or backs it for a different population, condition or comparison.
In the citing paper
“Excitatory neuronal populations are a vulnerable cell type in human FTLD and AD cases31,55.”
From GRAMD1B is a regulator of lipid homeostasis, autophagic flux and phosphorylated tau (2025) · cites this paper as [55]
Experimental — accuracy not yet measuredIn the citing paper
“Neurons are preferentially vulnerable to tau pathology in a group of diseases known as tauopathies, including FTLD and AD, a secondary tauopathy31,55.”
From GRAMD1B is a regulator of lipid homeostasis, autophagic flux and phosphorylated tau (2025) · cites this paper as [55]
Self-check
Percentages, sums and reported differences re-computed from the paper’s own numbers.
The self-check needs the paper’s full text.
Citations
Cites
WGCNA: an R package for weighted correlation network analysis
Langfelder, P., & Horvath, S. (2008) · BMC Bioinformatics · doi:10.1186/1471-2105-9-559 · Cited by 27,252
Neuropathological stageing of Alzheimer-related changes.
Braak, H., & Braak, E. (1991) · Acta Neuropathologica · doi:10.1007/bf00308809 · Cited by 16,123
Neurotoxic reactive astrocytes are induced by activated microglia
Liddelow, S. A., Guttenplan, K. A., Clarke, L. E., Bennett, F. C., Bohlen, C. J., Schirmer, L., Bennett, M. L., Münch, A. E., Chung, W.-S., Peterson, T. C., et al. (2017) · Nature · doi:10.1038/nature21029 · Cited by 7,971
A General Framework for Weighted Gene Co-Expression Network Analysis
Zhang, B., & Horvath, S. (2005) · Statistical Applications in Genetics and Molecular Biology · doi:10.2202/1544-6115.1128 · Cited by 5,684
A Unique Microglia Type Associated with Restricting Development of Alzheimer’s Disease
Keren-Shaul, H., Spinrad, A., Weiner, A., Matcovitch-Natan, O., Dvir-Szternfeld, R., Ulland, T. K., David, E., Baruch, K., Lara-Astaiso, D., Toth, B., et al. (2017) · Cell · doi:10.1016/j.cell.2017.05.018 · Cited by 5,493
Hafemeister, C., & Satija, R. (2019) · Genome Biology · doi:10.1186/s13059-019-1874-1 · Cited by 4,479 · cited 1×
“Then, we used the recommended sctransform method [31] to normalize counts by the function “SCTransform” in its default settings.”
MethodAlzheimer's Disease Is a Synaptic Failure
Selkoe, D. J. (2002) · Science · doi:10.1126/science.1074069 · Cited by 4,420
Complement and microglia mediate early synapse loss in Alzheimer mouse models
Hong, S., Beja-Glasser, V. F., Nfonoyim, B. M., Frouin, A., Li, S., Ramakrishnan, S., Merry, K. M., Shi, Q., Rosenthal, A., Barres, B. A., et al. (2016) · Science · doi:10.1126/science.aad8373 · Cited by 3,343
The neuropathological diagnosis of Alzheimer's disease
DeTure, M. A., & Dickson, D. W. (2019) · Molecular Neurodegeneration · doi:10.1186/s13024-019-0333-5 · Cited by 3,329
Identification of a unique TGF-β–dependent molecular and functional signature in microglia
Butovsky, O., Jedrychowski, M. P., Moore, C. S., Cialic, R., Lanser, A. J., Gabriely, G., Koeglsperger, T., Dake, B., Wu, P. M., Doykan, C. E., et al. (2014) · Nature Neuroscience · doi:10.1038/nn.3599 · Cited by 2,543
Hammond, T. R., Dufort, C., Dissing-Olesen, L., Giera, S., Young, A., Wysoker, A., Walker, A. J., Segel, M., Nemesh, J., Saunders, A., et al. (2018) · doi:10.1101/406140 · Cited by 2,225
The Cellular Phase of Alzheimer’s Disease
De Strooper, B., & Karran, E. (2016) · Cell · doi:10.1016/j.cell.2015.12.056 · Cited by 1,990
Profound Loss of Layer II Entorhinal Cortex Neurons Occurs in Very Mild Alzheimer’s Disease
Gómez-Isla, T., Price, J. L., McKeel Jr., D. W., Morris, J. C., Growdon, J. H., & Hyman, B. T. (1996) · The Journal of Neuroscience · doi:10.1523/jneurosci.16-14-04491.1996 · Cited by 1,796 · cited 2×
“of the human MTG The laminar architecture of the human cortex is closely related to its function and vulnerability to different pathology [43, 44].”
BackgroundResultConserved cell types with divergent features in human versus mouse cortex
Hodge, R. D., Bakken, T. E., Miller, J. A., Smith, K. A., Barkan, E. R., Graybuck, L. T., Close, J. L., Long, B., Johansen, N., Penn, O., et al. (2019) · Nature · doi:10.1038/s41586-019-1506-7 · Cited by 1,775 · cited 9×
“Some cortical layer- and WM-specific marker genes were consistent with previous reports [29, 37, 48], including RORB (layer IV), PCP4 (layer V), and MBP (WM).”
BackgroundMethodResultInfluentialSelf-propagation of pathogenic protein aggregates in neurodegenerative diseases
Jucker, M., & Walker, L. C. (2013) · Nature · doi:10.1038/nature12481 · Cited by 1,663
Integrated Systems Approach Identifies Genetic Nodes and Networks in Late-Onset Alzheimer’s Disease
Zhang, B., Gaiteri, C., Bodea, L.-G., Wang, Z., McElwee, J., Podtelezhnikov, A. A., Zhang, C., Xie, T., Tran, L., Dobrin, R., et al. (2013) · Cell · doi:10.1016/j.cell.2013.03.030 · Cited by 1,657
Arnold, S. E., Hyman, B. T., Flory, J., Damasio, A. R., & Van Hoesen, G. W. (1991) · Cerebral Cortex · doi:10.1093/cercor/1.1.103 · Cited by 1,380
Grubman, A., Chew, G., Ouyang, J. F., Sun, G., Choo, X. Y., McLean, C., Simmons, R. K., Buckberry, S., Vargas-Landin, D. B., Poppe, D., et al. (2019) · Nature Neuroscience · doi:10.1038/s41593-019-0539-4 · Cited by 956
Spatial Transcriptomics and In Situ Sequencing to Study Alzheimer’s Disease
Chen, W.-T., Lu, A., Craessaerts, K., Pavie, B., Sala Frigerio, C., Corthout, N., Qian, X., Laláková, J., Kühnemund, M., Voytyuk, I., et al. (2020) · Cell · doi:10.1016/j.cell.2020.06.038 · Cited by 949 · cited 23×
“Our results not only validated some of the previously identified Aβ plaques [16, 17] and tangle-associated gene signatures and pathways [55], but also identified new gene signatures and pathways specific for each AD pathology (Fig.”
BackgroundMethodResultInfluentialSala Frigerio, C., Wolfs, L., Fattorelli, N., Thrupp, N., Voytyuk, I., Schmidt, I., Mancuso, R., Chen, W.-T., Woodbury, M. E., Srivastava, G., et al. (2019) · Cell Reports · doi:10.1016/j.celrep.2019.03.099 · Cited by 926
White matter changes in Alzheimer’s disease: A focus on myelin and oligodendrocytes
Nasrabady, S. E., Rizvi, B., Goldman, J. E., & Brickman, A. M. (2018) · Acta Neuropathologica Communications · doi:10.1186/s40478-018-0515-3 · Cited by 723
Selective vulnerability in neurodegenerative diseases
Fu, H., Hardy, J., & Duff, K. E. (2018) · Nature Neuroscience · doi:10.1038/s41593-018-0221-2 · Cited by 585
Self-citationCaspase activation precedes and leads to tangles
de Calignon, A., Fox, L. M., Pitstick, R., Carlson, G. A., Bacskai, B. J., Spires-Jones, T. L., & Hyman, B. T. (2010) · Nature · doi:10.1038/nature08890 · Cited by 517
Current understanding of metal ions in the pathogenesis of Alzheimer’s disease
Wang, L., Yin, Y.-L., Liu, X.-Z., Shen, P., Zheng, Y.-G., Lan, X.-R., Lu, C.-B., & Wang, J.-Z. (2020) · Translational Neurodegeneration · doi:10.1186/s40035-020-00189-z · Cited by 454
Zeng, H., Shen, E. H., Hohmann, J. G., Oh, S. W., Bernard, A., Royall, J. J., Glattfelder, K. J., Sunkin, S. M., Morris, J. A., Guillozet-Bongaarts, A. L., et al. (2012) · Cell · doi:10.1016/j.cell.2012.02.052 · Cited by 426
Single-Nucleus RNA-Seq Is Not Suitable for Detection of Microglial Activation Genes in Humans
Thrupp, N., Sala Frigerio, C., Wolfs, L., Skene, N. G., Fattorelli, N., Poovathingal, S., Fourne, Y., Matthews, P. M., Theys, T., Mancuso, R., et al. (2020) · Cell Reports · doi:10.1016/j.celrep.2020.108189 · Cited by 329
Braak, H., & Braak, E. (1985) · Acta Neuropathologica · doi:10.1007/bf00690836 · Cited by 287
Molecular signatures underlying neurofibrillary tangle susceptibility in Alzheimer’s disease
Otero-Garcia, M., Mahajani, S. U., Wakhloo, D., Tang, W., Xue, Y.-Q., Morabito, S., Pan, J., Oberhauser, J., Madira, A. E., Shakouri, T., et al. (2022) · Neuron · doi:10.1016/j.neuron.2022.06.021 · Cited by 262
Selective Neuronal Vulnerability in Alzheimer’s Disease: A Network-Based Analysis
Roussarie, J.-P., Yao, V., Rodriguez-Rodriguez, P., Oughtred, R., Rust, J., Plautz, Z., Kasturia, S., Albornoz, C., Wang, W., Schmidt, E. F., et al. (2020) · Neuron · doi:10.1016/j.neuron.2020.06.010 · Cited by 180
Castillo, E., Leon, J., Mazzei, G., Abolhassani, N., Haruyama, N., Saito, T., Saido, T., Hokama, M., Iwaki, T., Ohara, T., et al. (2017) · Scientific Reports · doi:10.1038/s41598-017-17999-3 · Cited by 158
De Rossi, P., Buggia-Prévot, V., Clayton, B. L. L., Vasquez, J. B., van Sanford, C., Andrew, R. J., Lesnick, R., Botté, A., Deyts, C., Salem, S., et al. (2016) · Molecular Neurodegeneration · doi:10.1186/s13024-016-0124-1 · Cited by 151 · cited 1×
“GFAP (astrocytes) and Olig2 (oligodendrocytes) were highly expressed in layer I [38–40] and the WM [41, 42], respectively.”
Background
Research works printed but not linked: 47
- Wu YT, Beiser AS, Breteler MMB, Fratiglioni L, Helmer C, Hendrie HC et al (2017) The changing prevalence and incidence of dementia over time - current evidence. Nat Rev Neurol 13:327–339 · DOI · Paper page
- Butt AM, De La Rocha IC, Rivera A (2019) Oligodendroglial cells in Alzheimer’s disease. Adv Exp Med Biol 1175:325–333 · DOI
- Kenigsbuch M, Bost P, Halevi S, Chang Y, Chen S, Ma Q et al (2022) A shared disease-associated oligodendrocyte signature among multiple CNS pathologies. Nat Neurosci 25:876–886 · DOI · Paper page
- Thal DR, Rub U, Orantes M, Braak H (2002) Phases of A beta-deposition in the human brain and its relevance for the development of AD. Neurology 58:1791–1800 · DOI · Paper page
- Leng K, Li E, Eser R, Piergies A, Sit R, Tan M et al (2021) Molecular characterization of selectively vulnerable neurons in Alzheimer’s disease. Nat Neurosci 24:276–287 · DOI · Paper page
- Mathys H, Davila-Velderrain J, Peng Z, Gao F, Mohammadi S, Young JZ et al (2019) Single-cell transcriptomic analysis of Alzheimer’s disease. Nature 570:332–337 · DOI · Paper page
- Fu H, Possenti A, Freer R, Nakano Y, Hernandez Villegas NC, Tang M et al (2019) A tau homeostasis signature is linked with the cellular and regional vulnerability of excitatory neurons to tau pathology. Nat Neurosci 22:47–56 · DOI · Paper page
- Navarro JF, Croteau DL, Jurek A, Andrusivova Z, Yang B, Wang Y et al (2020) Spatial transcriptomics reveals genes associated with dysregulated mitochondrial functions and stress signaling in Alzheimer disease. Science 23:1056
- Pasquini L, Rahmani F, Maleki-Balajoo S, La Joie R, Zarei M, Sorg C et al (2019) Medial temporal lobe disconnection and hyperexcitability across Alzheimer’s disease stages. J Alzheimers Dis Rep 3:103–112 · DOI
- Brokaw DL, Piras IS, Mastroeni D, Weisenberger DJ, Nolz J, Delvaux E et al (2020) Cell death and survival pathways in Alzheimer’s disease: an integrative hypothesis testing approach utilizing -omic data sets. Neurobiol Aging 95:15–25 · DOI
- Piras IS, Krate J, Delvaux E, Nolz J, Mastroeni DF, Persico AM et al (2019) Transcriptome changes in the Alzheimer’s disease middle temporal gyrus: importance of RNA metabolism and mitochondria-associated membrane genes. J Alzheimers Dis 70:691–713 · DOI
- Safaiyan S, Besson-Girard S, Kaya T, Cantuti-Castelvetri L, Liu L, Ji H et al (2021) White matter aging drives microglial diversity. Neuron 109(1100–1117):e1110
- Johnson ECB, Dammer EB, Duong DM, Ping L, Zhou M, Yin L et al (2020) Large-scale proteomic analysis of Alzheimer’s disease brain and cerebrospinal fluid reveals early changes in energy metabolism associated with microglia and astrocyte activation. Nat Med 26:769–780 · DOI · Paper page
- Beach TG, Adler CH, Sue LI, Serrano G, Shill HA, Walker DG et al (2015) Arizona study of aging and neurodegenerative disorders and brain and body donation program. Neuropathology 35:354–389 · DOI · Paper page
- Vonsattel JP, Del Amaya MP, Keller CE (2008) Twenty-first century brain banking. Processing brains for research: the Columbia University methods. Acta Neuropathol 115:509–532 · DOI
- Stuart T, Butler A, Hoffman P, Hafemeister C, Papalexi E, Mauck WM 3rd et al (2019) Comprehensive integration of single-cell data. Cell 177(1888–1902):e1821
- Maynard KR, Collado-Torres L, Weber LM, Uytingco C, Barry BK, Williams SR et al (2021) Transcriptome-scale spatial gene expression in the human dorsolateral prefrontal cortex. Nat Neurosci 24:425–436 · DOI · Paper page
- Orehek A, Iglesias-Rozas JR, Garrosa MJAaS (2019) Architectural Arrangement of Neurons as Part of the Functional Unit of the Central Nervous System · DOI
- Langfelder P, Horvath S (2012) Fast R functions for Robust correlations and hierarchical clustering. J Stat Softw 46:1 · DOI
- Hagen MD, Kassirer JP, Kopelman RI (1989) Tripping over technology. Hosp Pract (Off Ed) 24(25–28):33–25
- Yu G, Wang LG, Han Y, He QY (2012) clusterProfiler: an R package for comparing biological themes among gene clusters. OMICS 16:284–287 · DOI · Paper page
- Oberheim NA, Takano T, Han X, He W, Lin JH, Wang F et al (2009) Uniquely hominid features of adult human astrocytes. J Neurosci 29:3276–3287 · DOI · Paper page
- Oberheim NA, Wang X, Goldman S, Nedergaard M (2006) Astrocytic complexity distinguishes the human brain. Trends Neurosci 29:547–553 · DOI · Paper page
- O’Leary LA, Davoli MA, Belliveau C, Tanti A, Ma JC, Farmer WT et al (2020) Characterization of vimentin-immunoreactive astrocytes in the human brain. Front Neuroanat 14:31 · DOI
- Hofmann K, Rodriguez-Rodriguez R, Gaebler A, Casals N, Scheller A, Kuerschner L (2017) Astrocytes and oligodendrocytes in grey and white matter regions of the brain metabolize fatty acids. Sci Rep 7:10779 · DOI
- Garcia-Cabezas MA, Zikopoulos B, Barbas H (2019) The Structural Model: a theory linking connections, plasticity, pathology, development and evolution of the cerebral cortex. Brain Struct Funct 224:985–1008 · DOI
- Pearson RC, Esiri MM, Hiorns RW, Wilcock GK, Powell TP (1985) Anatomical correlates of the distribution of the pathological changes in the neocortex in Alzheimer disease. Proc Natl Acad Sci U S A 82:4531–4534 · DOI · Paper page
- Chung NC, Miasojedow B, Startek M, Gambin A (2019) Jaccard/Tanimoto similarity test and estimation methods for biological presence-absence data. BMC Bioinf 20:644 · DOI
- Andersson A, Bergenstrahle J, Asp M, Bergenstrahle L, Jurek A, Fernandez Navarro J et al (2020) Single-cell and spatial transcriptomics enables probabilistic inference of cell type topography. Commun Biol 3:565 · DOI
- Li B, Zhang W, Guo C, Xu H, Li L, Fang M et al (2022) Benchmarking spatial and single-cell transcriptomics integration methods for transcript distribution prediction and cell type deconvolution. Nat Methods 19:662–670 · DOI · Paper page
- Kleshchevnikov V, Shmatko A, Dann E, Aivazidis A, King HW, Li T et al (2022) Cell 2location maps fine-grained cell types in spatial transcriptomics. Nat Biotechnol 40:661–671 · DOI · Paper page
- Thal DR, Rub U, Schultz C, Sassin I, Ghebremedhin E, Del Tredici K et al (2000) Sequence of Abeta-protein deposition in the human medial temporal lobe. J Neuropathol Exp Neurol 59:733–748 · DOI · Paper page
- Langseth CM, Gyllborg D, Miller JA, Close JL, Long B, Lein ES et al (2021) Comprehensive in situ mapping of human cortical transcriptomic cell types. Commun Biol 4:998 · DOI
- Otero-Garcia M, Xue Y-Q, Shakouri T, Deng Y, Morabito S, Allison T, et al (2020) Single-soma transcriptomics of tangle-bearing neurons in Alzheimer’s disease reveals the signatures of tau-associated synaptic dysfunction · DOI
- Robinson MD, McCarthy DJ, Smyth GK (2010) edgeR: a Bioconductor package for differential expression analysis of digital gene expression data. Bioinformatics 26:139–140 · DOI · Paper page
- Gu Z, Gu L, Eils R, Schlesner M, Brors B (2014) circlize Implements and enhances circular visualization in R. Bioinformatics 30:2811–2812 · DOI
- Musiek ES, Holtzman DM (2015) Three dimensions of the amyloid hypothesis: time, space and “wingmen.” Nat Neurosci 18:800–806 · DOI · Paper page
- Zhang Y, Sloan SA, Clarke LE, Caneda C, Plaza CA, Blumenthal PD et al (2016) Purification and characterization of progenitor and mature human astrocytes reveals transcriptional and functional differences with mouse. Neuron 89:37–53 · DOI · Paper page
- Molyneaux BJ, Arlotta P, Menezes JR, Macklis JD (2007) Neuronal subtype specification in the cerebral cortex. Nat Rev Neurosci 8:427–437 · DOI
- Li HL, Wang HH, Liu SJ, Deng YQ, Zhang YJ, Tian Q et al (2007) Phosphorylation of tau antagonizes apoptosis by stabilizing beta-catenin, a mechanism involved in Alzheimer’s neurodegeneration. Proc Natl Acad Sci U S A 104:3591–3596 · DOI
- Stevens B, Allen NJ, Vazquez LE, Howell GR, Christopherson KS, Nouri N et al (2007) The classical complement cascade mediates CNS synapse elimination. Cell 131:1164–1178 · DOI · Paper page
- Chai YL, Chong JR, Raquib AR, Xu X, Hilal S, Venketasubramanian N et al (2021) Plasma osteopontin as a biomarker of Alzheimer’s disease and vascular cognitive impairment. Sci Rep 11:4010 · DOI
- Selig EE, Zlatic CO, Cox D, Mok YF, Gooley PR, Ecroyd H et al (2020) N- and C-terminal regions of alphaB-crystallin and Hsp27 mediate inhibition of amyloid nucleation, fibril binding, and fibril disaggregation. J Biol Chem 295:9838–9854 · DOI
- Layfield R, Fergusson J, Aitken A, Lowe J, Landon M, Mayer RJ (1996) Neurofibrillary tangles of Alzheimer’s disease brains contain 14-3-3 proteins. Neurosci Lett 209:57–60 · DOI
- Liang D, Han G, Feng X, Sun J, Duan Y, Lei H (2012) Concerted perturbation observed in a hub network in Alzheimer’s disease. PLoS ONE 7:e40498 · DOI · Paper page
- Suo C, Dann E, Goh I, Jardine L, Kleshchevnikov V, Park JE et al. (2022) Mapping the developing human immune system across organs. Science 376:eabo0510 · DOI
- Tavares-Ferreira D, Shiers S, Ray PR, Wangzhou A, Jeevakumar V, Sankaranarayanan I, et al. (2022) Spatial transcriptomics of dorsal root ganglia identifies molecular signatures of human nociceptors. Sci Transl Med 14:eabj8186 · DOI
Cited by
Sorted by citations
Integrated multimodal cell atlas of Alzheimer’s disease
Gabitto, M. I., Travaglini, K. J., Rachleff, V. M., Kaplan, E. S., Long, B., Ariza, J., Ding, Y., Mahoney, J. T., Dee, N., Goldy, J., et al. (2024) · Nature Neuroscience · doi:10.1038/s41593-024-01774-5 · Cited by 397
A shared disease-associated oligodendrocyte signature among multiple CNS pathologies
Kenigsbuch, M., Bost, P., Halevi, S., Chang, Y., Chen, S., Ma, Q., Hajbi, R., Schwikowski, B., Bodenmiller, B., Fu, H., et al. (2022) · Nature Neuroscience · doi:10.1038/s41593-022-01104-7 · Cited by 233
Self-citationUncovering Plaque-Glia Niches in Human Alzheimer’s Disease Brains Using Spatial Transcriptomics
Avey, D. R., Ng, B., Vialle, R. A., Kearns, N. A., de Paiva Lopes, K., Iatrou, A., De Tissera, S., Vyas, H., Saunders, D. M., Flood, D. J., et al. (2024) · doi:10.1101/2024.09.05.611566 · Cited by 24
D’Oliveira Albanus, R., Finan, G. M., Brase, L., Sweeney, N., Kim, T. Y., Chen, S., Ryoo, Y., Park, J., Guo, Q., Iyer, A. K., et al. (2025) · Science Translational Medicine · doi:10.1126/scitranslmed.adx0027 · Cited by 19
Self-citationGRAMD1B is a regulator of lipid homeostasis, autophagic flux and phosphorylated tau
Acosta Ingram, D., Turkes, E., Kim, T. Y., Vo, S., Sweeney, N., Bonte, M.-A., Rutherford, R., Julian, D. L., Pan, M., Marsh, J., et al. (2025) · Nature Communications · doi:10.1038/s41467-025-58585-w · Cited by 12
Self-citation
Metadata
- Authors
- Chen, S., Chang, Y., Li, L., Acosta, D., Li, Y., Guo, Q., Wang, C., Turkes, E., Morrison, C., Julian, D., Hester, M. E., Scharre, D. W., Santiskulvong, C., Song, S. X., Plummer, J. T., Serrano, G. E., Beach, T. G., Duff, K. E., Ma, Q., & Fu, H.
- ORCID
- Fu, Hongjun
- Venue
- Acta Neuropathologica Communications
- Published
- 2022-12-21
- Volume
- 10
- Issue
- 1
- ISSN
- 2051-5960
- PMC
- PMC9773466
- Cited by
- 144
- References
- 31
- Language
- en
- Funders
- National Institute on Aging (R01-AG075092-01, K01-AG056673, R56-AG066782-01)
- National Institute of General Medical Sciences (R01-GM131399)
- Alzheimer's Association (AARF-17-505009)
- U.S. Department of Defense (W81XWH1910309)
- Foundation for the National Institutes of Health (U24-NS072026, P30-AG19610)
About these checks
Registry, retraction, Cites and statistics results are computed, not judged, with one exception: a printed reference that no index lists is read once by a model before it counts as a citation error. Claims are extracted by a model and kept only when their quote appears verbatim in the text; each cited source is then checked, with a model’s help, for whether it says what the claim relies on. Those verdicts can be wrong — read the claim’s quote and the cited source before relying on one.
Statistics and arithmetic are recomputed, not judged.
Confidence bands are shown only for fields calibrated on our annotated test set. None is calibrated yet, so no band is shown.
What counts as a claim ›How we measure confidence ›How we check this ›
Are you an author, or do you see a problem with this page? Request a review
