

The DOI matches its Crossref record; 55 of the 55 references it cites were found in a registry or an index.
Creating visual explanations improves learning
Open accessAbstract
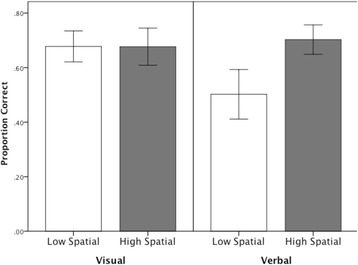
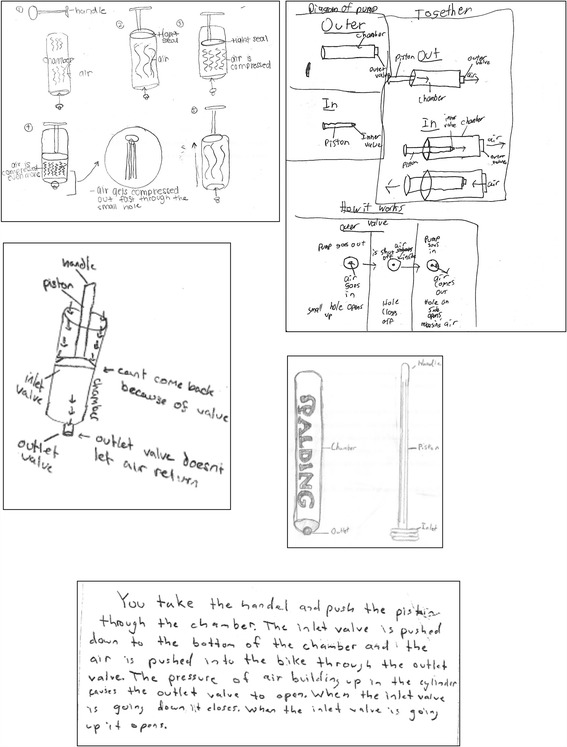
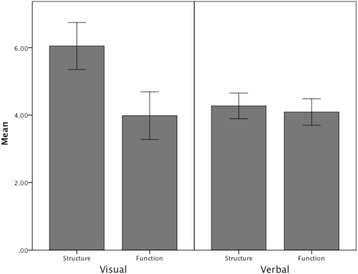
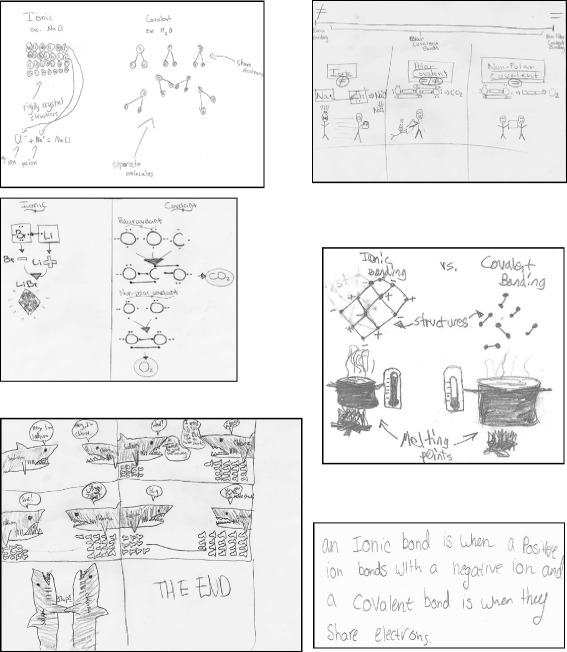
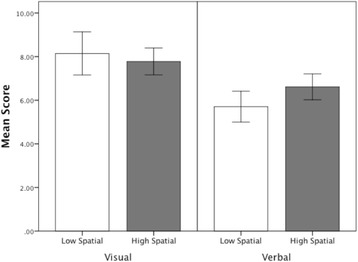
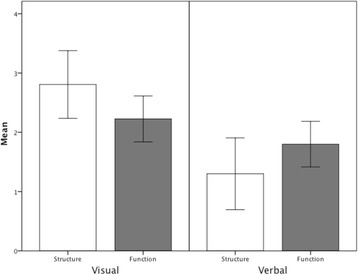
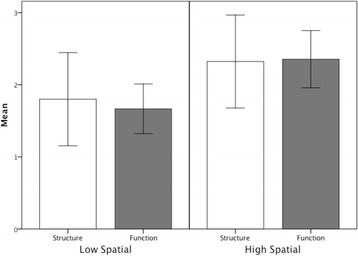
Many topics in science are notoriously difficult for students to learn. Mechanisms and processes outside student experience present particular challenges. While instruction typically involves visualizations, students usually explain in words. Because visual explanations can show parts and processes of complex systems directly, creating them should have benefits beyond creating verbal explanations. We compared learning from creating visual or verbal explanations for two STEM domains, a mechanical system (bicycle pump) and a chemical system (bonding). Both kinds of explanations were analyzed for content and learning assess by a post-test. For the mechanical system, creating a visual explanation increased understanding particularly for participants of low spatial ability. For the chemical system, creating both visual and verbal explanations improved learning without new teaching. Creating a visual explanation was superior and benefitted participants of both high and low spatial ability. Visual explanations often included crucial yet invisible features. The greater effectiveness of visual explanations appears attributable to the checks they provide for completeness and coherence as well as to their roles as platforms for inference. The benefits should generalize to other domains like the social sciences, history, and archeology where important information can be visualized. Together, the findings provide support for the use of learner-generated visual explanations as a powerful learning tool.
Overview
The claims and statistics of this paper haven’t been checked yet.
Free: it reads the open-access text and checks the first 5 claims that cite a source we can check. Create a free account to check every claim.
Integrity signals
Registry
Cites
Statistics
Figures
Verification
Claims the paper makes
The claims and statistics of this paper haven’t been checked yet.
Free: it reads the open-access text and checks the first 5 claims that cite a source we can check. Create a free account to check every claim.
Claims other papers make about this one
Each is checked against this paper’s own text: does it say what the citing paper says it does?
The cited source says what the claim attributes to it.
In the citing paper
“Representational transformations (e.g., turning a diagram into a paragraph of text or vice versa ) are a useful part of knowledge work (e.g., [6, 8, 26]), but they take additional effort.”
From Accessibility-Driven Information Transformations in Mixed-Visual Ability Work Teams (2026) · cites this paper as [8]
The cited source says what the claim attributes to it.
In the citing paper
“While student representational drawing is backed by research (e.g., Bobek and Tversky, 2016) and occasionally recommended (Fiorella and Mayer, 2016), the research also indicates implementation can be difficult (Fiorella and Zhang, 2018).”
From Moving the Needle: Evidence of an Effective Study Strategy Intervention in a Community College Biology Course (2022) · cites this paper as Bobek and Tversky, 2016
The cited source says what the claim attributes to it.
In the citing paper
“Bobek and Tversky (2016) found an improvement in middle school students who created visual explanations of a bicycle pump and chemical bonding.”
From Moving the Needle: Evidence of an Effective Study Strategy Intervention in a Community College Biology Course (2022) · cites this paper as Bobek and Tversky (2016)
Self-check
Percentages, sums and reported differences re-computed from the paper’s own numbers.
The self-check needs the paper’s full text.
Citations
Cites
Levels of processing: A framework for memory research
Craik, F. I. M., & Lockhart, R. S. (1972) · Journal of Verbal Learning and Verbal Behavior · doi:10.1016/s0022-5371(72)80001-x · Cited by 9,566 · cited 2×
“Translating verbal information from the text into a visual explanation may promote deeper processing of the material and more complete and comprehensive mental models (Craik & Lockhart, 1972).”
BackgroundMethod(1991) · Choice Reviews Online · doi:10.5860/choice.28-5764 · Cited by 6,847
Why a Diagram is (Sometimes) Worth Ten Thousand Words
Larkin, J. H., & Simon, H. A. (1987) · Cognitive Science · doi:10.1016/s0364-0213(87)80026-5 · Cited by 3,733 · cited 2×
“They also help to draw inferences (Larkin & Simon, 1987), find routes in maps (Levine, 1982), spot trends in graphs (Kessell & Tversky, 2011; Zacks & Tversky, 1999), imagine traffic flow or seasonal changes in light from architectural sketches (e.g. Tversky & Suwa, 2009), and determine the…”
BackgroundVoyer, D., Voyer, S., & Bryden, M. P. (1995) · Psychological Bulletin · doi:10.1037/0033-2909.117.2.250 · Cited by 2,868
Test-Enhanced Learning: Taking Memory Tests Improves Long-Term Retention
Roediger, H. L., & Karpicke, J. D. (2006) · Psychological Science · doi:10.1111/j.1467-9280.2006.01693.x · Cited by 2,867
The Psychology of Learning and Motivation
Ross, B. H. (2012) · Cited by 2,633
Mental Rotations, a Group Test of Three-Dimensional Spatial Visualization
Vandenberg, S. G., & Kuse, A. R. (1978) · Perceptual and Motor Skills · doi:10.2466/pms.1978.47.2.599 · Cited by 2,620
The malleability of spatial skills: A meta-analysis of training studies.
Uttal, D. H., Meadow, N. G., Tipton, E., Hand, L. L., Alden, A. R., Warren, C., & Newcombe, N. S. (2013) · Psychological Bulletin · doi:10.1037/a0028446 · Cited by 1,899
Active‐Constructive‐Interactive: A Conceptual Framework for Differentiating Learning Activities
Chi, M. T. H. (2009) · Topics in Cognitive Science · doi:10.1111/j.1756-8765.2008.01005.x · Cited by 1,597 · cited 2×
“Visual explanations often included crucial yet invisible features.”
BackgroundWhy is science difficult to learn? Things are seldom what they seem
Johnstone, A. H. (1991) · Journal of Computer Assisted Learning · doi:10.1111/j.1365-2729.1991.tb00230.x · Cited by 1,321 · cited 3×
“o reproduction in any medium, provided you giv the Creative Commons license, and indicate if Dynamic systems such as those in science and engineering, but also in history, politics, and other domains, are notoriously difficult to learn (e.g. Chi, DeLeeuw, Chiu, & Lavancher, 1994; Hmelo-Silver & Pfeffer, 2004; Johnston…”
Background
Cited by
Castro-Alonso, J. C., de Koning, B. B., Fiorella, L., & Paas, F. (2021) · Educational Psychology Review · doi:10.1007/s10648-021-09606-9 · Cited by 278
AI, big data, and the future of consent
Andreotta, A. J., Kirkham, N., & Rizzi, M. (2022) · AI & SOCIETY · doi:10.1007/s00146-021-01262-5 · Cited by 164
Drawing Boundary Conditions for Learning by Drawing
Fiorella, L., & Zhang, Q. (2018) · Educational Psychology Review · doi:10.1007/s10648-018-9444-8 · Cited by 161
“…displays, learner-generated drawings primarily serve to depict a system’s physical characteristics, though both pictures and drawings can vary in their precise level of physical and conceptual fidelity (Butcher 2006) and often contain the integration of words (Bobek and Tversky 2016; Mayer 2014).”
BackgroundInfluentialMaking Sense of Generative Learning
Fiorella, L. (2023) · Educational Psychology Review · doi:10.1007/s10648-023-09769-7 · Cited by 135
“However, like many GLA studies, the study by Bobek and Tversky (2016) tested explaining and drawing separately and thus it could not directly assess how drawing affected the quality of students’ explanations.”
BackgroundInfluentialHow Do Teachers Use Comics to Promote Engagement, Equity, and Diversity in Science Classrooms?
Matuk, C. F., Hurwich, T., SPIEGEL, A. N., & Diamond, J. (2019) · Research in Science Education · doi:10.1007/s11165-018-9814-8 · Cited by 150
“They do so by helping to develop students’ mental representations (Lansing 1981, 1984), enable inferences (Bobek and Tversky, 2016), and promote conceptual change (Edens and Potter 2003).”
Metadata
- Authors
- Bobek, E., & Tversky, B.
- Affiliations
- University of Massachusetts Lowell (US)
- Columbia University (US)
- Corresponding author
- Bobek, Eliza
- Venue
- Cognitive Research: Principles and Implications
- Published
- 2016-12
- Volume
- 1
- Issue
- 1
- Pages
- 27-27
- ISSN
- 2365-7464 (ISSN-L)
- PMC
- PMC5256450
- OpenAlex
- W2560277832
- Cited by
- 298
- References
- 55
- Citations by year
- 2026: 25 · 2025: 54 · 2024: 53 · 2023: 33 · 2022: 42 · 2021: 32 · 2020: 32 · 2019: 14 · 2018: 5 · 2017: 5
- FWCI
- 11.39
- Type
- journal article
- Language
- en
- Open access
- gold
- doi.org
- Licence
- cc-by
- creativecommons.org/licenses/by/4.0 (tdm)
- creativecommons.org/licenses/by/4.0 (vor, 6 d)
- Locations
- Cognitive Research Principles and Implications (publishedVersion, cc-by)
- Europe PMC (PubMed Central) (publishedVersion, cc-by)
- PubMed Central (publishedVersion, cc-by)
- PubMed (publishedVersion)
- eScholarship (California Digital Library) (submittedVersion)
- Funders
- National Science Foundation (CHS-1513841, HHC 0905417, IIS-0725223, IIS-0855995, REC 0440103)
- Topics
- Social Sciences › Psychology › Experimental and Cognitive Psychology › Visual and Cognitive Learning Processes
- Social Sciences › Education › Science Education and Pedagogy
- Social Sciences › Psychology › Developmental and Educational Psychology › Innovative Teaching and Learning Methods
- Keywords
- visual explanations, verbal explanation, science learning, spatial ability, mechanical systems, chemical bonding, inference, complex systems, STEM education
About these checks
Registry, retraction, Cites and statistics results are computed, not judged, with one exception: a printed reference that no index lists is read once by a model before it counts as a citation error. Claims are extracted by a model and kept only when their quote appears verbatim in the text; each cited source is then checked, with a model’s help, for whether it says what the claim relies on. Those verdicts can be wrong — read the claim’s quote and the cited source before relying on one.
Statistics and arithmetic are recomputed, not judged.
Confidence bands are shown only for fields calibrated on our annotated test set. None is calibrated yet, so no band is shown.
What counts as a claim ›How we measure confidence ›How we check this ›
Are you an author, or do you see a problem with this page? Request a review
How to cite
Cite CoChat for the checks on this page, and the paper for its own findings.
- This page
- CoChat. (2026). Citation check: Creating visual explanations improves learning. https://app.cochat.ai/papers/10.1186/s41235-016-0031-6
- The paper
- Bobek, E., & Tversky, B. (2016). Creating visual explanations improves learning. Cognitive Research: Principles and Implications. https://doi.org/10.1186/s41235-016-0031-6
Data sources
Bibliographic data: Semantic Scholar, OpenAlex, Crossref.
Contains information from the Semantic Scholar Academic Graph Datasets, made available under the ODC Attribution License (ODC-BY 1.0).
Semantic Scholar’s data is described in: Kinney, R., et al. (2023). The Semantic Scholar Open Data Platform. arXiv:2301.10140.
