Cited by 134

The DOI matches its Crossref record; 10 of the 10 references it cites were found in a registry or an index.

miR-139-5p is a regulator of metastatic pathways in breast cancer

Krishnan, Keerthana, Steptoe, Anita L., Martin, Hilary C., Pattabiraman, Diwakar R., Nones, Katia, Waddell, Nic, Mariasegaram, Mythily, Simpson, Peter T., Lakhani, Sunil R., Vlassov, Alexander, Grimmond, Sean M., Cloonan, Nicole·2013·RNA

Abstract

Metastasis is a complex, multistep process involved in the progression of cancer from a localized primary tissue to distant sites, often characteristic of the more aggressive forms of this disease. Despite being studied in great detail in recent years, the mechanisms that govern this process remain poorly understood. In this study, we identify a novel role for miR-139-5p in the inhibition of breast cancer progression. We highlight its clinical relevance by reviewing miR-139-5p expression across a wide variety of breast cancer subtypes using in-house generated and online data sets to show that it is most frequently lost in invasive tumors. A biotin pull-down approach was then used to identify the mRNA targets of miR-139-5p in the breast cancer cell line MCF7. Functional enrichment analysis of the pulled-down targets showed significant enrichment of genes in pathways previously implicated in breast cancer metastasis (P< 0.05). Further bioinformatic analysis revealed a predicted disruption to the TGFβ, Wnt, Rho, and MAPK/PI3K signaling cascades, implying a potential role for miR-139-5p in regulating the ability of cells to invade and migrate. To corroborate this finding, using the MDA-MB-231 breast cancer cell line, we show that overexpression of miR-139-5p results in suppression of these cellular phenotypes. Furthermore, we validate the interaction between miR-139-5p and predicted targets involved in these pathways. Collectively, these results suggest a significant functional role for miR-139-5p in breast cancer cell motility and invasion and its potential to be used as a prognostic marker for the aggressive forms of breast cancer.

Overview

The claims and statistics of this paper haven’t been checked yet.

Run the check — free, no account needed. It reads the open-access text and checks the sources it cites.

A few free checks a day · papers already verified open instantly · results are public

Integrity signals

Registry

Crossref · 10.1261/rna.042143.113

Cites

10 of 10 references verified0 citation errors · 0 not checkable

Statistics

Figures

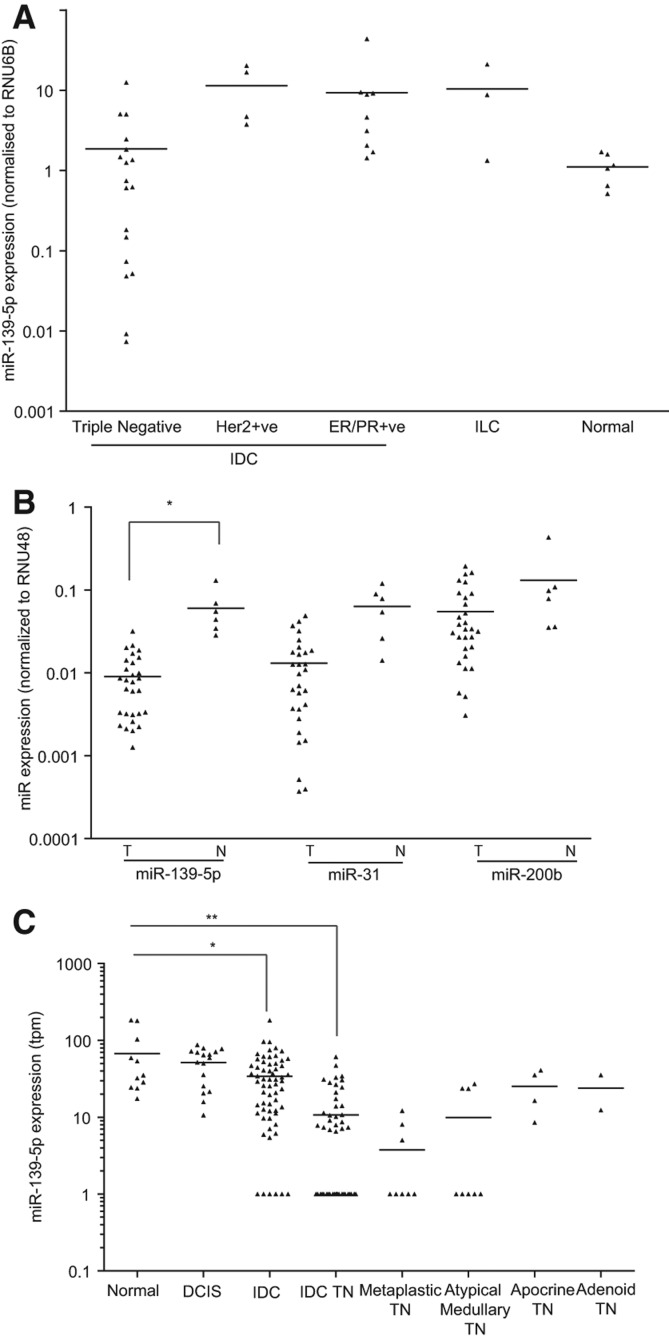
FIGURE 1. Expression analysis of miR-139-5p across tumor subtypes and normal tissue from human breast cancer patient samples. (A) Lines represent the mean of miR-139-5p expression (normalized to RNU6B) across sample subtypes: triple negative (n = 18), Her2+ (n = 4), ER+/PR+ (n = 9), invasive lobular carcinomas (n = 3), normal breast tissue (n = 6). Triangles represent the expression levels for individual patients. (B) Expression of miRNAs in breast cancer as assessed by TaqMan Low Density Arrays (Romero-Cordoba et al. 2012). Lines represent the mean expression of miR-139-5p, alongside well-characterized anti-metastatic miRNAs like miR-31 and miR-200b (normalized to RNU6B) across the sample cohort (comparing tumor versus normal along the x-axis). Triangles represent the expression levels for individual patients. Asterisks indicate significant difference between the expression of miR-139-5p in the tumour compared to the adjacent normal tissue ([*] P < 0.0001, Student's t-test). (C) miR-139-5p expression as assessed using miRNA-sequencing from Farazi et al. (2011) across normal breast tissue (n = 16) and a panel of breast cancer patient samples of various subtypes, including adenoid cystic carcinoma (n = 2), apocrine carcinoma (n = 4), atypical medullary carcinoma (n = 9), metaplastic carcinoma (n = 11), mucinous carcinoma (n = 1), ductal carcinoma in situ (DCIS) (n = 21), and invasive ductal carcinoma (IDC) (n = 174). Lines and scatter plot represent the mean across a subtype and the transcripts per million (tpm) of miR-139-5p in each sequenced sample, respectively. Asterisks indicate significant difference between the expression of miR-139-5p in the specific tumor subtype compared to the normal tissue. (**) P < 0.0001, (*) P ∼ 0.007, Student's t-test.
FIGURE 1. Expression analysis of miR-139-5p across tumor subtypes and normal tissue from human breast cancer patient samples. (A) Lines represent the mean of miR-139-5p expression (normalized to RNU6B) across sample subtypes: triple negative (n = 18), Her2+ (n = 4), ER+/PR+ (n = 9), invasive lobular carcinomas (n = 3), normal breast tissue (n = 6). Triangles represent the expression levels for individual patients. (B) Expression of miRNAs in breast cancer as assessed by TaqMan Low Density Arrays (Romero-Cordoba et al. 2012). Lines represent the mean expression of miR-139-5p, alongside well-characterized anti-metastatic miRNAs like miR-31 and miR-200b (normalized to RNU6B) across the sample cohort (comparing tumor versus normal along the x-axis). Triangles represent the expression levels for individual patients. Asterisks indicate significant difference between the expression of miR-139-5p in the tumour compared to the adjacent normal tissue ([*] P < 0.0001, Student's t-test). (C) miR-139-5p expression as assessed using miRNA-sequencing from Farazi et al. (2011) across normal breast tissue (n = 16) and a panel of breast cancer patient samples of various subtypes, including adenoid cystic carcinoma (n = 2), apocrine carcinoma (n = 4), atypical medullary carcinoma (n = 9), metaplastic carcinoma (n = 11), mucinous carcinoma (n = 1), ductal carcinoma in situ (DCIS) (n = 21), and invasive ductal carcinoma (IDC) (n = 174). Lines and scatter plot represent the mean across a subtype and the transcripts per million (tpm) of miR-139-5p in each sequenced sample, respectively. Asterisks indicate significant difference between the expression of miR-139-5p in the specific tumor subtype compared to the normal tissue. (**) P < 0.0001, (*) P ∼ 0.007, Student's t-test.CC BY-NC · PubMed Central
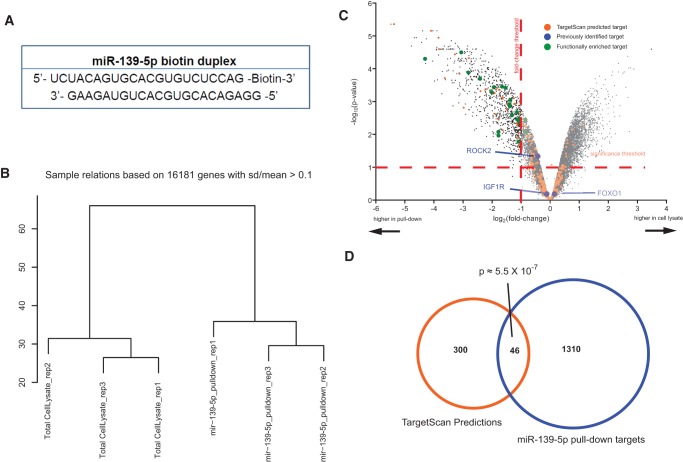
FIGURE 2. Identifying targets of miR-139-5p via biotin pull-down. (A) Sequence and position of biotin in the molecule used to transfect MCF7 cells for the pull-down approach used to identify biologically relevant targets of miR-139-5p. (B) Hierarchical clustering of microarray data was performed using the plotSampleRelations function in the lumi package. Total vertical distance between samples indicates similarity. (C) A “volcano plot” showing the log2-transformed fold-change versus the log10-transformed P-value of that fold-change for every gene detected above background in the microarray. Genes highlighted in blue are targets validated by previous studies. Genes highlighted in orange are predicted by TargetScan to be targets of miR-139-5p, showing an enrichment of the targets in the pull-downs compared to the controls. Genes highlighted in green have known association with pathways frequently involved in metastasis. (D) Venn diagram showing the overlap of genes between TargetScan predicted targets of miR-139-5p (also expressed above background in HEK293Ts) and biotinylated miR-139-5p pull-down predicted targets. This overlap is significantly more than expected by chance.
FIGURE 2. Identifying targets of miR-139-5p via biotin pull-down. (A) Sequence and position of biotin in the molecule used to transfect MCF7 cells for the pull-down approach used to identify biologically relevant targets of miR-139-5p. (B) Hierarchical clustering of microarray data was performed using the plotSampleRelations function in the lumi package. Total vertical distance between samples indicates similarity. (C) A “volcano plot” showing the log2-transformed fold-change versus the log10-transformed P-value of that fold-change for every gene detected above background in the microarray. Genes highlighted in blue are targets validated by previous studies. Genes highlighted in orange are predicted by TargetScan to be targets of miR-139-5p, showing an enrichment of the targets in the pull-downs compared to the controls. Genes highlighted in green have known association with pathways frequently involved in metastasis. (D) Venn diagram showing the overlap of genes between TargetScan predicted targets of miR-139-5p (also expressed above background in HEK293Ts) and biotinylated miR-139-5p pull-down predicted targets. This overlap is significantly more than expected by chance.CC BY-NC · PubMed Central
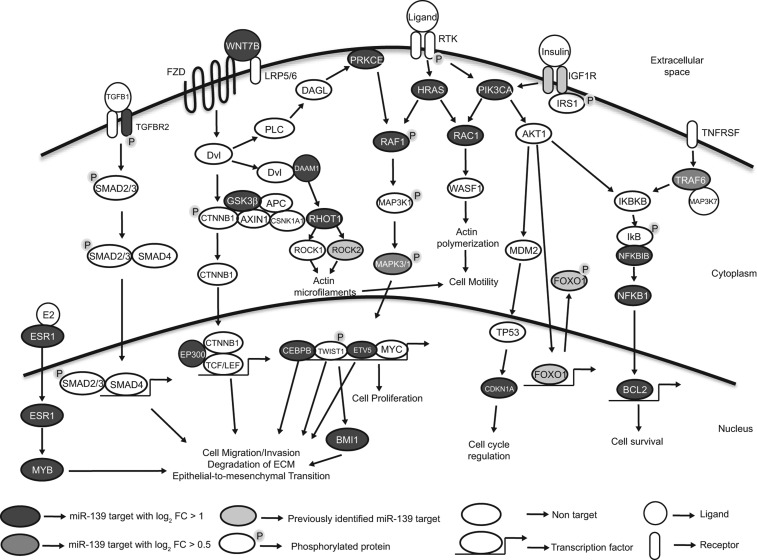
FIGURE 3. Overview of biotinylated miR-139-5p pull-down predicted targets involved in breast cancer invasion and metastasis. Illustration of major pathways being altered by miR-139-5p and the specific components that are targeted. These major pathways, TGFβ, Wnt, and RTK-induced MAPK and PI3K all play a major role in the process of metastasis. Several components within each of these pathways are targeted by miR-139-5p in our pull-downs with log2 FC > 1 (dark gray) or log2 FC > 0.5 (light gray), or in previously reported studies leading to distinct downstream phenotypes that contribute to the metastatic properties of the cells.
FIGURE 3. Overview of biotinylated miR-139-5p pull-down predicted targets involved in breast cancer invasion and metastasis. Illustration of major pathways being altered by miR-139-5p and the specific components that are targeted. These major pathways, TGFβ, Wnt, and RTK-induced MAPK and PI3K all play a major role in the process of metastasis. Several components within each of these pathways are targeted by miR-139-5p in our pull-downs with log2 FC > 1 (dark gray) or log2 FC > 0.5 (light gray), or in previously reported studies leading to distinct downstream phenotypes that contribute to the metastatic properties of the cells.CC BY-NC · PubMed Central
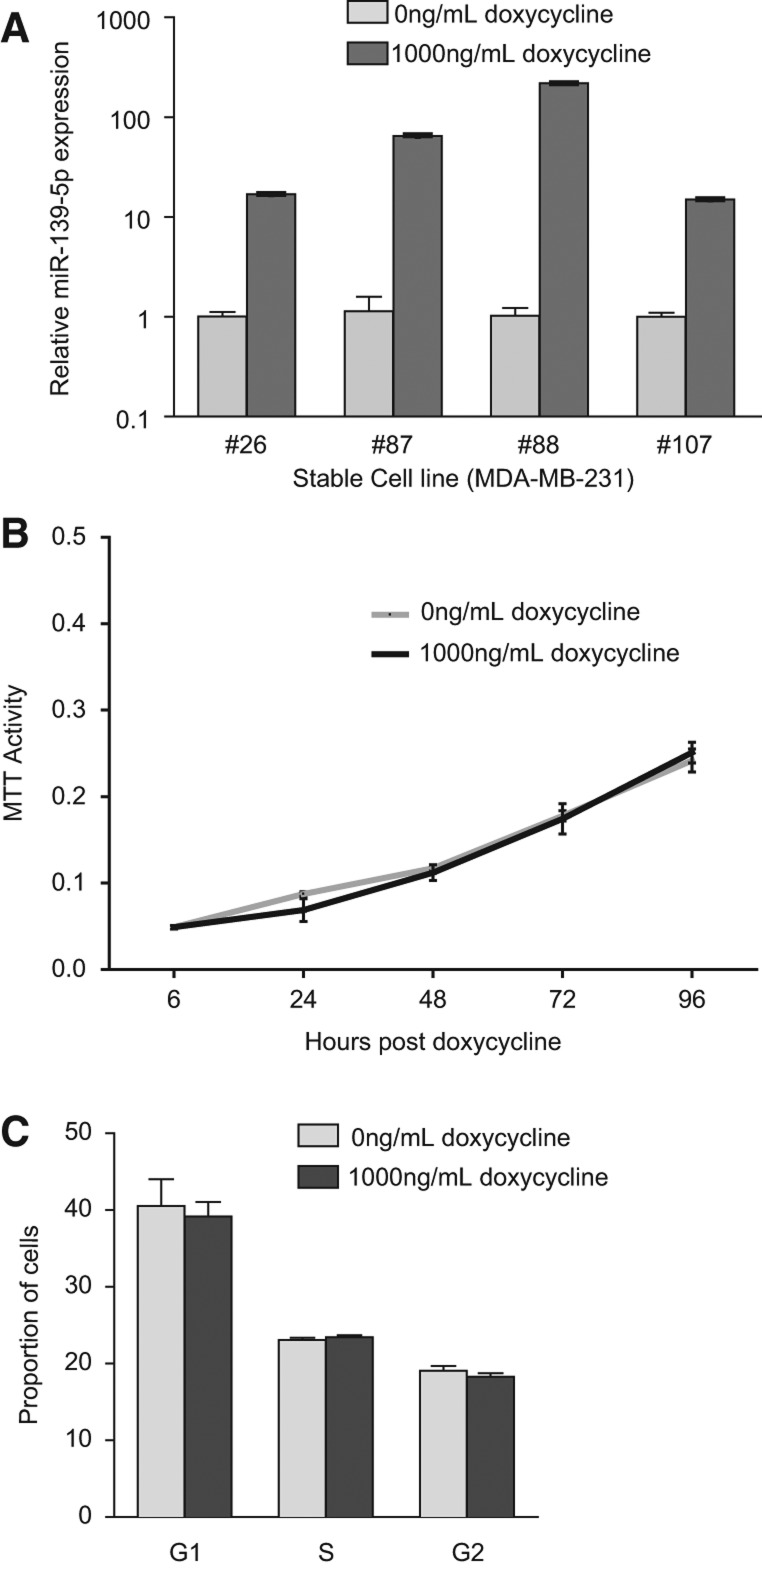
FIGURE 4. Overexpression of miR-139-5p does not induce a proliferative defect. (A) Expression of miR-139-5p as assessed by qRT-PCR in MDA-MB-231 cells (with low endogenous expression of miR-139-5p) stably transfected with miR-139-5p whose expression is induced in response to doxycycline. Four independent cell lines grown in the presence of 0 or 1000 ng/mL of doxycycline for 48 h are shown. RNU6B was used as an endogenous control for normalization of expression. (B) MTT cell proliferation assays of MDA-MB-231 cells stably expressing miR-139-5p. The graph plots the mean and SEM of the stable cell lines grown with either 0 or 1000 ng/mL doxycycline. The induction of miR-139-5p does not affect the proliferation rates of MDA-MB-231 cells. (C) DNA profile analysis of MDA-MB-231 cells stably expressing miR-139-5p. Graph shows the mean and SEM of the percentage of cells in different cell cycle phases, as assessed by FACS. There was no significant difference between MDA-MB-231 cells expressing or not expressing miR-139-5p.
FIGURE 4. Overexpression of miR-139-5p does not induce a proliferative defect. (A) Expression of miR-139-5p as assessed by qRT-PCR in MDA-MB-231 cells (with low endogenous expression of miR-139-5p) stably transfected with miR-139-5p whose expression is induced in response to doxycycline. Four independent cell lines grown in the presence of 0 or 1000 ng/mL of doxycycline for 48 h are shown. RNU6B was used as an endogenous control for normalization of expression. (B) MTT cell proliferation assays of MDA-MB-231 cells stably expressing miR-139-5p. The graph plots the mean and SEM of the stable cell lines grown with either 0 or 1000 ng/mL doxycycline. The induction of miR-139-5p does not affect the proliferation rates of MDA-MB-231 cells. (C) DNA profile analysis of MDA-MB-231 cells stably expressing miR-139-5p. Graph shows the mean and SEM of the percentage of cells in different cell cycle phases, as assessed by FACS. There was no significant difference between MDA-MB-231 cells expressing or not expressing miR-139-5p.CC BY-NC · PubMed Central
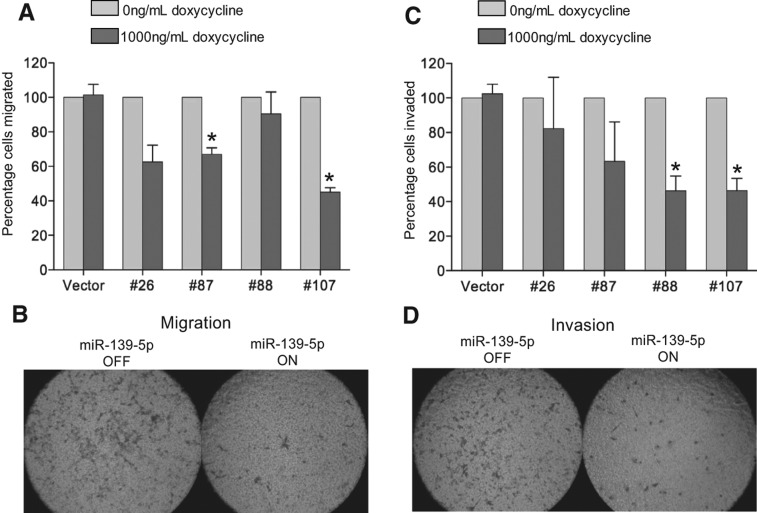
FIGURE 5. The effect of miR-139-5p overexpression on migration and invasion in MDA-MB-231 cells. (A–D) MDA-MB-231 cells stably expressing miR-139-5p and empty vector constructs were subjected to Boyden chamber transwell migration and invasion assays as described. Upon doxycycline-inducible (1000 ng/mL) expression of miR-139-5p. (A) The ability of the cells to migrate decreased to 40%–70% of the original levels in the stable cell lines. (B) Representative images of migrated cells not expressing miR-139-5p (left) and overexpressing miR-139-5p (right). (C) The ability of the cells to invade through a matrigel basement membrane-like matrix decreased to 40%–70% of original levels in the stable cell lines. (D) Representative images of invaded cells not expressing miR-139-5p (left) and overexpressing miR-139-5p (right). The cell lines stably expressing vector controls did not show significant changes in the invasion or migration assays. These experiments were performed with the vector and four different stable cells lines in triplicate. Data plotted are mean and SEM of three independent biological replicates with at least two technical replicates each. Asterisks indicate P < 0.05 in a Student's t-test.
FIGURE 5. The effect of miR-139-5p overexpression on migration and invasion in MDA-MB-231 cells. (A–D) MDA-MB-231 cells stably expressing miR-139-5p and empty vector constructs were subjected to Boyden chamber transwell migration and invasion assays as described. Upon doxycycline-inducible (1000 ng/mL) expression of miR-139-5p. (A) The ability of the cells to migrate decreased to 40%–70% of the original levels in the stable cell lines. (B) Representative images of migrated cells not expressing miR-139-5p (left) and overexpressing miR-139-5p (right). (C) The ability of the cells to invade through a matrigel basement membrane-like matrix decreased to 40%–70% of original levels in the stable cell lines. (D) Representative images of invaded cells not expressing miR-139-5p (left) and overexpressing miR-139-5p (right). The cell lines stably expressing vector controls did not show significant changes in the invasion or migration assays. These experiments were performed with the vector and four different stable cells lines in triplicate. Data plotted are mean and SEM of three independent biological replicates with at least two technical replicates each. Asterisks indicate P < 0.05 in a Student's t-test.CC BY-NC · PubMed Central
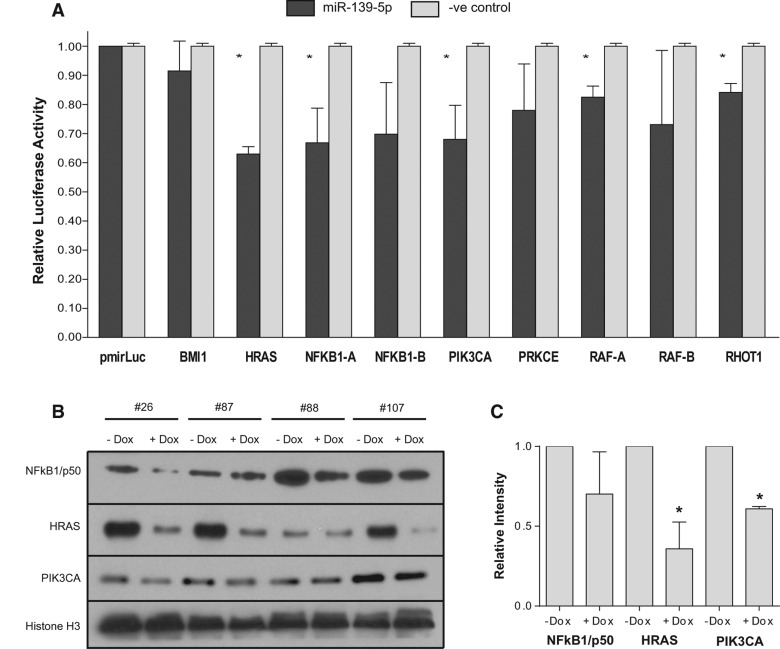
FIGURE 6. Validation of miR-139-5p targets using a luciferase assay and Western blots. (A) MDA-MB-231 cells were transiently cotransfected with 20 nM miR-139-5p or a control mimic with a pMIR-REPORT Luciferase construct containing the predicted binding site from the indicated target gene. Luciferase activity was normalized to β-galactosidase activity (asterisk indicates P < 0.05 as indicated in a Student's t-test). Data plotted are mean and SEM of at least two independent biological replicates with three technical replicates (n ≥ 2). (B) Immunoblotting showing the effects on protein expression of NFKB1/p50, HRAS, and PIK3CA upon induction of miR-139-5p in stably transfected MDA-MB-231 cells. (C) Quantitation of the blots was carried out after normalization to loading control, showing a statistically significant reduction in levels of HRAS and PIK3CA across all stable cell lines. A substantial reduction in NFKB1/p50 was observed in three of four cell lines.
FIGURE 6. Validation of miR-139-5p targets using a luciferase assay and Western blots. (A) MDA-MB-231 cells were transiently cotransfected with 20 nM miR-139-5p or a control mimic with a pMIR-REPORT Luciferase construct containing the predicted binding site from the indicated target gene. Luciferase activity was normalized to β-galactosidase activity (asterisk indicates P < 0.05 as indicated in a Student's t-test). Data plotted are mean and SEM of at least two independent biological replicates with three technical replicates (n ≥ 2). (B) Immunoblotting showing the effects on protein expression of NFKB1/p50, HRAS, and PIK3CA upon induction of miR-139-5p in stably transfected MDA-MB-231 cells. (C) Quantitation of the blots was carried out after normalization to loading control, showing a statistically significant reduction in levels of HRAS and PIK3CA across all stable cell lines. A substantial reduction in NFKB1/p50 was observed in three of four cell lines.CC BY-NC · PubMed Central
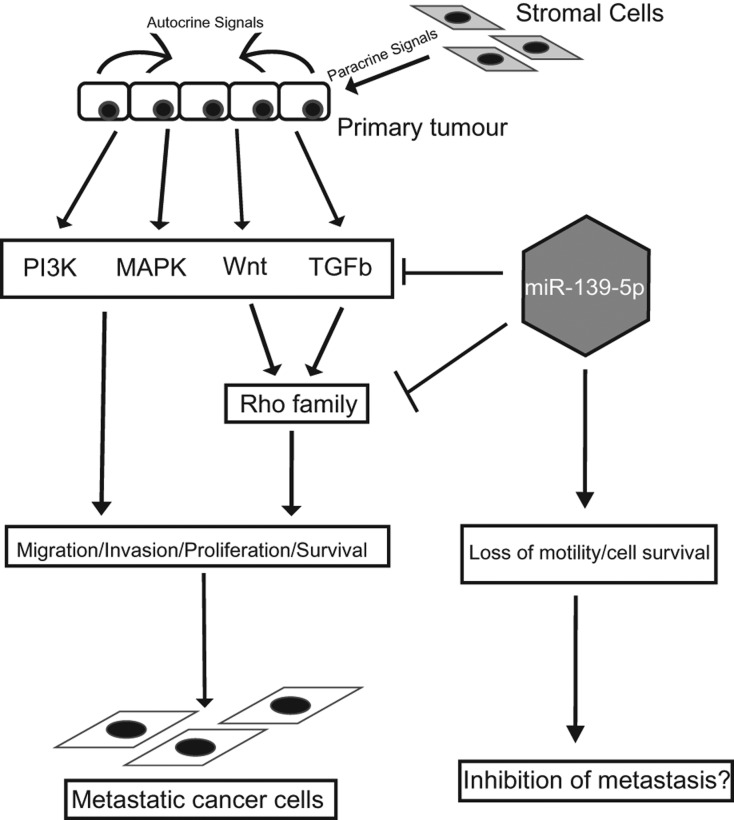
FIGURE 7. Model showing effect of miR-139-5p on tumor progression. Primary tumors, upon receiving autocrine and paracrine signals, respond by downstream activation of key signaling pathways such as TGF-β, Wnt, MAPK, and PI3K that are responsible for promoting their migratory, invasive, proliferative, and anti-apoptotic properties. Combined acquisition of these phenotypes enables the cells to become metastatic and seed distant organs. Shown in the figure is a potential model where miR-139-5p-mediated inhibition of these pathways can abrogate the onset of metastatic traits, potentially making them more susceptible for currently employed chemotherapeutic regimes.
FIGURE 7. Model showing effect of miR-139-5p on tumor progression. Primary tumors, upon receiving autocrine and paracrine signals, respond by downstream activation of key signaling pathways such as TGF-β, Wnt, MAPK, and PI3K that are responsible for promoting their migratory, invasive, proliferative, and anti-apoptotic properties. Combined acquisition of these phenotypes enables the cells to become metastatic and seed distant organs. Shown in the figure is a potential model where miR-139-5p-mediated inhibition of these pathways can abrogate the onset of metastatic traits, potentially making them more susceptible for currently employed chemotherapeutic regimes.CC BY-NC · PubMed Central

Verification

Claims the paper makes

The claims and statistics of this paper haven’t been checked yet.

Run the check — free, no account needed. It reads the open-access text and checks the sources it cites.

A few free checks a day · papers already verified open instantly · results are public

Claims other papers make about this one

Each is checked against this paper’s own text: does it say what the citing paper says it does?

Self-check

Percentages, sums and reported differences re-computed from the paper’s own numbers.

The self-check needs the paper’s full text.

Citations

Cites

Research works printed but not linked: 76

  1. 10.1158/0008-5472.CAN-07-1183 · DOI
  2. 2005, Altered expression of the hormone- and xenobiotic-metabolizing sulfotransferase enzymes 1A2 and 1C1 in malignant breast tissue, Int J Oncol, 26, 1079
  3. 10.1053/j.gastro.2011.08.050 · DOI
  4. 2006, PI3K and RAC signalling in leukocyte and cancer cell migration, Bull Cancer, 93, E44
  5. 1995, Controlling the false discovery rate: A practical and powerful approach to multiple testing, J R Stat Soc Series B (Methodological), 57, 289, 10.1111/j.2517-6161.1995.tb02031.x · DOI · Paper page
  6. 10.1016/j.febslet.2005.09.040 · DOI
  7. 10.1038/nature03096 · DOI
  8. 10.1186/bcr2831 · DOI
  9. 10.1158/1078-0432.CCR-05-0885 · DOI
  10. 10.1196/annals.1386.024 · DOI
  11. 10.1038/sj.onc.1206216 · DOI
  12. 2009, Locally recurrent or metastatic breast cancer: ESMO clinical recommendations for diagnosis, treatment and follow-up, Ann Oncol, 20, 15, 10.1093/annonc/mdp115 · DOI
  13. 10.1016/S0960-9822(00)00475-9 · DOI
  14. 10.1158/1078-0432.CCR-07-1658 · DOI
  15. 2011, Defining MAP3 kinases required for MDA-MB-231 cell tumor growth and metastasis, Oncogene, 31, 3889
  16. 10.1093/bioinformatics/btn224 · DOI
  17. 10.1371/journal.pone.0015940 · DOI
  18. 2012, Derepression of c-Fos caused by microRNA-139 down-regulation contributes to the metastasis of human hepatocellular carcinoma, Cell Biochem Funct, 31, 319
  19. 10.1158/0008-5472.CAN-11-0608 · DOI
  20. 10.1101/gr.130435.111 · DOI
  21. 10.1038/ncb1722 · DOI
  22. 10.1016/j.biocel.2012.05.015 · DOI
  23. 10.1016/j.bbrc.2009.10.135 · DOI
  24. 10.1371/journal.pone.0051056 · DOI
  25. 10.1158/0008-5472.CAN-10-2914 · DOI
  26. 10.1242/jcs.01481 · DOI
  27. 10.1371/journal.pone.0033421 · DOI
  28. 10.1091/mbc.E07-02-0182 · DOI
  29. 10.1016/j.bbrc.2011.10.154 · DOI
  30. 10.1074/jbc.C800074200 · DOI
  31. 10.1038/nm.2401 · DOI
  32. 10.1261/rna.034926.112 · DOI
  33. 10.1093/glycob/cwn071 · DOI · Paper page
  34. 10.3390/ijms140611560 · DOI
  35. 10.1111/cns.12089 · DOI
  36. 10.1093/nar/gkm1075 · DOI
  37. 10.1002/path.4000 · DOI
  38. 10.1038/ncomms2276 · DOI
  39. 1996, Association of tumor cell proliferation with lymph node metastasis in early gastric cancer, Oncology, 53, 1, 10.1159/000227525 · DOI
  40. 10.1186/1476-4598-10-118 · DOI
  41. 10.1136/jcp.2009.073908 · DOI
  42. 10.1093/carcin/bgl129 · DOI
  43. 10.1183/09031936.00084108 · DOI
  44. 10.1074/jbc.M105316200 · DOI
  45. 10.1200/JCO.2011.38.2010 · DOI
  46. 2008, The glucocorticoid receptor signalling in breast cancer, J Cell Mol Med, 12, 145, 10.1111/j.1582-4934.2007.00177.x · DOI
  47. 10.1007/s12013-011-9245-x · DOI
  48. 10.1016/j.cell.2008.01.046 · DOI
  49. 10.1177/106689690000800208 · DOI
  50. 10.3349/ymj.2010.51.6.864 · DOI
  51. 10.1016/j.ejca.2010.02.036 · DOI
  52. 10.1038/sj.bjc.6606062 · DOI
  53. 10.1002/1097-0142(197710)40:4<1365::AID-CNCR2820400402>3.0.CO;2-N · DOI
  54. 10.1038/43474 · DOI · Paper page
  55. 10.1371/journal.pone.0031904 · DOI
  56. 10.1016/j.cell.2011.04.029 · DOI
  57. 10.1038/onc.2011.453 · DOI
  58. 10.1186/bcr1769 · DOI
  59. 10.1101/gad.1760809 · DOI
  60. 10.1242/jcs.122895 · DOI
  61. 10.1016/S0960-9822(99)80310-8 · DOI
  62. 10.1016/j.bcp.2012.04.017 · DOI
  63. 10.1371/journal.pone.0017429 · DOI
  64. 10.1038/onc.2011.275 · DOI
  65. 10.1073/pnas.0511045103 · DOI · Paper page
  66. 10.1016/j.bbrc.2010.04.127 · DOI
  67. 10.1074/jbc.270.30.17656 · DOI
  68. 10.1016/j.cell.2009.03.047 · DOI
  69. 10.1016/j.febslet.2008.04.039 · DOI
  70. 10.1002/iub.1051 · DOI
  71. 10.1053/j.gastro.2010.10.006 · DOI
  72. 10.1186/gb-2002-3-9-research0048 · DOI
  73. 10.1158/2159-8290.CD-11-0270 · DOI
  74. 10.1093/annonc/mdp245 · DOI
  75. 10.1038/sj.onc.1208927 · DOI
  76. 10.1038/cr.2008.24 · DOI · Paper page

Cited by

Sorted by citations

See all 134

Metadata

Authors
Krishnan, K., Steptoe, A. L., Martin, H. C., Pattabiraman, D. R., Nones, K., Waddell, N., Mariasegaram, M., Simpson, P. T., Lakhani, S. R., Vlassov, A., Grimmond, S. M., & Cloonan, N.
Venue
RNA
Published
2013-10-24
Volume
19
Issue
12
Pages
1767-1780
ISSN
  • 1355-8382
  • 1469-9001
Cited by
134
References
10
Language
en

About these checks

Registry, retraction, Cites and statistics results are computed, not judged, with one exception: a printed reference that no index lists is read once by a model before it counts as a citation error. Claims are extracted by a model and kept only when their quote appears verbatim in the text; each cited source is then checked, with a model’s help, for whether it says what the claim relies on. Those verdicts can be wrong — read the claim’s quote and the cited source before relying on one.

Statistics and arithmetic are recomputed, not judged.

Confidence bands are shown only for fields calibrated on our annotated test set. None is calibrated yet, so no band is shown.

What counts as a claim ›How we measure confidence ›How we check this ›

Are you an author, or do you see a problem with this page? Request a review