Student or educator? Sign up with your school email and get 6 months of Pro free.
Cited by 364

The DOI matches its Crossref record; 52 of the 52 references it cites were found in a registry or an index.

Incomplete and Inaccurate Vocal Imitation after Knockdown of FoxP2 in Songbird Basal Ganglia Nucleus Area X

Haesler, Sebastian, Rochefort, Christelle, Georgi, Benjamin, Licznerski, Pawel, Osten, Pavel, Scharff, Constance·2007·PLoS Biology

Abstract

The gene encoding the forkhead box transcription factor, FOXP2, is essential for developing the full articulatory power of human language. Mutations of FOXP2 cause developmental verbal dyspraxia (DVD), a speech and language disorder that compromises the fluent production of words and the correct use and comprehension of grammar. FOXP2 patients have structural and functional abnormalities in the striatum of the basal ganglia, which also express high levels of FOXP2. Since human speech and learned vocalizations in songbirds bear behavioral and neural parallels, songbirds provide a genuine model for investigating the basic principles of speech and its pathologies. In zebra finch Area X, a basal ganglia structure necessary for song learning, FoxP2 expression increases during the time when song learning occurs. Here, we used lentivirus-mediated RNA interference (RNAi) to reduce FoxP2 levels in Area X during song development. Knockdown of FoxP2 resulted in an incomplete and inaccurate imitation of tutor song. Inaccurate vocal imitation was already evident early during song ontogeny and persisted into adulthood. The acoustic structure and the duration of adult song syllables were abnormally variable, similar to word production in children with DVD. Our findings provide the first example of a functional gene analysis in songbirds and suggest that normal auditory-guided vocal motor learning requires FoxP2.

Overview

The claims and statistics of this paper haven’t been checked yet.

Run the check — free, no account needed. It reads the open-access text and checks the sources it cites.

A few free checks a day · papers already verified open instantly · results are public

Integrity signals

Registry

Crossref · 10.1371/journal.pbio.0050321

Cites

52 of 52 references verified0 citation errors · 0 not checkable

Statistics

Figures

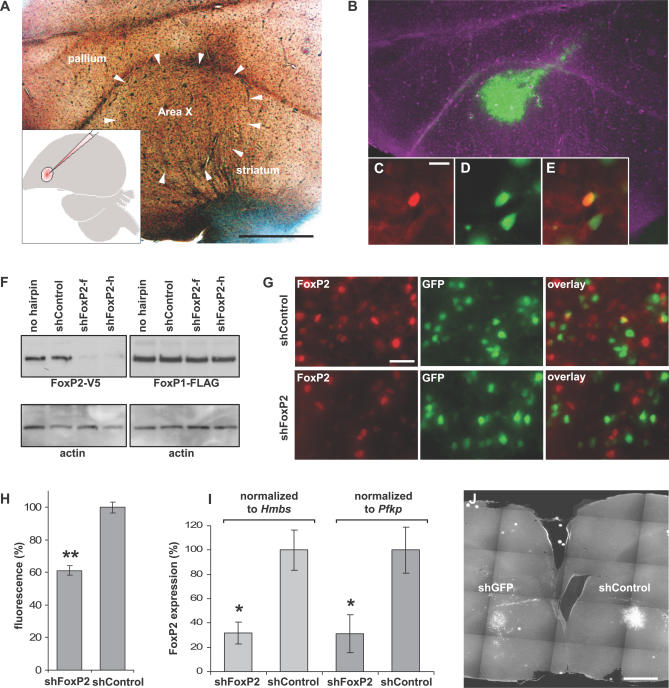
Figure 1 Establishing Lentivirus-Mediated Knockdown of FoxP2 in Zebra Finch Area X (A) Phase contrast image of a sagittal 50-μm brain section from a male zebra finch. Area X is outlined by white arrows (scale bar indicates 1 mm). The microinjection into Area X is schematized in the inset. (B) Fluorescent microscopy image of (A). Virus-infected cells expressed GFP (green). (C) FoxP2 immunostaining (red; scale bar indicates 10 μm) (D) The neuron shown in (C) also expressed viral GFP from injection with the nontargeting shControl virus. (E) Overlay picture of (C) and (D). (F) Overexpression of zebra finch FoxP2 (left panel) or FoxP1 (right panel), each tagged with the V5 epitope, and one of different hairpin constructs (shFoxP2-f, shFoxP2-h, or shControl) in HEK293 T cells. Western blot analysis using a V5 antibody revealed that shFoxP2-f and shFoxP2-h, but not shControl, efficiently reduced FoxP2 levels. FoxP1 protein levels were unaffected by overexpression of either shRNA. Immunostaining with an actin antibody shows comparable loading of protein samples. (G) Knockdown of FoxP2 in vivo. Immunofluorescent staining with an antibody against FoxP2 on 50-μm brain sections from birds injected with shFoxP2-f/-h in one hemisphere and shControl in the contralateral hemisphere 30 d prior to analysis revealed lower fluorescence levels and fewer cells in knockdown (upper panel) compared to control sections (lower panel). FoxP2-positive cells appear red; virally infected cells express GFP, visible in green (scale bar indicates 20 μm). (H) Quantification of in vivo knockdown efficiency. The fluorescence intensity of FoxP2 immunostaining was measured in images from brain sections injected with shFoxP2-f/-h in one hemisphere and shControl in the contralateral hemisphere 30 d prior to analysis. All antibody incubations were performed simultaneously, and pictures were taken with identical camera settings. Bars represent average intensity levels normalized to the shControl-injected hemisphere (± standard error of the mean [SEM]; two-tailed Mann-Whitney U test, **p < 0.003; n = 4 animals [2 images per hemisphere]). (I) Real-time PCR quantification of FoxP2 mRNA expression in Area X on PHD50. Animals were injected with shControl in one hemisphere and shFoxP2 virus in the contralateral hemisphere, on PHD23. Bars represent relative gene expression between shControl- and shFoxP2-injected hemispheres, normalized to either Hmbs or Pfkp as indicated (±STDEV; two-tailed Mann-Whitney U test, *p < 0.008; n = 5 animals). (J) RNAi-mediated knockdown persisted for at least 3 mo. Frontal 50-μm brain slice of zebra finch injected with the indicated virus 105 d prior to perfusion. The intensity of GFP expression, visible as white signal, was lower in the left hemisphere injected with the virus targeting GFP, compared to the hemisphere that was injected with shControl (scale bar indicates 1 mm).
Figure 1 Establishing Lentivirus-Mediated Knockdown of FoxP2 in Zebra Finch Area X (A) Phase contrast image of a sagittal 50-μm brain section from a male zebra finch. Area X is outlined by white arrows (scale bar indicates 1 mm). The microinjection into Area X is schematized in the inset. (B) Fluorescent microscopy image of (A). Virus-infected cells expressed GFP (green). (C) FoxP2 immunostaining (red; scale bar indicates 10 μm) (D) The neuron shown in (C) also expressed viral GFP from injection with the nontargeting shControl virus. (E) Overlay picture of (C) and (D). (F) Overexpression of zebra finch FoxP2 (left panel) or FoxP1 (right panel), each tagged with the V5 epitope, and one of different hairpin constructs (shFoxP2-f, shFoxP2-h, or shControl) in HEK293 T cells. Western blot analysis using a V5 antibody revealed that shFoxP2-f and shFoxP2-h, but not shControl, efficiently reduced FoxP2 levels. FoxP1 protein levels were unaffected by overexpression of either shRNA. Immunostaining with an actin antibody shows comparable loading of protein samples. (G) Knockdown of FoxP2 in vivo. Immunofluorescent staining with an antibody against FoxP2 on 50-μm brain sections from birds injected with shFoxP2-f/-h in one hemisphere and shControl in the contralateral hemisphere 30 d prior to analysis revealed lower fluorescence levels and fewer cells in knockdown (upper panel) compared to control sections (lower panel). FoxP2-positive cells appear red; virally infected cells express GFP, visible in green (scale bar indicates 20 μm). (H) Quantification of in vivo knockdown efficiency. The fluorescence intensity of FoxP2 immunostaining was measured in images from brain sections injected with shFoxP2-f/-h in one hemisphere and shControl in the contralateral hemisphere 30 d prior to analysis. All antibody incubations were performed simultaneously, and pictures were taken with identical camera settings. Bars represent average intensity levels normalized to the shControl-injected hemisphere (± standard error of the mean [SEM]; two-tailed Mann-Whitney U test, **p < 0.003; n = 4 animals [2 images per hemisphere]). (I) Real-time PCR quantification of FoxP2 mRNA expression in Area X on PHD50. Animals were injected with shControl in one hemisphere and shFoxP2 virus in the contralateral hemisphere, on PHD23. Bars represent relative gene expression between shControl- and shFoxP2-injected hemispheres, normalized to either Hmbs or Pfkp as indicated (±STDEV; two-tailed Mann-Whitney U test, *p < 0.008; n = 5 animals). (J) RNAi-mediated knockdown persisted for at least 3 mo. Frontal 50-μm brain slice of zebra finch injected with the indicated virus 105 d prior to perfusion. The intensity of GFP expression, visible as white signal, was lower in the left hemisphere injected with the virus targeting GFP, compared to the hemisphere that was injected with shControl (scale bar indicates 1 mm).CC BY · PubMed Central
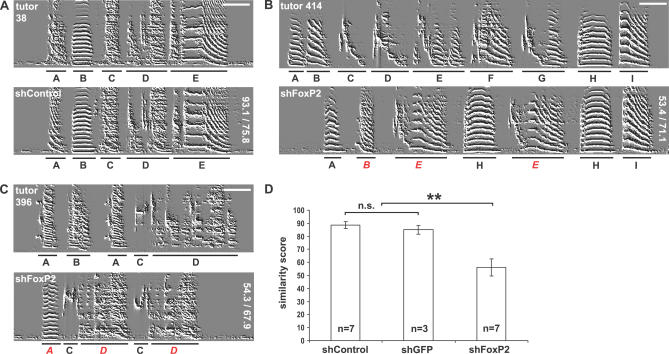
Figure 2 Incomplete Tutor Song Imitation by FoxP2 Knockdown Pupils Each sonogram depicts a typical motif of one animal (scale bars indicate 100 ms, frequency range 0–8,600 Hz). Tutor syllables are underlined with black bars and identified by letters. The identity of pupil syllables was determined by similarity comparison to tutor syllables using SAP software. Imprecisely copied pupil syllables are designated with red italic letters. (A–C) (A) tutor #38 and shControl-injected pupil, (B) tutor #396 and shFoxP2-injected pupil, and (C) tutor #414 and shFoxP2-injected pupil. ShFoxP2-injected pupils copied fewer syllables and the fidelity of syllable imitation was worse than in shControl pupils, reflected by lower SAP scores (similarity/accuracy indicated vertically at the right edge of the sonograms). (D) The mean similarity scores between tutor and pupil motifs were significantly lower in shFoxP2- injected pupils than in shControl- and shGFP-injected pupils (± SEM; two-tailed Mann-Whitney U test, **p < 0.001, Bonferroni-corrected α-level). There was no significant difference between shGFP- and shControl-injected animals (not significant [n.s.], p > 0.5).
Figure 2 Incomplete Tutor Song Imitation by FoxP2 Knockdown Pupils Each sonogram depicts a typical motif of one animal (scale bars indicate 100 ms, frequency range 0–8,600 Hz). Tutor syllables are underlined with black bars and identified by letters. The identity of pupil syllables was determined by similarity comparison to tutor syllables using SAP software. Imprecisely copied pupil syllables are designated with red italic letters. (A–C) (A) tutor #38 and shControl-injected pupil, (B) tutor #396 and shFoxP2-injected pupil, and (C) tutor #414 and shFoxP2-injected pupil. ShFoxP2-injected pupils copied fewer syllables and the fidelity of syllable imitation was worse than in shControl pupils, reflected by lower SAP scores (similarity/accuracy indicated vertically at the right edge of the sonograms). (D) The mean similarity scores between tutor and pupil motifs were significantly lower in shFoxP2- injected pupils than in shControl- and shGFP-injected pupils (± SEM; two-tailed Mann-Whitney U test, **p < 0.001, Bonferroni-corrected α-level). There was no significant difference between shGFP- and shControl-injected animals (not significant [n.s.], p > 0.5).CC BY · PubMed Central
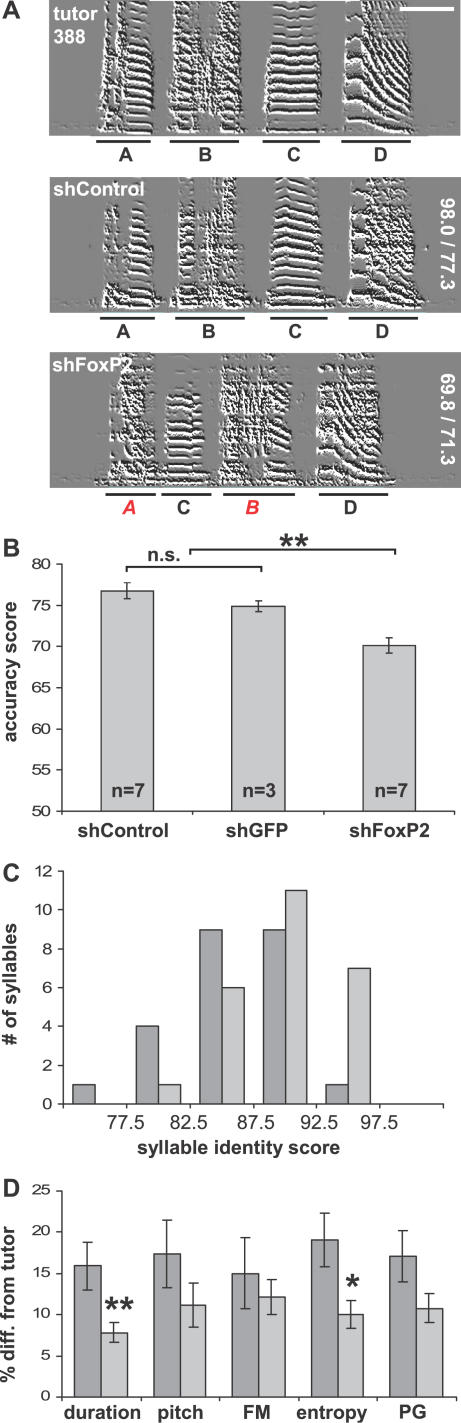
Figure 3 Inaccurate Tutor Song Imitation by FoxP2 Knockdown Pupils (A) Representative sonograms of FoxP2 knockdown and control pupils both tutored by male 388 (scale bars indicate 100 ms, frequency range = 0–8,600 Hz). Syllables are underlined with black bars and identified by letters. The identity of pupil syllables was determined by similarity comparison to tutor syllables using SAP software. Red italic letters denote imprecisely copied syllables. Inaccurate imitation is particularly evident in the second element of syllable A and the first element of syllable B. Similarity and accuracy scores are indicated vertically at the right edge of the sonograms. (B) Average motif accuracy was significantly lower in shFoxP2 knockdown pupils compared to control pupils, indicating that they imitated their tutors less precisely (±SEM; two-tailed Mann-Whitney U test, **p < 0.001, Bonferroni-corrected α-level). shControl- and shGFP-injected pupils copied their tutors with similar precision (n.s., p > 0.4). (C) The frequency distribution of identity scores of all syllables from FoxP2 knockdown pupils (dark grey bars)was shifted towards lower scores, compared to control pupils (light grey bars).. This suggests that all syllable types were affected. (Identity scores were obtained from comparison of pupil/tutor syllable pairs; shFoxP2 n = 24 syllables from 7 animals; shControl n = 26 syllables from 7 animals). (D) Comparison of syllable duration and mean acoustic feature values (FM and PG) between pupil syllables and their respective tutor syllables. The divergence of imitated syllables from the tutor model tended to be larger for all acoustic measures in the FoxP2 knockdown pupils (dark grey bars) than in the controls (light grey bars). For average syllable duration and mean entropy measures, the difference was significant (±SEM; two-tailed Mann-Whitney U test, **p < 0.001 for duration and *p < 0.05 for entropy; Bonferroni-corrected α-level; shFoxP2 n = 7 animals, on average 3 syllables per animal; shControl n = 7 animals, on average 4 syllables per animal).
Figure 3 Inaccurate Tutor Song Imitation by FoxP2 Knockdown Pupils (A) Representative sonograms of FoxP2 knockdown and control pupils both tutored by male 388 (scale bars indicate 100 ms, frequency range = 0–8,600 Hz). Syllables are underlined with black bars and identified by letters. The identity of pupil syllables was determined by similarity comparison to tutor syllables using SAP software. Red italic letters denote imprecisely copied syllables. Inaccurate imitation is particularly evident in the second element of syllable A and the first element of syllable B. Similarity and accuracy scores are indicated vertically at the right edge of the sonograms. (B) Average motif accuracy was significantly lower in shFoxP2 knockdown pupils compared to control pupils, indicating that they imitated their tutors less precisely (±SEM; two-tailed Mann-Whitney U test, **p < 0.001, Bonferroni-corrected α-level). shControl- and shGFP-injected pupils copied their tutors with similar precision (n.s., p > 0.4). (C) The frequency distribution of identity scores of all syllables from FoxP2 knockdown pupils (dark grey bars)was shifted towards lower scores, compared to control pupils (light grey bars).. This suggests that all syllable types were affected. (Identity scores were obtained from comparison of pupil/tutor syllable pairs; shFoxP2 n = 24 syllables from 7 animals; shControl n = 26 syllables from 7 animals). (D) Comparison of syllable duration and mean acoustic feature values (FM and PG) between pupil syllables and their respective tutor syllables. The divergence of imitated syllables from the tutor model tended to be larger for all acoustic measures in the FoxP2 knockdown pupils (dark grey bars) than in the controls (light grey bars). For average syllable duration and mean entropy measures, the difference was significant (±SEM; two-tailed Mann-Whitney U test, **p < 0.001 for duration and *p < 0.05 for entropy; Bonferroni-corrected α-level; shFoxP2 n = 7 animals, on average 3 syllables per animal; shControl n = 7 animals, on average 4 syllables per animal).CC BY · PubMed Central
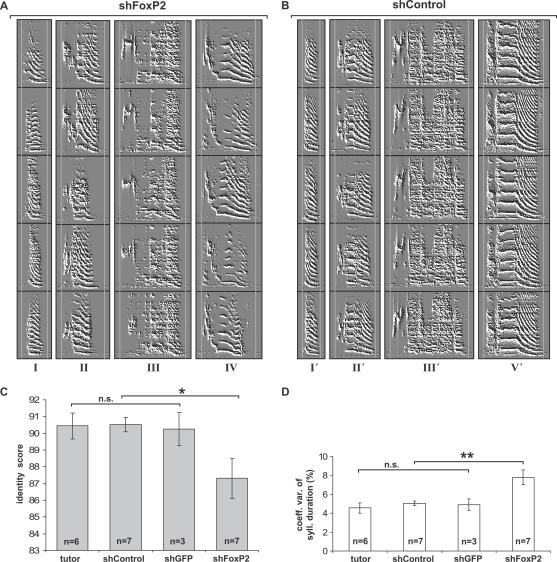
Figure 4 Variability of Syllable Production in FoxP2 Knockdown Pupils Each vertical column shows the sonograms of five different renditions of the same syllable (scale bar indicates 100 ms, frequency range = 0–8,600 Hz). Each syllable, labeled by a roman numeral, was selected from a different bird. Of note, the first three syllables in (A) (syllables I, II, and III) were imitated from the same tutor as the corresponding syllables in (B) (syllables I′, II′, and III′). (A) FoxP2 knockdown pupils. Two vertical lines mark the beginning and the end of the longest rendition of each syllable to visualize variability of syllable duration (particularly evident in syllables II and IV). Also note the variability in acoustic structure between different renditions of the same syllable (e.g., FM of syllable I, shape and frequency of first element of syllable III, and PG of last element of syllable IV). (B) Syllable duration is relatively invariant in control pupils, as indicated by the vertical lines marking the beginning and the end of each syllable. Acoustic structure is also stable across syllable renditions. (C) Acoustic variability of syllables from rendition to rendition was higher in shFoxP2-injected than in control pupils (shGFP and shControl injections), as indicated by significantly lower syllable identify scores (two-tailed Mann-Whitney U test, *p < 0.05; Bonferroni-corrected α-level). Control and tutor birds sang with comparable variability (two-tailed Mann-Whitney U test, p > 0.8; tutors n = 6, on average 5 syllables per animal; shControl n = 7 animals, on average 4 syllables per animal; shGFP n = 3, on average 5 syllables per animal). (D) Syllable duration varied more from rendition to rendition in knockdown pupils (shFoxP2) than in controls (shControl and shGFP) and tutors, as indicated by a higher mean coefficient of variation of syllable duration (±SEM, two-tailed Mann-Whitney U test, **p < 0.001; Bonferroni-corrected α-level; no difference between tutors, shControl-injected, and shGFP-injected animals, p > 0.7, same animals as [C]).
Figure 4 Variability of Syllable Production in FoxP2 Knockdown Pupils Each vertical column shows the sonograms of five different renditions of the same syllable (scale bar indicates 100 ms, frequency range = 0–8,600 Hz). Each syllable, labeled by a roman numeral, was selected from a different bird. Of note, the first three syllables in (A) (syllables I, II, and III) were imitated from the same tutor as the corresponding syllables in (B) (syllables I′, II′, and III′). (A) FoxP2 knockdown pupils. Two vertical lines mark the beginning and the end of the longest rendition of each syllable to visualize variability of syllable duration (particularly evident in syllables II and IV). Also note the variability in acoustic structure between different renditions of the same syllable (e.g., FM of syllable I, shape and frequency of first element of syllable III, and PG of last element of syllable IV). (B) Syllable duration is relatively invariant in control pupils, as indicated by the vertical lines marking the beginning and the end of each syllable. Acoustic structure is also stable across syllable renditions. (C) Acoustic variability of syllables from rendition to rendition was higher in shFoxP2-injected than in control pupils (shGFP and shControl injections), as indicated by significantly lower syllable identify scores (two-tailed Mann-Whitney U test, *p < 0.05; Bonferroni-corrected α-level). Control and tutor birds sang with comparable variability (two-tailed Mann-Whitney U test, p > 0.8; tutors n = 6, on average 5 syllables per animal; shControl n = 7 animals, on average 4 syllables per animal; shGFP n = 3, on average 5 syllables per animal). (D) Syllable duration varied more from rendition to rendition in knockdown pupils (shFoxP2) than in controls (shControl and shGFP) and tutors, as indicated by a higher mean coefficient of variation of syllable duration (±SEM, two-tailed Mann-Whitney U test, **p < 0.001; Bonferroni-corrected α-level; no difference between tutors, shControl-injected, and shGFP-injected animals, p > 0.7, same animals as [C]).CC BY · PubMed Central
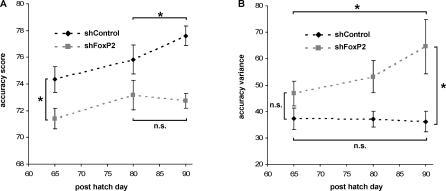
Figure 5 Differences in Song Development of FoxP2 Knockdown and Control Pupils (A) We measured the accuracy of syllable imitation in song recordings of the same pupils made at three different ages (PHD65, PHD80, and PHD90), using the automated batch procedure in Sound Analysis Pro. Data points represent mean values (±SEM) of 1,000–3,000 pairwise comparisons between pupil recordings and the tutor model (shFoxP2-f/-h, n = 7 animals for all ages; shControl, n = 5 animals for PHD65, n = 6 animals for PHD80, and n = 7 animals for PHD90). Syllable imitation was already less accurate in FoxP2 knockdown pupils by 65PHD (two-tailed Mann-Whitney U test, PHD65 *p < 0.05), and does not continue to improve beyond 80 d, in contrast to control pupils (two-tailed Wilcoxon signed-rank test, PHD80 to PHD90 *p < 0.05 in shControl, n.s. in shFoxP2-f/-h, p > 0.5). The dashed line connecting the data points illustrates the directionality of changes over time. but does not imply a linear relationship. (B) Variance of syllable accuracy values increased with age in knockdown pupils, but not in controls (two-tailed Wilcoxon signed-rank test, PHD65 to PHD90 *p < 0.05 in shFoxP2-f/-h, n.s. in shControl, *p > 0.4). This leads to significantly higher variance at PH90 in knockdown pupils compared to control pupils (two-tailed Mann-Whitney U test, PHD90 *p < 0.05). Dashed lines as in (A).
Figure 5 Differences in Song Development of FoxP2 Knockdown and Control Pupils (A) We measured the accuracy of syllable imitation in song recordings of the same pupils made at three different ages (PHD65, PHD80, and PHD90), using the automated batch procedure in Sound Analysis Pro. Data points represent mean values (±SEM) of 1,000–3,000 pairwise comparisons between pupil recordings and the tutor model (shFoxP2-f/-h, n = 7 animals for all ages; shControl, n = 5 animals for PHD65, n = 6 animals for PHD80, and n = 7 animals for PHD90). Syllable imitation was already less accurate in FoxP2 knockdown pupils by 65PHD (two-tailed Mann-Whitney U test, PHD65 *p < 0.05), and does not continue to improve beyond 80 d, in contrast to control pupils (two-tailed Wilcoxon signed-rank test, PHD80 to PHD90 *p < 0.05 in shControl, n.s. in shFoxP2-f/-h, p > 0.5). The dashed line connecting the data points illustrates the directionality of changes over time. but does not imply a linear relationship. (B) Variance of syllable accuracy values increased with age in knockdown pupils, but not in controls (two-tailed Wilcoxon signed-rank test, PHD65 to PHD90 *p < 0.05 in shFoxP2-f/-h, n.s. in shControl, *p > 0.4). This leads to significantly higher variance at PH90 in knockdown pupils compared to control pupils (two-tailed Mann-Whitney U test, PHD90 *p < 0.05). Dashed lines as in (A).CC BY · PubMed Central

Verification

Claims the paper makes

The claims and statistics of this paper haven’t been checked yet.

Run the check — free, no account needed. It reads the open-access text and checks the sources it cites.

A few free checks a day · papers already verified open instantly · results are public

Claims other papers make about this one

Each is checked against this paper’s own text: does it say what the citing paper says it does?

Self-check

Percentages, sums and reported differences re-computed from the paper’s own numbers.

The self-check needs the paper’s full text.

Citations

Cites

Show all 52 references

Research works printed but not linked: 52

  1. Lai, 2001, Nature, 413, 519
  2. MacDermot, 2005, Am J Hum Genet, 76, 1074
  3. Feuk, 2006, Am J Hum Genet, 79, 965
  4. Fisher, 2006, Nat Rev Genet, 7, 9
  5. Watkins, 2002, Brain, 125, 452
  6. Belton, 2003, Hum Brain Mapp, 18, 194
  7. Liegeois, 2003, Nat Neurosci, 6, 1230
  8. Lai, 2003, Brain, 126, 2455
  9. Doupe, 1999, Annu Rev Neurosci, 22, 567
  10. Haesler, 2004, J Neurosci, 24, 3164
  11. Teramitsu, 2004, J Neurosci, 24, 3152
  12. Sohrabji, 1990, Behav Neural Biol, 53, 51
  13. Scharff, 1991, J Neurosci, 11, 2896
  14. Teramitsu, 2006, J Neurosci, 26, 7390
  15. Shriberg, 2006, J Speech Lang Hear Res, 49, 500
  16. Roper, 2005, Ethology, 112, 458
  17. Lois, 2002, Science, 295, 868
  18. Barami, 1995, J Neurobiol, 28, 82
  19. Wada, 2006, Proc Natl Acad Sci U S A, 103, 15212
  20. Farries, 2002, J Neurosci, 22, 3776
  21. Scharff, 2005, Curr Opin Neurobiol, 15, 694
  22. Tchernichovski, 2001, Science, 291, 2564
  23. Tchernichovski, 1998, Proc Natl Acad Sci U S A, 95, 8951
  24. Ashraf, 2006, Cell, 124, 191
  25. Doupe, 2005, Trends Neurosci, 28, 353
  26. Olveczky, 2005, PLoS Biol, 3
  27. Kao, 2005, Nature, 433, 638
  28. Brainard, 2000, Nature, 404, 762
  29. Williams, 1999, J Neurobiol, 39, 14
  30. Glaze, 2006, J Neurosci, 26, 991
  31. Williams, 2004, Ann N Y Acad Sci, 1016, 1
  32. Rumpel, 2005, Science, 308, 83
  33. Graybiel, 2005, Curr Opin Neurobiol, 15, 638
  34. Singh, 2005, J Neurobiol, 65, 179
  35. Leonardo, 1999, Nature, 399, 466
  36. Price, 1979, J Comp Physiol Psychol, 93, 260
  37. Farries, 2005, J Comp Neurol, 484, 93
  38. Rosen, 2006, J Neurophysiol, 95, 1158
  39. Kozhevnikov, 2007, J Neurophysiol, 97, 4271
  40. Reiner, 2004, J Comp Neurol, 469, 239
  41. Bayer, 2005, Neuron, 47, 129
  42. Ogar, 2005, Neurocase, 11, 427
  43. Vargha-Khadem, 2005, Nat Rev Neurosci, 6, 131
  44. Nicolson, 2007, Trends Neurosci, 30, 135
  45. Tomaszycki, 2005, Anim Behav, 70, 785
  46. Spencer, 2005, Behav Ecol Sociobiol, 58, 423
  47. Kaestner, 2000, Genes Dev, 14, 142
  48. Pei, 2006, Nat Methods, 3, 670
  49. Griffiths, 1998, Mol Ecol, 7, 1071
  50. Floody, 1997, Horm Behav, 31, 25
  51. Tchernichovski, 2000, Anim Behav, 59, 1167
  52. Shannon, 1948, Bell Syst Tech J, 27

Cited by

See all 364

Metadata

Authors
Haesler, S., Rochefort, C., Georgi, B., Licznerski, P., Osten, P., & Scharff, C.
Venue
PLoS Biology
Published
2007-12-04
Volume
5
Issue
12
Pages
e321
ISSN
1545-7885
Cited by
364
References
52
Language
en

About these checks

Registry, retraction, Cites and statistics results are computed, not judged, with one exception: a printed reference that no index lists is read once by a model before it counts as a citation error. Claims are extracted by a model and kept only when their quote appears verbatim in the text; each cited source is then checked, with a model’s help, for whether it says what the claim relies on. Those verdicts can be wrong — read the claim’s quote and the cited source before relying on one.

Statistics and arithmetic are recomputed, not judged.

Confidence bands are shown only for fields calibrated on our annotated test set. None is calibrated yet, so no band is shown.

What counts as a claim ›How we measure confidence ›How we check this ›

Are you an author, or do you see a problem with this page? Request a review

How to cite

Cite CoChat for the checks on this page, and the paper for its own findings.

This page
CoChat. (2026). Citation check: Incomplete and Inaccurate Vocal Imitation after Knockdown of FoxP2 in Songbird Basal Ganglia Nucleus Area X. https://app.cochat.ai/papers/10.1371/journal.pbio.0050321
The paper
Haesler, S., Rochefort, C., Georgi, B., Licznerski, P., Osten, P., & Scharff, C. (2007). Incomplete and Inaccurate Vocal Imitation after Knockdown of FoxP2 in Songbird Basal Ganglia Nucleus Area X. PLoS Biology. https://doi.org/10.1371/journal.pbio.0050321

Data sources

Bibliographic data: Semantic Scholar, OpenAlex, Crossref.

Contains information from the Semantic Scholar Academic Graph Datasets, made available under the ODC Attribution License (ODC-BY 1.0).

Semantic Scholar’s data is described in: Kinney, R., et al. (2023). The Semantic Scholar Open Data Platform. arXiv:2301.10140.