

Resolving Difficult Phylogenetic Questions: Why More Sequences Are Not Enough
Open accessThe DOI matches its Crossref record; 84 of the 84 references it cites were found in a registry or an index.
Abstract
The Perspective section provides experts with a forum
Overview
The claims and statistics of this paper haven’t been checked yet.
Free: it reads the open-access text and checks the first 5 claims that cite a source we can check. Create a free account to check every claim.
Integrity signals
Registry
Cites
Statistics
Figures



Verification
Claims the paper makes
The claims and statistics of this paper haven’t been checked yet.
Free: it reads the open-access text and checks the first 5 claims that cite a source we can check. Create a free account to check every claim.
Claims other papers make about this one
Each is checked against this paper’s own text: does it say what the citing paper says it does?
The cited source doesn’t support the claim as written.
In the citing paper
“The argument for LBA (7-10) or saturated datasets (7, 8) as the reason past studies found ctenophores to be sister to all other animals seems to have been overstated.”
From Error, signal, and the placement of Ctenophora sister to all other animals (2015) · cites this paper as [8]
Checked by a reasoning model — may be wrong.
Experimental — accuracy not yet measuredThe source backs part of the claim, not all of it — or backs it for a different population, condition or comparison.
In the citing paper
“A key aspect of the debate is that support for both hypotheses is generally recovered from the same dataset when different substitution models and/or taxon- and gene-sampling strategies are used (contrast [6, 10] and [42, 45], and see [7, 43, 47]).”
From Improved Modeling of Compositional Heterogeneity Supports Sponges as Sister to All Other Animals (2017) · cites this paper as [43]
Experimental — accuracy not yet measuredThe source backs part of the claim, not all of it — or backs it for a different population, condition or comparison.
In the citing paper
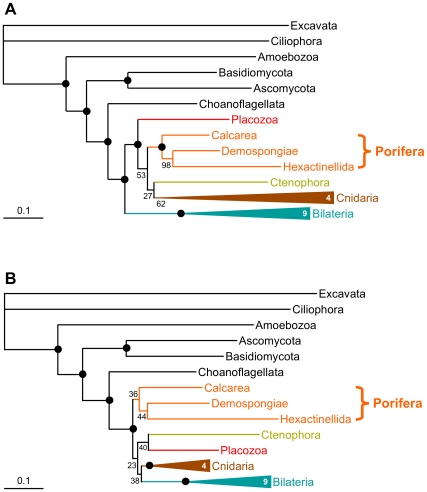
“Inferred relationships among major sponge lineages (i.e., Demospongiae + Hexactinellida sister to Calcarea + Homoscleromorpha) were consistent with morphology (27,28) and most other molecular analyses that have recovered monophyletic sponges (datasets 1-27 in Figs. 2 and 3 and Figs.S1-S5) (4, 5, 8, 9, 28-30).”
From Error, signal, and the placement of Ctenophora sister to all other animals (2015) · cites this paper as [8]
Experimental — accuracy not yet measuredThe source backs part of the claim, not all of it — or backs it for a different population, condition or comparison.
In the citing paper
“Our robust support of sponge monophyly agrees with morphology (35) and most other large molecular datasets (5,6,(8)(9)(10).”
From Error, signal, and the placement of Ctenophora sister to all other animals (2015) · cites this paper as [8]
Experimental — accuracy not yet measuredThe cited source says what the claim attributes to it.
In the citing paper
“Ctenophores have a high rate of molecular evolution, making them a priori difficult to place due to their potential for long branch attraction (LBA) artifacts [12].”
From A Large and Consistent Phylogenomic Dataset Supports Sponges as the Sister Group to All Other Animals (2017) · cites this paper as [12]
6 more claims about this paper
Create a free account to see every claim other papers make about this one.
Self-check
Percentages, sums and reported differences re-computed from the paper’s own numbers.
The self-check needs the paper’s full text.
Citations
Cites
Evolutionary trees from DNA sequences: A maximum likelihood approach.
Felsenstein, J. (1981) · Journal of Molecular Evolution · doi:10.1007/bf01734359 · Cited by 14,571 · cited 1×
“Briefly, major steps forward were the modeling of heterogeneity of rate across species [63], heterogeneity of rate across substitutions [64,65], heterogeneity of nucleotide/ amino acid composition across species [66,67], heterogeneity of rate across sites [68], and heterogeneity of the substitution process across site…”
BackgroundEvolution of Protein Molecules
JUKES, T. H., & CANTOR, C. R. (1969) · Mammalian Protein Metabolism · doi:10.1016/b978-1-4832-3211-9.50009-7 · Cited by 11,032
Selection of Conserved Blocks from Multiple Alignments for Their Use in Phylogenetic Analysis
Castresana, J. (2000) · Molecular Biology and Evolution · doi:10.1093/oxfordjournals.molbev.a026334 · Cited by 10,508
OrthoMCL: Identification of Ortholog Groups for Eukaryotic Genomes
Li, L., Stoeckert, C. J., & Roos, D. S. (2003) · Genome Research · doi:10.1101/gr.1224503 · Cited by 5,707 · cited 2×
“Despite the great progress in software development [19–22,52–54], our nine years of experience with large-scale multigene analyses [55] leads us to conclude that computer-assisted manual expertise is not yet dispensable.”
BackgroundMethodAtlas of protein sequence and structure
Chang, M.-Y., Dayhoff, M. O., Eck, R. V., & Sochard, M. R. (1965) · NASA Technical Reports Server (NASA) · Cited by 4,383
(1964) · Mammalian Protein Metabolism · doi:10.1016/b978-1-4832-3210-2.50006-6 · Cited by 3,059
Wooding, S. (2004) · The American Journal of Human Genetics · doi:10.1086/383584 · Cited by 3,032
Cases in which Parsimony or Compatibility Methods will be Positively Misleading
Felsenstein, J. (1978) · Systematic Biology · doi:10.1093/sysbio/27.4.401 · Cited by 2,896
Whelan, S., & Goldman, N. (2001) · Molecular Biology and Evolution · doi:10.1093/oxfordjournals.molbev.a003851 · Cited by 2,849 · cited 1×
“, the sitehomogeneous WAG+F+C model [44] used in [4] instead of the site-heterogeneous CAT+C model [45] used in the original study [3] (Figure 4A).”
MethodCases in which parsimony or compatibility methods will be positively misleading.
Felsenstein, J. (1978) · Systematic Zoology · doi:10.2307/2412923 · Cited by 2,230
Gene tree discordance, phylogenetic inference and the multispecies coalescent
Degnan, J. H., & Rosenberg, N. A. (2009) · Trends in Ecology & Evolution · doi:10.1016/j.tree.2009.01.009 · Cited by 1,958
Broad phylogenomic sampling improves resolution of the animal tree of life
Dunn, C. W., Hejnol, A., Matus, D. Q., Pang, K., Browne, W. E., Smith, S. A., Seaver, E., Rouse, G. W., Obst, M., Edgecombe, G. D., et al. (2008) · Nature · doi:10.1038/nature06614 · Cited by 1,921 · cited 10×
“[2]; in that case, the fast-evolving ctenophores are likely attracted by the distant outgroup (see Text S1).”
BackgroundInfluentialThe COG database: new developments in phylogenetic classification of proteins from complete genomes
Tatusov, R. L. (2001) · Nucleic Acids Research · doi:10.1093/nar/29.1.22 · Cited by 1,895
Graph Clustering by Flow Simulation
van Dongen, S. M. (2000) · Centrum Wiskunde & Informatica (CWI), the national research institute for mathematics and computer science in the Netherlands · Cited by 1,595
A Bayesian Mixture Model for Across-Site Heterogeneities in the Amino-Acid Replacement Process
Lartillot, N., & Philippe, H. (2004) · Molecular Biology and Evolution · doi:10.1093/molbev/msh112 · Cited by 1,516
Self-citationRAxML-III: a fast program for maximum likelihood-based inference of large phylogenetic trees
Stamatakis, A., Ludwig, T., & Meier, H. (2005) · Bioinformatics · doi:10.1093/bioinformatics/bti191 · Cited by 1,438
A new method for calculating evolutionary substitution rates
Lanave, C., Preparata, G., Sacone, C., & Serio, G. (1984) · Journal of Molecular Evolution · doi:10.1007/bf02101990 · Cited by 1,415
PhyloBayes 3: a Bayesian software package for phylogenetic reconstruction and molecular dating
Lartillot, N., Lepage, T., & Blanquart, S. (2009) · Bioinformatics · doi:10.1093/bioinformatics/btp368 · Cited by 1,297 · cited 1×
“, PhyloBayes using the CAT+C model [76]).”
Phylogenomics and the reconstruction of the tree of life
Delsuc, F., Brinkmann, H., & Philippe, H. (2005) · Nature Reviews Genetics · doi:10.1038/nrg1603 · Cited by 1,236
Self-citationAmong-site rate variation and its impact on phylogenetic analyses
Yang, Z. (1996) · Trends in Ecology & Evolution · doi:10.1016/0169-5347(96)10041-0 · Cited by 1,209
Increased Taxon Sampling Greatly Reduces Phylogenetic Error
Zwickl, D. J., & Hillis, D. M. (2002) · Systematic Biology · doi:10.1080/10635150290102339 · Cited by 939
A Framework for the Quantitative Study of Evolutionary Trees
Hendy, M. D., & Penny, D. (1989) · Systematic Zoology · doi:10.2307/2992396 · Cited by 811
Assessing the root of bilaterian animals with scalable phylogenomic methods
Hejnol, A., Obst, M., Stamatakis, A., Ott, M., Rouse, G. W., Edgecombe, G. D., Martinez, P., Baguñà, J., Bailly, X., Jondelius, U., et al. (2009) · Proceedings of the Royal Society B: Biological Sciences · doi:10.1098/rspb.2009.0896 · Cited by 747 · cited 4×
“It is worth mentioning that the monophyly of Porifera is not unequivocally accepted [28,46]; only the analysis of 30,000 positions with a rich taxon sampling and a complex model of evolution recovers it with significant statistical support [3].”
BackgroundInfluentialPhylogenomics: The beginning of incongruence?
JEFFROY, O., BRINKMANN, H., DELSUC, F., & PHILIPPE, H. (2006) · Trends in Genetics · doi:10.1016/j.tig.2006.02.003 · Cited by 698 · cited 3×
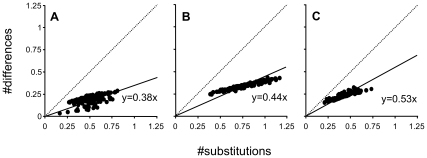
“The level of saturation was estimated for each dataset by computing the slope of the regression line of patristic distances (y-axis) versus uncorrected distances (x-axis), as previously described [12].”
MethodResultInfluentialSelf-citationPhylogenomics Revives Traditional Views on Deep Animal Relationships
Philippe, H., Derelle, R., Lopez, P., Pick, K., Borchiellini, C., Boury-Esnault, N., Vacelet, J., Renard, E., Houliston, E., Quéinnec, E., et al. (2009) · Current Biology · doi:10.1016/j.cub.2009.02.052 · Cited by 695
Self-citationMissing Data, Incomplete Taxa, and Phylogenetic Accuracy
Wiens, J. J. (2003) · Systematic Biology · doi:10.1080/10635150390218330 · Cited by 691
Fitch, W. M. (2000) · Trends in Genetics · doi:10.1016/s0168-9525(00)02005-9 · Cited by 592
Taxonomic Sampling, Phylogenetic Accuracy, and Investigator Bias
Hillis, D. M. (1998) · Systematic Biology · doi:10.1080/106351598260987 · Cited by 514
The Closest BLAST Hit Is Often Not the Nearest Neighbor
Koski, L. B., & Golding, G. B. (2001) · Journal of Molecular Evolution · doi:10.1007/s002390010184 · Cited by 466
Lemmon, A. R., Brown, J. M., Stanger-Hall, K., & Lemmon, E. M. (2009) · Systematic Biology · doi:10.1093/sysbio/syp017 · Cited by 415
Maximum-likelihood models for combined analyses of multiple sequence data
Yang, Z. (1996) · Journal of Molecular Evolution · doi:10.1007/bf02352289 · Cited by 413
Felsenstein, J. (2004) · Cited by 404
Phylogenomics of Eukaryotes: Impact of Missing Data on Large Alignments
Philippe, H., Snell, E. A., Bapteste, E., Lopez, P., Holland, P. W. H., & Casane, D. (2004) · Molecular Biology and Evolution · doi:10.1093/molbev/msh182 · Cited by 402
Self-citationMedina, M., Collins, A. G., Silberman, J. D., & Sogin, M. L. (2001) · Proceedings of the National Academy of Sciences · doi:10.1073/pnas.171316998 · Cited by 395 · cited 2×
“Furthermore, the erroneous use of mitochondrial sequences of demosponge origin to represent both hexactinellids and calcareans (Figure S9) in the original study [4] drastically—yet probably artifactually—strengthened the support for the monophyly of sponges (BS = 100%; [A]), whereas it appeared much weaker in our rean…”
ResultBapteste, E., Brinkmann, H., Lee, J. A., Moore, D. V., Sensen, C. W., Gordon, P., Duruflé, L., Gaasterland, T., Lopez, P., Müller, M., et al. (2002) · Proceedings of the National Academy of Sciences · doi:10.1073/pnas.032662799 · Cited by 378
Self-citationBradley, R. K., Roberts, A., Smoot, M., Juvekar, S., Do, J., Dewey, C., Holmes, I., & Pachter, L. (2009) · PLoS Computational Biology · doi:10.1371/journal.pcbi.1000392 · Cited by 353
Mathematics of Evolution and Phylogeny
(2005) · doi:10.1093/oso/9780198566106.001.0001 · Cited by 347
Improved phylogenomic taxon sampling noticeably affects nonbilaterian relationships
Pick, K. S., Philippe, H., Schreiber, F., Erpenbeck, D., Jackson, D. J., Wrede, P., Wiens, M., Alie, A., Morgenstern, B., Manuel, M., et al. (2010) · Molecular Biology and Evolution · doi:10.1093/molbev/msq089 · Cited by 334
Self-citationHow good are deep phylogenetic trees?
Philippe, H., & Laurent, J. (1998) · Current Opinion in Genetics & Development · doi:10.1016/s0959-437x(98)80028-2 · Cited by 324 · cited 1×
“When this happens, attracted branches artifactually emerge too deeply in the tree [9].”
BackgroundSelf-citationA Phylogenomic Approach to Resolve the Arthropod Tree of Life
Meusemann, K., von Reumont, B. M., Simon, S., Roeding, F., Strauss, S., Kuck, P., Ebersberger, I., Walzl, M., Pass, G., Breuers, S., et al. (2010) · Molecular Biology and Evolution · doi:10.1093/molbev/msq130 · Cited by 324
Detecting and Overcoming Systematic Errors in Genome-Scale Phylogenies
Rodríguez-Ezpeleta, N., Brinkmann, H., Roure, B., Lartillot, N., Lang, B. F., & Philippe, H. (2007) · Systematic Biology · doi:10.1080/10635150701397643 · Cited by 323 · cited 1×
“, heterogeneity of rate over time), had limited effects on phylogenetic reconstruction [69]; heterogeneity of rates across genes, handled by separate models [50], also has limited impact ([70], but see [71]).”
BackgroundSelf-citationJoint Bayesian Estimation of Alignment and Phylogeny
Redelings, B. D., & Suchard, M. A. (2005) · Systematic Biology · doi:10.1080/10635150590947041 · Cited by 313
Philippe, H., Delsuc, F., Brinkmann, H., & Lartillot, N. (2005) · Annual Review of Ecology, Evolution, and Systematics · doi:10.1146/annurev.ecolsys.35.112202.130205 · Cited by 306
Self-citationCan Incomplete Taxa Rescue Phylogenetic Analyses from Long-Branch Attraction?
Wiens, J. J. (2005) · Systematic Biology · doi:10.1080/10635150500234583 · Cited by 298
The quest for orthologs: finding the corresponding gene across genomes
Kuzniar, A., van Ham, R. C. H. J., Pongor, S., & Leunissen, J. A. M. (2008) · Trends in Genetics · doi:10.1016/j.tig.2008.08.009 · Cited by 296
Schierwater, B., Eitel, M., Jakob, W., Osigus, H.-J., Hadrys, H., Dellaporta, S. L., Kolokotronis, S.-O., & DeSalle, R. (2009) · PLoS Biology · doi:10.1371/journal.pbio.1000020 · Cited by 260
Mitochondrial genome of Trichoplax adhaerens supports Placozoa as the basal lower metazoan phylum
Dellaporta, S. L., Xu, A., Sagasser, S., Jakob, W., Moreno, M. A., Buss, L. W., & Schierwater, B. (2006) · Proceedings of the National Academy of Sciences · doi:10.1073/pnas.0602076103 · Cited by 252 · cited 1×
“, [24,31]), Schierwater et al.”
Inferring phylogenies from DNA sequences of unequal base compositions.
Galtier, N., & Gouy, M. (1995) · Proceedings of the National Academy of Sciences · doi:10.1073/pnas.92.24.11317 · Cited by 241
Inferring Phylogenies.—Joseph Felsenstein. 2003. Sinauer Associates, Sunderland, Massachusetts.
Penny, D. (2004) · Systematic Biology · doi:10.1080/10635150490468530 · Cited by 239
Saitou, N., & Nei, M. (1986) · Journal of Molecular Evolution · doi:10.1007/bf02099966 · Cited by 235
Can the Cambrian explosion be inferred through molecular phylogeny?
Philippe, H., Chenuil, A., & Adoutte, A. (1994) · Development · doi:10.1242/dev.1994.supplement.15 · Cited by 226
Self-citationRecent Evolutions of Multiple Sequence Alignment Algorithms
Notredame, C. (2007) · PLoS Computational Biology · doi:10.1371/journal.pcbi.0030123 · Cited by 224
ESTIMATING SPECIES TREES USING MULTIPLE-ALLELE DNA SEQUENCE DATA
Liu, L., Pearl, D. K., Brumfield, R. T., & Edwards, S. V. (2008) · Evolution · doi:10.1111/j.1558-5646.2008.00414.x · Cited by 209
A Site- and Time-Heterogeneous Model of Amino Acid Replacement
Blanquart, S., & Lartillot, N. (2008) · Molecular Biology and Evolution · doi:10.1093/molbev/msn018 · Cited by 208
On the use of nucleic acid sequences to infer early branchings in the tree of life.
(1995) · Molecular Biology and Evolution · doi:10.1093/oxfordjournals.molbev.a040220 · Cited by 207
Protein Evolution with Dependence Among Codons Due to Tertiary Structure
Robinson, D. M. (2003) · Molecular Biology and Evolution · doi:10.1093/molbev/msg184 · Cited by 205
Bayesian coestimation of phylogeny and sequence alignment
Lunter, G., Miklós, I., Drummond, A., Jensen, J. L., & Hein, J. (2005) · BMC Bioinformatics · doi:10.1186/1471-2105-6-83 · Cited by 195
Species Tree Inference by Minimizing Deep Coalescences
Than, C., & Nakhleh, L. (2009) · PLoS Computational Biology · doi:10.1371/journal.pcbi.1000501 · Cited by 191
SCaFoS: a tool for Selection, Concatenation and Fusion of Sequences for phylogenomics
Roure, B., Rodriguez-Ezpeleta, N., & Philippe, H. (2007) · BMC Evolutionary Biology · doi:10.1186/1471-2148-7-s1-s2 · Cited by 190
Self-citationSperling, E. A., Peterson, K. J., & Pisani, D. (2009) · Molecular Biology and Evolution · doi:10.1093/molbev/msp148 · Cited by 172 · cited 1×
“It is worth mentioning that the monophyly of Porifera is not unequivocally accepted [28,46]; only the analysis of 30,000 positions with a rich taxon sampling and a complex model of evolution recovers it with significant statistical support [3].”
BackgroundMissing data and the accuracy of Bayesian phylogenetics
Wiens, J. J., & Moen, D. S. (2008) · Journal of Systematics and Evolution · doi:10.3724/sp.j.1002.2008.08040 · Cited by 170
Baurain, D., Brinkmann, H., & Philippe, H. (2007) · Molecular Biology and Evolution · doi:10.1093/molbev/msl137 · Cited by 168
Self-citationEubacterial phylogeny based on translational apparatus proteins
Brochier‐Armanet, C., Bapteste, E. P., Moreira, D., & Philippe, H. (2002) · Trends in Genetics · doi:10.1016/s0168-9525(01)02522-7 · Cited by 167
Self-citationPhilippe, H., Sörhannus, U., Baroin‐Tourancheau, A., Perasso, R., Gasse, F., & Adoutte, A. (1994) · Journal of Evolutionary Biology · doi:10.1046/j.1420-9101.1994.7020247.x · Cited by 156
Self-citationClytia hemisphaerica: a jellyfish cousin joins the laboratory
Houliston, E., Momose, T., & Manuel, M. (2010) · Trends in Genetics · doi:10.1016/j.tig.2010.01.008 · Cited by 140
Self-citationGee, H. (2003) · Nature · doi:10.1038/425782a · Cited by 136
Using ESTs for phylogenomics: can one accurately infer a phylogenetic tree from a gappy alignment?
Hartmann, S., & Vision, T. J. (2008) · BMC Evolutionary Biology · doi:10.1186/1471-2148-8-95 · Cited by 130
Conflicting phylogenetic signals at the base of the metazoan tree
Rokas, A., King, N., Finnerty, J., & Carroll, S. B. (2003) · Evolution & Development · doi:10.1046/j.1525-142x.2003.03042.x · Cited by 126
A Mixed Branch Length Model of Heterotachy Improves Phylogenetic Accuracy
Kolaczkowski, B., & Thornton, J. W. (2008) · Molecular Biology and Evolution · doi:10.1093/molbev/msn042 · Cited by 94
Stamatakis, A., & Ott, M. (2008) · Philosophical Transactions of the Royal Society B: Biological Sciences · doi:10.1098/rstb.2008.0163 · Cited by 92
Rooting the eutherian tree: the power and pitfalls of phylogenomics
Nishihara, H., Okada, N., & Hasegawa, M. (2007) · Genome Biology · doi:10.1186/gb-2007-8-9-r199 · Cited by 91
A Model of Horizontal Gene Transfer and the Bacterial Phylogeny Problem
Galtier, N. (2007) · Systematic Biology · doi:10.1080/10635150701546231 · Cited by 85
Assessing Site-Interdependent Phylogenetic Models of Sequence Evolution
Rodrigue, N., Philippe, H., & Lartillot, N. (2006) · Molecular Biology and Evolution · doi:10.1093/molbev/msl041 · Cited by 74
Self-citationConjugate Gibbs Sampling for Bayesian Phylogenetic Models
Lartillot, N. (2006) · Journal of Computational Biology · doi:10.1089/cmb.2006.13.1701 · Cited by 70
Evolutionary Genomics and Systems Biology
Caetano‐Anollés, G. (2010) · Wiley eBooks · doi:10.1002/9780470570418 · Cited by 68
Haen, K. M., Lang, B. F., Pomponi, S. A., & Lavrov, D. V. (2007) · Molecular Biology and Evolution · doi:10.1093/molbev/msm070 · Cited by 67
Self-citationHow Much Can Evolved Characters Tell us about the Tree that Generated Them?
Mossel, E., & Steel, M. (2005) · Mathematics of Evolution and Phylogeny · doi:10.1093/oso/9780198566106.003.0014 · Cited by 58
Accuracy of phylogeny reconstruction methods combining overlapping gene data sets
Kupczok, A., Schmidt, H. A., & von Haeseler, A. (2010) · Algorithms for Molecular Biology · doi:10.1186/1748-7188-5-37 · Cited by 56
Kobayashi, M., Wada, H., & Satoh, N. (1996) · Molecular Phylogenetics and Evolution · doi:10.1006/mpev.1996.0036 · Cited by 52
OrthoSelect: a protocol for selecting orthologous groups in phylogenomics
Schreiber, F., Pick, K., Erpenbeck, D., Wörheide, G., & Morgenstern, B. (2009) · BMC Bioinformatics · doi:10.1186/1471-2105-10-219 · Cited by 31
Self-citationRapid Likelihood Analysis on Large Phylogenies Using Partial Sampling of Substitution Histories
de Koning, A. P. J., Gu, W., & Pollock, D. D. (2009) · Molecular Biology and Evolution · doi:10.1093/molbev/msp228 · Cited by 30
Vesterstrøm, J., & Taylor, W. R. (2006) · Journal of Computational Biology · doi:10.1089/cmb.2006.13.43 · Cited by 28
How much can evolved characters tell us about the tree that generated them?Preprint
Mossel, E., & Steel, M. (2004) · arXiv (Cornell University) · doi:10.48550/arxiv.q-bio/0406048 · Cited by 26
Current Approaches to Phylogenomic Reconstruction
Baurain, D., & Philippe, H. (2010) · Wiley eBooks · doi:10.1002/9780470570418.ch2 · Cited by 8
Self-citation
Cited by
Treangen, T. J., Ondov, B., Koren, S., & Phillippy, A. M. (2014) · Genome biology · doi:10.1186/preaccept-2573980311437212 · Cited by 1,654
Erwin, D. H., Laflamme, M., Tweedt, S. M., Sperling, E. A., Pisani, D., & Peterson, K. J. (2011) · Science · doi:10.1126/science.1206375 · Cited by 1,336
The Origin and Diversification of Mitochondria
Roger, A. J., Muñoz-Gómez, S. A., & Kamikawa, R. (2017) · Current Biology · doi:10.1016/j.cub.2017.09.015 · Cited by 1,142
Lartillot, N., Rodrigue, N., Stubbs, D., & Richer, J. (2013) · Systematic Biology · doi:10.1093/sysbio/syt022 · Cited by 871
Burki, F., Roger, A. J., Brown, M. W., & Simpson, A. G. B. (2020) · Trends in Ecology & Evolution · doi:10.1016/j.tree.2019.08.008 · Cited by 913
Metadata
- Authors
- Philippe, H., Brinkmann, H., Lavrov, D. V., Littlewood, D. T. J., Manuel, M., Wörheide, G., & Baurain, D.
- Affiliations
- Université de Montréal (CA)
- Iowa State University (US)
- Natural History Museum (GB)
- Ludwig-Maximilians-Universität München (DE)
- University of Liège (BE)
- Corresponding author
- Philippe, Hervé
- ORCID
- Venue
- PLoS Biology
- Publisher
- Public Library of Science (PLoS)
- Published
- 2011-03-15
- Volume
- 9
- Issue
- 3
- Pages
- e1000602
- ISSN
- 1544-9173 (ISSN-L)
- 1545-7885
- PMC
- PMC3057953
- OpenAlex
- W2111414304
- Semantic Scholar
- c032b81df71c5b5745454ef5b2afa4f715cc3f92
- Cited by
- 1,129
- References
- 83
- Citations by year
- 2026: 60 · 2025: 62 · 2024: 58 · 2023: 77 · 2022: 67 · 2021: 73 · 2020: 67 · 2019: 123 · 2018: 78 · 2017: 78 · 2016: 73 · 2015: 73 · 2014: 80 · 2013: 74 · 2012: 56
- FWCI
- 31.19
- Type
- journal article
- Language
- en
- Open access
- gold
- doi.org
- Locations
- PLoS Biology (publishedVersion, cc-by)
- PubMed Central (publishedVersion, cc-by)
- PubMed (publishedVersion)
- ORBi (University of Liège) (submittedVersion, other-oa)
- HAL (submittedVersion)
- DOAJ (DOAJ: Directory of Open Access Journals) (submittedVersion, cc-by-sa)
- Open access LMU (Ludwid Maxmilian's Universitat Munchen) (submittedVersion)
- Figshare (submittedVersion, cc-by)
- Natural History Museum, London (submittedVersion, cc-by)
- Funders
- Deutsche Forschungsgemeinschaft
- Agence Nationale de la Recherche
- Natural Sciences and Engineering Research Council of Canada
- Biotechnology and Biological Sciences Research Council (BB/H023534/1)
- Natural Environment Research Council (NER/A/S/2003/00313)
- Topics
- Life Sciences › Biochemistry, Genetics and Molecular Biology › Molecular Biology › Genomics and Phylogenetic Studies
- Life Sciences › Agricultural and Biological Sciences › Ecology, Evolution, Behavior and Systematics › Plant Diversity and Evolution
- Physical Sciences › Earth and Planetary Sciences › Paleontology › Evolution and Paleontology Studies
- Keywords
- phylogenetic inference, sequence data, phylogenetic resolution, molecular phylogeny, data saturation, phylogenetic signal
- MeSH terms
- Animals, Base Sequence, Biological Evolution, Molecular Sequence Data, Phylogeny, Databases, Factual, Sequence Alignment, Genomics
About these checks
Registry, retraction, Cites and statistics results are computed, not judged, with one exception: a printed reference that no index lists is read once by a model before it counts as a citation error. Claims are extracted by a model and kept only when their quote appears verbatim in the text; each cited source is then checked, with a model’s help, for whether it says what the claim relies on. Those verdicts can be wrong — read the claim’s quote and the cited source before relying on one.
Statistics and arithmetic are recomputed, not judged.
Confidence bands are shown only for fields calibrated on our annotated test set. None is calibrated yet, so no band is shown.
What counts as a claim ›How we measure confidence ›How we check this ›
Are you an author, or do you see a problem with this page? Request a review
Data sources
Bibliographic data: Semantic Scholar, OpenAlex, Crossref.
Contains information from the Semantic Scholar Academic Graph Datasets, made available under the ODC Attribution License (ODC-BY 1.0).
Semantic Scholar’s data is described in: Kinney, R., et al. (2023). The Semantic Scholar Open Data Platform. arXiv:2301.10140.
