

The DOI matches its Crossref record; 41 of the 41 references it cites were found in a registry or an index.
A Regulated Response to Impaired Respiration Slows Behavioral Rates and Increases Lifespan in Caenorhabditis elegans
Open accessAbstract
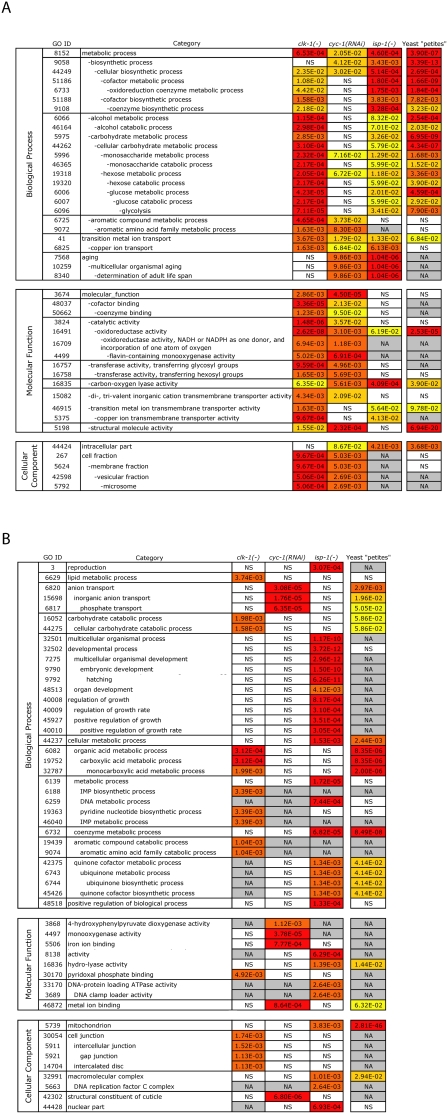
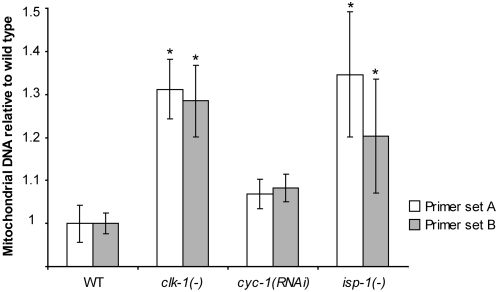
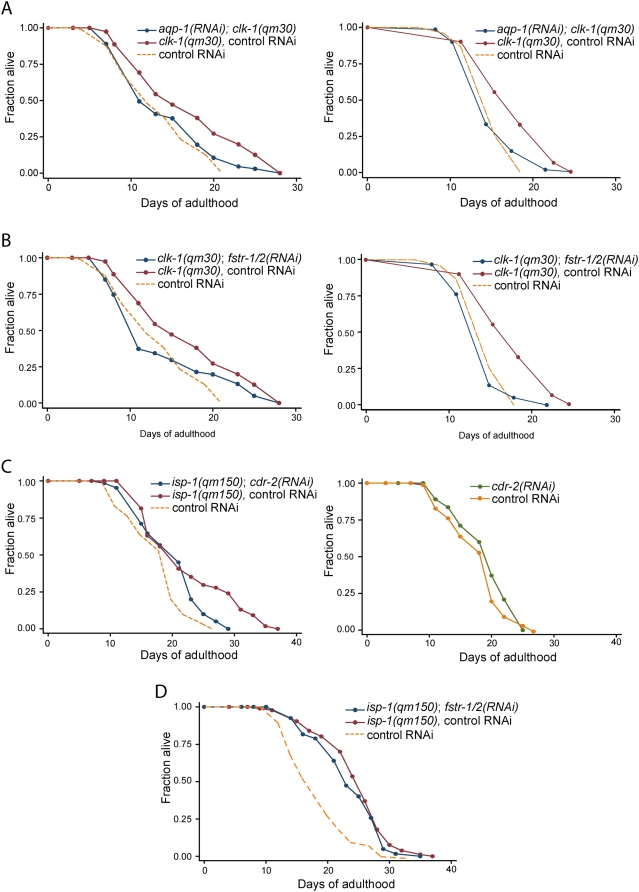
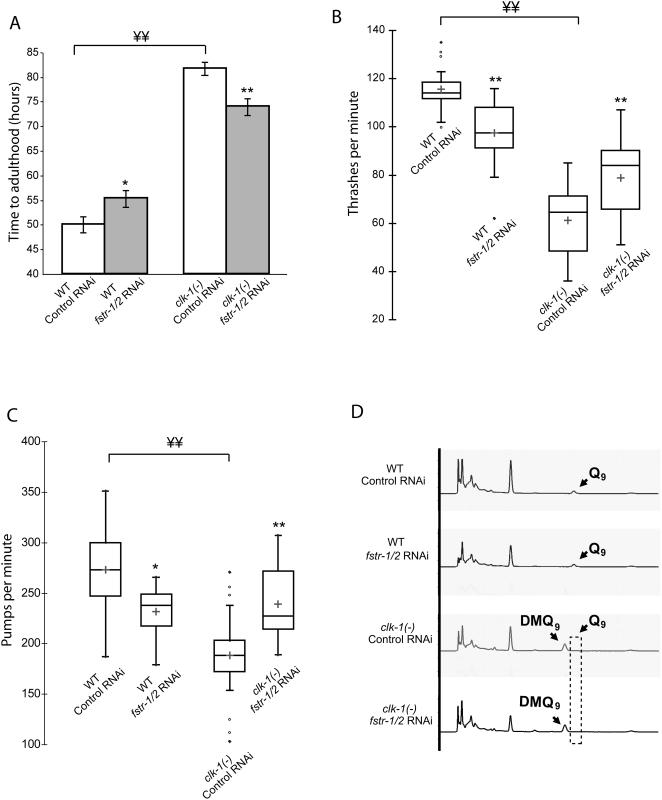
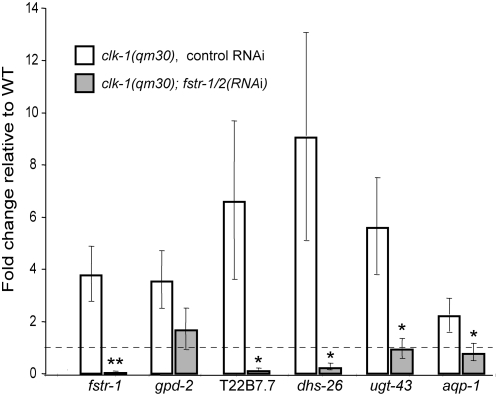
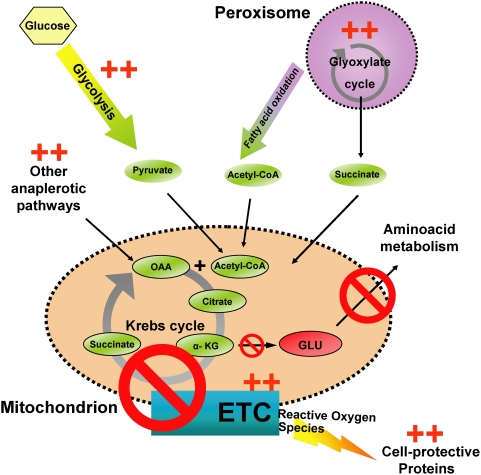
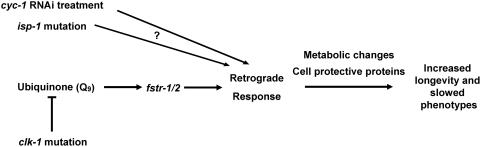
When mitochondrial respiration or ubiquinone production is inhibited in Caenorhabditis elegans, behavioral rates are slowed and lifespan is extended. Here, we show that these perturbations increase the expression of cell-protective and metabolic genes and the abundance of mitochondrial DNA. This response is similar to the response triggered by inhibiting respiration in yeast and mammalian cells, termed the "retrograde response". As in yeast, genes switched on in C. elegans mitochondrial mutants extend lifespan, suggesting an underlying evolutionary conservation of mechanism. Inhibition of fstr-1, a potential signaling gene that is up-regulated in clk-1 (ubiquinone-defective) mutants, and its close homolog fstr-2 prevents the expression of many retrograde-response genes and accelerates clk-1 behavioral and aging rates. Thus, clk-1 mutants live in "slow motion" because of a fstr-1/2-dependent pathway that responds to ubiquinone. Loss of fstr-1/2 does not suppress the phenotypes of all long-lived mitochondrial mutants. Thus, although different mitochondrial perturbations activate similar transcriptional and physiological responses, they do so in different ways.
Overview
The claims and statistics of this paper haven’t been checked yet.
Run the check — free, no account needed. It reads the open-access text and checks the sources it cites.
Integrity signals
Registry
Cites
Statistics
Figures
Verification
Claims the paper makes
The claims and statistics of this paper haven’t been checked yet.
Run the check — free, no account needed. It reads the open-access text and checks the sources it cites.
Claims other papers make about this one
Each is checked against this paper’s own text: does it say what the citing paper says it does?
In the citing paper
“Unexpectedly, reduced mitochondrial function can, in some circumstances, increase lifespan.”
From Neural mechanisms of ageing and cognitive decline (2010) · cites this paper as [38]
Self-check
Percentages, sums and reported differences re-computed from the paper’s own numbers.
The self-check needs the paper’s full text.
Citations
Cites
In silico prediction of protein-protein interactions in human macrophages
Souiai, O., Guerfali, F. Z., Miled, S. B., Brun, C., & Benkahla, A. (2014) · BMC Research Notes · doi:10.1186/1756-0500-7-157 · Cited by 10,785
Significance analysis of microarrays applied to the ionizing radiation response
Tusher, V. G., Tibshirani, R., & Chu, G. (2001) · Proceedings of the National Academy of Sciences · doi:10.1073/pnas.091062498 · Cited by 10,568
Exploring the metabolic and genetic control of gene expression on a genomic scale.
Derisi, J., Iyer, V., & Brown, P. (1997) · Science · doi:10.1126/science.278.5338.680 · Cited by 4,832
Maere, S., Heymans, K., & Kuiper, M. T. R. (2005) · Computer applications in the biosciences · doi:10.1093/bioinformatics/bti551 · Cited by 4,163
Genes that act downstream of DAF-16 to influence the lifespan of Caenorhabditis elegans
Murphy, C. T., McCarroll, S. A., Bargmann, C. I., Fraser, A., Kamath, R. S., Ahringer, J., Li, H., & Kenyon, C. (2003) · Nature · doi:10.1038/nature01789 · Cited by 2,280
Self-citationRates of Behavior and Aging Specified by Mitochondrial Function During Development
Dillin, A., Hsu, A.-L., Arantes-Oliveira, N., Lehrer-Graiwer, J., Hsin, H., Fraser, A. G., Kamath, R. S., Ahringer, J., & Kenyon, C. (2002) · Science · doi:10.1126/science.1077780 · Cited by 1,121
Self-citationA systematic RNAi screen identifies a critical role for mitochondria in C. elegans longevity
Lee, S. S., Lee, R. Y. N., Fraser, A. G., Kamath, R. S., Ahringer, J., & Ruvkun, G. (2003) · Nature Genetics · doi:10.1038/ng1056 · Cited by 969
Butow, R. A., & Avadhani, N. G. (2004) · Molecular Cell · doi:10.1016/s1097-2765(04)00179-0 · Cited by 882
Mitochondrial Electron Transport Is a Key Determinant of Life Span in Caenorhabditis elegans
Feng, J., Bussière, F., & Hekimi, S. (2001) · Developmental Cell · doi:10.1016/s1534-5807(01)00071-5 · Cited by 675
Lenaz, G. (2001) · IUBMB Life · doi:10.1080/15216540152845957 · Cited by 585
Determination of Life-Span in Caenorhabditis elegans by Four Clock Genes
Lakowski, B., & Hekimi, S. (1996) · Science · doi:10.1126/science.272.5264.1010 · Cited by 539
Genetics and the Specificity of the Aging Process
Hekimi, S., & Guarente, L. (2003) · Science · doi:10.1126/science.1082358 · Cited by 434
Liao, X., & Butow, R. A. (1993) · Cell · doi:10.1016/0092-8674(93)90050-z · Cited by 419
Mutations in the clk-1 gene of Caenorhabditis elegans affect developmental and behavioral timing
Wong, A., Boutis, P., & Hekimi, S. (1995) · Genetics · doi:10.1093/genetics/139.3.1247 · Cited by 416
Bennett-Lovsey, R., Herbert, A., Sternberg, M. J. E., & Kelley, L. A. (2007) · Proteins Structure Function and Bioinformatics · doi:10.1002/prot.21688 · Cited by 414
Genome-wide responses to mitochondrial dysfunction
Epstein, C. B., Waddle, J. A., Hale, W., Davé, V., Thornton, J., Macatee, T. L., Garner, H. R., & Butow, R. A. (2001) · Molecular Biology of the Cell · doi:10.1091/mbc.12.2.297 · Cited by 389
Rea, S. L., Ventura, N., & Johnson, T. E. (2007) · PLoS Biology · doi:10.1371/journal.pbio.0050259 · Cited by 383
Biswas, G., Adebanjo, O. A., Freedman, B. D., Anandatheerthavarada, H. K., Vijayasarathy, C., Zaidi, M., Kotlikoff, M., & Avadhani, N. G. (1999) · The EMBO Journal · doi:10.1093/emboj/18.3.522 · Cited by 369
Liu, X., Jiang, N., Hughes, B., Bigras, E., Shoubridge, E., & Hekimi, S. (2005) · Genes & Development · doi:10.1101/gad.1352905 · Cited by 345
Interorganelle signaling is a determinant of longevity in Saccharomyces cerevisiae
Kirchman, P. A., Kim, S., Lai, C.-Y., & Jazwinski, S. M. (1999) · Genetics · doi:10.1093/genetics/152.1.179 · Cited by 328 · cited 4×
“The retrograde response may be a compensatory reaction to the normal decline in mitochondrial function seen with age, since it is observed in older cells [1].”
BackgroundInfluentialThe Mitochondrial Genotype Can Influence Nuclear Gene Expression in Yeast
Parikh, V. S., Morgan, M. M., Scott, R., Clements, L. S., & Butow, R. A. (1987) · Science · doi:10.1126/science.3027892 · Cited by 324
Structural and Functional Conservation of the Caenorhabditis elegans Timing Gene clk-1
Ewbank, J. J., Barnes, T. M., Lakowski, B., Lussier, M., Bussey, H., & Hekimi, S. (1997) · Science · doi:10.1126/science.275.5302.980 · Cited by 319
Increased longevity and refractoriness to Ca2+-dependent neurodegeneration in Surf1 knockout mice
Dell'Agnello, C., Leo, S., Agostino, A., Szabadkai, G., Tiveron, C., Zulian, A., Prelle, A., Roubertoux, P., Rizzuto, R., & Zeviani, M. (2007) · Human Molecular Genetics · doi:10.1093/hmg/ddl477 · Cited by 308
CLK‐1 controls respiration, behavior and aging in the nematode Caenorhabditis elegans
Felkai, S., Ewbank, J. J., Lemieux, J., Labbé, J. ‐., Brown, G. G., & Hekimi, S. (1999) · The EMBO Journal · doi:10.1093/emboj/18.7.1783 · Cited by 295
Extension of Life-Span in Caenorhabditis elegans by a Diet Lacking Coenzyme Q
Larsen, P. L., & Clarke, C. F. (2002) · Science · doi:10.1126/science.1064653 · Cited by 249
Self-citationTraven, A., Wong, J. M. S., Xu, D., Sopta, M., & Ingles, C. J. (2001) · Journal of Biological Chemistry · doi:10.1074/jbc.m006807200 · Cited by 213
A methyl viologen-sensitive mutant of the nematode Caenorhabditis elegans
Ishii, N., Takahashi, K., Tomita, S., Keino, T., Honda, S., Yoshino, K., & Suzuki, K. (1990) · Mutation Research/DNAging · doi:10.1016/0921-8734(90)90022-j · Cited by 213
Early Mitochondrial Dysfunction in Long-lived Mclk1+/- Mice
Lapointe, J., & Hekimi, S. (2008) · Journal of Biological Chemistry · doi:10.1074/jbc.m803287200 · Cited by 212
Jonassen, T., Larsen, P. L., & Clarke, C. F. (2001) · Proceedings of the National Academy of Sciences · doi:10.1073/pnas.98.2.421 · Cited by 197
Self-citationYang, W., Li, J., & Hekimi, S. (2007) · Genetics · doi:10.1534/genetics.107.080788 · Cited by 171
Braeckman, B. P., Houthoofd, K., Vreese, A. D., & Vanfleteren, J. R. (1999) · Current Biology · doi:10.1016/s0960-9822(99)80216-4 · Cited by 125
Redox Regulation of Germline and Vulval Development in Caenorhabditis elegans
Shibata, Y., Branicky, R. S., Landaverde, I. O., & Hekimi, S. (2003) · Science · doi:10.1126/science.1087167 · Cited by 121
Mitochondrial Oxidative Phosphorylation Is Defective in the Long-lived Mutant clk-1
Kayser, E., Sedensky, M. M., Morgan, P. G., & Hoppel, C. L. (2004) · Journal of Biological Chemistry · doi:10.1074/jbc.m403066200 · Cited by 111
Metabolic pathway profiling of mitochondrial respiratory chain mutants in C. elegans
Falk, M. J., Zhang, Z., Rosenjack, J. R., Nissim, I. B., Daikhin, E., Nissim, I. B., Sedensky, M. M., Yudkoff, M., & Morgan, P. G. (2008) · Molecular Genetics and Metabolism · doi:10.1016/j.ymgme.2007.11.007 · Cited by 111
Functional analysis of the aquaporin gene family in Caenorhabditis elegans
Huang, C. G., Lamitina, T., Agre, P. C., & Strange, K. B. (2007) · American Journal of Physiology-Cell Physiology · doi:10.1152/ajpcell.00514.2006 · Cited by 76
Padilla, S., Jonassen, T., Jiménez‐Hidalgo, M., Fernández‐Ayala, D. J. M., López‐Lluch, G., Marbois, B. N., Navas, P., Clarke, C. F., & Santos‐Ocaña, C. (2004) · Journal of Biological Chemistry · doi:10.1074/jbc.m400001200 · Cited by 75
Self-citationCommon and cell type-specific responses of human cells to mitochondrial dysfunction
Miceli, M. V., & Jazwinski, S. M. (2004) · Experimental Cell Research · doi:10.1016/j.yexcr.2004.09.006 · Cited by 58
Branicky, R. S., Shibata, Y., Feng, J., & Hekimi, S. (2001) · Genetics · doi:10.1093/genetics/159.3.997 · Cited by 52
Branicky, R. S., Nguyen, P. A. T., & Hekimi, S. (2006) · Molecular and Cellular Biology · doi:10.1128/mcb.26.10.3976-3985.2006 · Cited by 31
Approximate P-Values for Local Sequence Alignments: Numerical Studies
Storey, J. D., & Siegmund, D. (2001) · Journal of Computational Biology · doi:10.1089/106652701753216530 · Cited by 25
Branicky, R. S., & Hekimi, S. (2005) · Development · doi:10.1242/dev.02069 · Cited by 9
Cited by
Sorted by citations
Kenyon, C. J. (2010) · Nature · doi:10.1038/nature08980 · Cited by 2,739
Self-citationNeural mechanisms of ageing and cognitive decline
Bishop, N. A., Lu, T., & Yankner, B. A. (2010) · Nature · doi:10.1038/nature08983 · Cited by 1,323
Coordination of mitophagy and mitochondrial biogenesis during ageing in C. elegans
Palikaras, K., Lionaki, E., & Tavernarakis, N. (2015) · Nature · doi:10.1038/nature14300 · Cited by 770
A Mitochondrial Superoxide Signal Triggers Increased Longevity in Caenorhabditis elegans
Yang, W., & Hekimi, S. (2010) · PLoS Biology · doi:10.1371/journal.pbio.1000556 · Cited by 649
Lee, S., Hwang, A. B., & Kenyon, C. J. (2010) · Current Biology · doi:10.1016/j.cub.2010.10.057 · Cited by 495
Self-citation
Metadata
- Authors
- Cristina, D., Cary, M., Lunceford, A., Clarke, C., & Kenyon, C.
- Affiliations
- University of California, San Francisco (US)
- University of California, Los Angeles (US)
- Corresponding author
- Kenyon, Cynthia
- Venue
- PLoS Genetics
- Publisher
- Public Library of Science (PLoS)
- Published
- 2009-04-10
- Volume
- 5
- Issue
- 4
- Pages
- e1000450
- ISSN
- 1553-7390 (ISSN-L)
- 1553-7404
- PMC
- PMC2660839
- OpenAlex
- W2086324577
- Cited by
- 166
- References
- 41
- Citations by year
- 2026: 8 · 2025: 5 · 2024: 3 · 2023: 2 · 2022: 10 · 2021: 6 · 2020: 15 · 2019: 10 · 2018: 8 · 2017: 6 · 2016: 10 · 2015: 11 · 2014: 21 · 2013: 5 · 2012: 12
- FWCI
- 4.71
- Type
- journal article
- Language
- en
- Open access
- gold
- doi.org
- Locations
- PLoS Genetics (publishedVersion, cc-by)
- PubMed Central (publishedVersion, cc-by)
- PubMed (publishedVersion)
- DOAJ (DOAJ: Directory of Open Access Journals) (submittedVersion)
- eScholarship (California Digital Library) (submittedVersion)
- eScholarship (California Digital Library) (submittedVersion, cc-by)
- Figshare (submittedVersion, cc-by)
- Funders
- Genome Canada
- Genome British Columbia
- National Institutes of Health
- University of California, San Francisco
- National Center for Research Resources
- Topics
- Life Sciences › Biochemistry, Genetics and Molecular Biology › Aging › Genetics, Aging, and Longevity in Model Organisms
- Life Sciences › Biochemistry, Genetics and Molecular Biology › Molecular Biology › Mitochondrial Function and Pathology
- Life Sciences › Biochemistry, Genetics and Molecular Biology › Cell Biology › Autophagy in Disease and Therapy
- Keywords
- mitochondrial respiration inhibition, coenzyme Q10, clk-1, retrograde response, lifespan extension, aging, Caenorhabditis elegans, mitochondrial mutants, gene expression response
- MeSH terms
- Animals, Behavior, Animal, Gene Expression Regulation, Longevity, Mitochondria, Mutation, Caenorhabditis elegans, Cell Respiration, Models, Animal, Caenorhabditis elegans Proteins
About these checks
Registry, retraction, Cites and statistics results are computed, not judged, with one exception: a printed reference that no index lists is read once by a model before it counts as a citation error. Claims are extracted by a model and kept only when their quote appears verbatim in the text; each cited source is then checked, with a model’s help, for whether it says what the claim relies on. Those verdicts can be wrong — read the claim’s quote and the cited source before relying on one.
Statistics and arithmetic are recomputed, not judged.
Confidence bands are shown only for fields calibrated on our annotated test set. None is calibrated yet, so no band is shown.
What counts as a claim ›How we measure confidence ›How we check this ›
Are you an author, or do you see a problem with this page? Request a review
