

The DOI matches its Crossref record; 59 of the 59 references it cites were found in a registry or an index.
Parkinson's Disease–Associated Kinase PINK1 Regulates Miro Protein Level and Axonal Transport of Mitochondria
Open accessAbstract
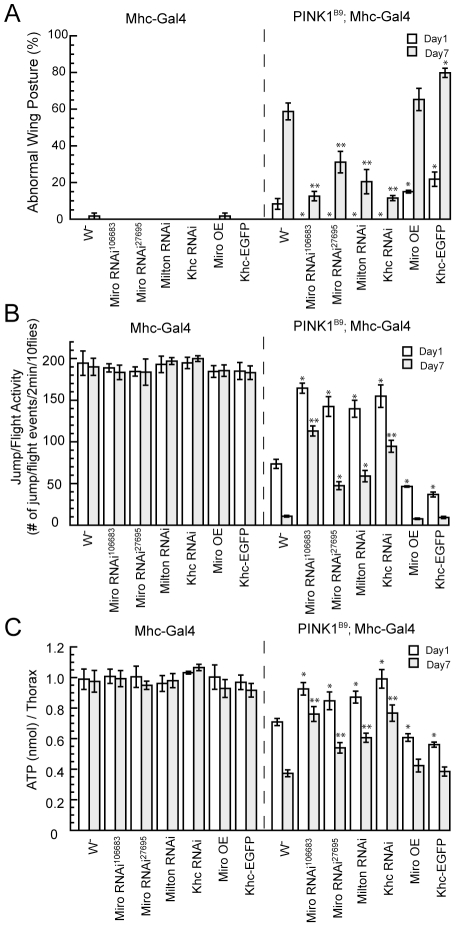
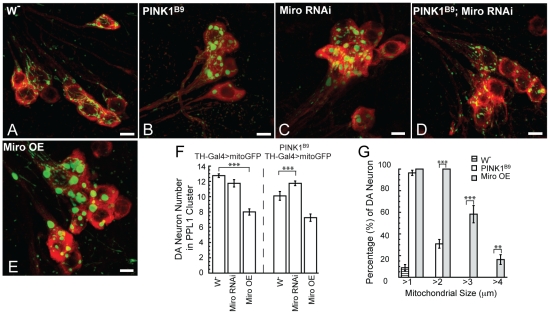
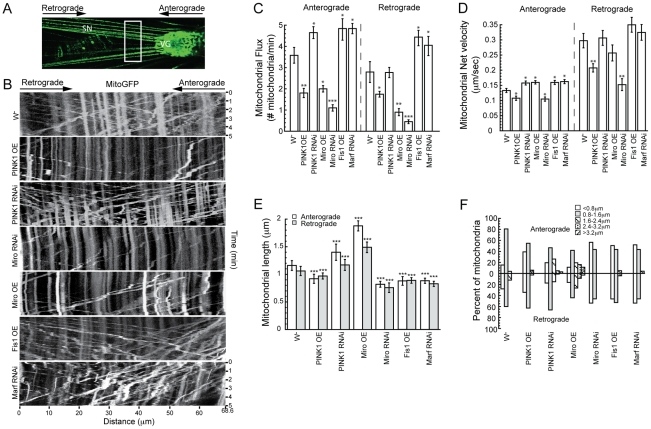
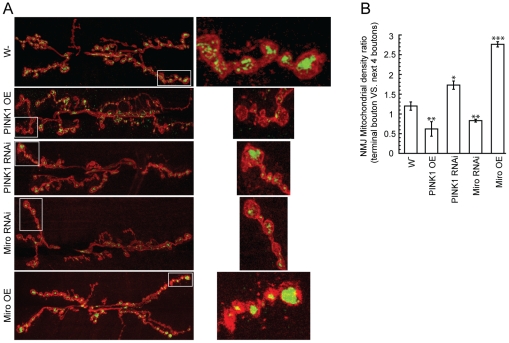
Mutations in Pten-induced kinase 1 (PINK1) are linked to early-onset familial Parkinson's disease (FPD). PINK1 has previously been implicated in mitochondrial fission/fusion dynamics, quality control, and electron transport chain function. However, it is not clear how these processes are interconnected and whether they are sufficient to explain all aspects of PINK1 pathogenesis. Here we show that PINK1 also controls mitochondrial motility. In Drosophila, downregulation of dMiro or other components of the mitochondrial transport machinery rescued dPINK1 mutant phenotypes in the muscle and dopaminergic (DA) neurons, whereas dMiro overexpression alone caused DA neuron loss. dMiro protein level was increased in dPINK1 mutant but decreased in dPINK1 or dParkin overexpression conditions. In Drosophila larval motor neurons, overexpression of dPINK1 inhibited axonal mitochondria transport in both anterograde and retrograde directions, whereas dPINK1 knockdown promoted anterograde transport. In HeLa cells, overexpressed hPINK1 worked together with hParkin, another FPD gene, to regulate the ubiquitination and degradation of hMiro1 and hMiro2, apparently in a Ser-156 phosphorylation-independent manner. Also in HeLa cells, loss of hMiro promoted the perinuclear clustering of mitochondria and facilitated autophagy of damaged mitochondria, effects previously associated with activation of the PINK1/Parkin pathway. These newly identified functions of PINK1/Parkin and Miro in mitochondrial transport and mitophagy contribute to our understanding of the complex interplays in mitochondrial quality control that are critically involved in PD pathogenesis, and they may explain the peripheral neuropathy symptoms seen in some PD patients carrying particular PINK1 or Parkin mutations. Moreover, the different effects of loss of PINK1 function on Miro protein level in Drosophila and mouse cells may offer one explanation of the distinct phenotypic manifestations of PINK1 mutants in these two species.
Overview
The claims and statistics of this paper haven’t been checked yet.
Run the check — free, no account needed. It reads the open-access text and checks the sources it cites.
Integrity signals
Registry
Cites
Statistics
Figures
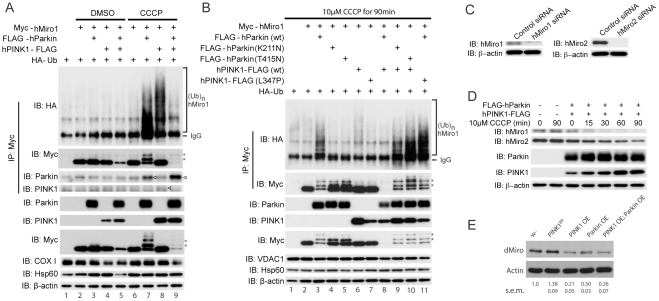
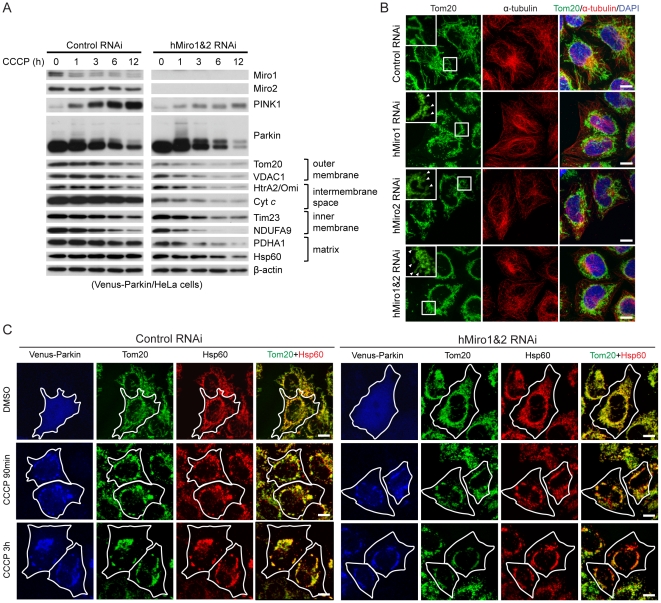
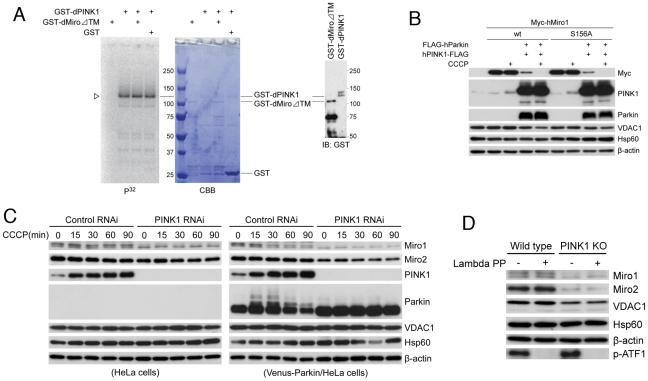
Verification
Claims the paper makes
The claims and statistics of this paper haven’t been checked yet.
Run the check — free, no account needed. It reads the open-access text and checks the sources it cites.
Claims other papers make about this one
Each is checked against this paper’s own text: does it say what the citing paper says it does?
In the citing paper
“Once activated, Parkin has been reported to facilitate ubiquitination of numerous OMM proteins, including Mfn1 [126,127,128], Mfn2 [129], VDAC [130], Tom20 (translocase of the outer membrane 20) [121], and Miro [131].”
From Mitochondrial Dynamics and Mitophagy in Skeletal Muscle Health and Aging (2021) · cites this paper as [131]
Self-check
Percentages, sums and reported differences re-computed from the paper’s own numbers.
The self-check needs the paper’s full text.
Citations
Cites
Mutations in the parkin gene cause autosomal recessive juvenile parkinsonism
Kitada, T., Asakawa, S., Hattori, N., Matsumine, H., Yamamura, Y., Minoshima, S., Yokochi, M., Mizuno, Y., & Shimizu, N. (1998) · Nature · doi:10.1038/33416 · Cited by 5,227
Self-citationParkin is recruited selectively to impaired mitochondria and promotes their autophagy
Narendra, D., Tanaka, A., Suen, D.-F., & Youle, R. J. (2008) · The Journal of Cell Biology · doi:10.1083/jcb.200809125 · Cited by 4,026
Hereditary Early-Onset Parkinson's Disease Caused by Mutations in PINK1
Valente, E. M., Abou-Sleiman, P. M., Caputo, V., Muqit, M. M. K., Harvey, K., Gispert, S., Ali, Z., Del Turco, D., Bentivoglio, A. R., Healy, D. G., et al. (2004) · Science · doi:10.1126/science.1096284 · Cited by 3,481
Youle, R. J., & Narendra, D. P. (2011) · Nature Reviews Molecular Cell Biology · doi:10.1038/nrm3028 · Cited by 3,273
PINK1 Is Selectively Stabilized on Impaired Mitochondria to Activate Parkin
Narendra, D. P., Jin, S. M., Tanaka, A., Suen, D.-F., Gautier, C. A., Shen, J., Cookson, M. R., & Youle, R. J. (2010) · PLoS Biology · doi:10.1371/journal.pbio.1000298 · Cited by 2,944
PINK1/Parkin-mediated mitophagy is dependent on VDAC1 and p62/SQSTM1
Geisler, S., Holmström, K. M., Skujat, D., Fiesel, F. C., Rothfuss, O. C., Kahle, P. J., & Springer, W. (2010) · Nature Cell Biology · doi:10.1038/ncb2012 · Cited by 2,835
Matsuda, N., Sato, S., Shiba, K., Okatsu, K., Saisho, K., Gautier, C. A., Sou, Y.-S., Saiki, S., Kawajiri, S., Sato, F., et al. (2010) · Journal of Cell Biology · doi:10.1083/jcb.200910140 · Cited by 1,969
Self-citationDrosophila pink1 is required for mitochondrial function and interacts genetically with parkin
Clark, I. E., Dodson, M. W., Jiang, C., Cao, J. H., Huh, J. R., Seol, J. H., Yoo, S. J., Hay, B. A., & Guo, M. (2006) · Nature · doi:10.1038/nature04779 · Cited by 1,788
Mitochondrial dysfunction in Drosophila PINK1 mutants is complemented by parkin
Park, J., Lee, S. B., Lee, S., Kim, Y., Song, S., Kim, S., Bae, E., Kim, J., Shong, M., Kim, J.-M., et al. (2006) · Nature · doi:10.1038/nature04788 · Cited by 1,705
Self-citationKinesin and Dynein Superfamily Proteins and the Mechanism of Organelle Transport
Hirokawa, N. (1998) · Science · doi:10.1126/science.279.5350.519 · Cited by 1,689
Proteasome and p97 mediate mitophagy and degradation of mitofusins induced by Parkin
Tanaka, A., Cleland, M. M., Xu, S., Narendra, D. P., Suen, D.-F., Karbowski, M., & Youle, R. J. (2010) · Journal of Cell Biology · doi:10.1083/jcb.201007013 · Cited by 1,369
The axonal transport of mitochondria
Saxton, W. M., & Hollenbeck, P. J. (2012) · Journal of Cell Science · doi:10.1242/jcs.053850 · Cited by 1,218
Self-citationPINK1 and Parkin Target Miro for Phosphorylation and Degradation to Arrest Mitochondrial Motility
Wang, X., Winter, D., Ashrafi, G., Schlehe, J. S., Wong, Y. L., Selkoe, D. J., Rice, S. E., Steen, J. A. J., LaVoie, M. J., & Schwarz, T. L. (2011) · Cell · doi:10.1016/j.cell.2011.10.018 · Cited by 1,198
Suzuki, Y., Imai, Y., Nakayama, H., Takahashi, K., Takio, K., & Takahashi, R. (2001) · Molecular Cell · doi:10.1016/s1097-2765(01)00341-0 · Cited by 1,140
Self-citationBroad activation of the ubiquitin–proteasome system by Parkin is critical for mitophagy
Chan, N. C., Salazar, A. M., Pham, A. H., Sweredoski, M. J., Kolawa, N. J., Graham, R. L. J., Hess, S., & Chan, D. C. (2011) · Human Molecular Genetics · doi:10.1093/hmg/ddr048 · Cited by 993
The PINK1/Parkin pathway regulates mitochondrial morphology
Poole, A. C., Thomas, R. E., Andrews, L. A., McBride, H. M., Whitworth, A. J., & Pallanck, L. J. (2008) · Proceedings of the National Academy of Sciences · doi:10.1073/pnas.0709336105 · Cited by 885
Ebneth, A., Godemann, R., Stamer, K., Illenberger, S., Trinczek, B., Mandelkow, E.-M., & Mandelkow, E. (1998) · The Journal of Cell Biology · doi:10.1083/jcb.143.3.777 · Cited by 820
Yang, Y., Gehrke, S., Imai, Y., Huang, Z., Ouyang, Y., Wang, J.-W., Yang, L., Beal, M. F., Vogel, H., & Lu, B. (2006) · Proceedings of the National Academy of Sciences · doi:10.1073/pnas.0602493103 · Cited by 798
Self-citationThe axonal transport of mitochondria
Hollenbeck, P. J., & Saxton, W. M. (2005) · Journal of Cell Science · doi:10.1242/jcs.02745 · Cited by 771
Self-citationDeng, H., Dodson, M. W., Huang, H., & Guo, M. (2008) · Proceedings of the National Academy of Sciences · doi:10.1073/pnas.0803998105 · Cited by 707
Loss of PINK1 causes mitochondrial functional defects and increased sensitivity to oxidative stress
Gautier, C. A., Kitada, T., & Shen, J. (2008) · Proceedings of the National Academy of Sciences · doi:10.1073/pnas.0802076105 · Cited by 698
Pilling, A. D., Horiuchi, D., Lively, C. M., & Saxton, W. M. (2006) · Molecular Biology of the Cell · doi:10.1091/mbc.e05-06-0526 · Cited by 696
Self-citationAxonal Transport of Mitochondria to Synapses Depends on Milton, a Novel Drosophila Protein
Stowers, R. S., Megeath, L. J., Górska‐Andrzejak, J., Meinertzhagen, I. A., & Schwarz, T. L. (2002) · Neuron · doi:10.1016/s0896-6273(02)01094-2 · Cited by 643
The GTPase dMiro Is Required for Axonal Transport of Mitochondria to Drosophila Synapses
Guo, X., Macleod, G. T., Wellington, A. J., Hu, F., Panchumarthi, S., Schoenfield, M., Marin, L., Charlton, M. P., Atwood, H. L., & Zinsmaier, K. E. (2005) · Neuron · doi:10.1016/j.neuron.2005.06.027 · Cited by 619
Yoshii, S. R., Kishi, C., Ishihara, N., & Mizushima, N. (2011) · Journal of Biological Chemistry · doi:10.1074/jbc.m110.209338 · Cited by 612
PINK1 Protects against Oxidative Stress by Phosphorylating Mitochondrial Chaperone TRAP1
Pridgeon, J. W., Olzmann, J. A., Chin, L.-S., & Li, L. (2007) · PLoS Biology · doi:10.1371/journal.pbio.0050172 · Cited by 596
The dynamic interaction of AMBRA1 with the dynein motor complex regulates mammalian autophagy
Bartolomeo, S. D., Corazzari, M., Nazio, F., Oliverio, S., Lisi, G., Antonioli, M., Pagliarini, V., Matteoni, S., Fuoco, C., Giunta, L., et al. (2010) · The Journal of Cell Biology · doi:10.1083/jcb.201002100 · Cited by 561
Impaired dopamine release and synaptic plasticity in the striatum of PINK1 -deficient mice
Kitada, T., Pisani, A., Porter, D. R., Yamaguchi, H., Tscherter, A., Martella, G., Bonsi, P., Zhang, C., Pothos, E. N., & Shen, J. (2007) · Proceedings of the National Academy of Sciences · doi:10.1073/pnas.0702717104 · Cited by 550
Pink1 regulates mitochondrial dynamics through interaction with the fission/fusion machinery
Yang, Y., Ouyang, Y., Yang, L., Beal, M. F., McQuibban, G. A., Vogel, H. S., & Lu, B. (2008) · Proceedings of the National Academy of Sciences · doi:10.1073/pnas.0711845105 · Cited by 549
Self-citationLoss-of-Function of Human PINK1 Results in Mitochondrial Pathology and Can Be Rescued by Parkin
Exner, N., Treske, B., Paquet, D., Holmström, K. M., Schiesling, C., Gispert, S., Carballo‐Carbajal, I., Berg, D., Hoepken, H.-H., Gasser, T., et al. (2007) · Journal of Neuroscience · doi:10.1523/jneurosci.0719-07.2007 · Cited by 523
Atypical Rho GTPases Have Roles in Mitochondrial Homeostasis and Apoptosis
Fransson, Å., Ruusala, A., & Aspenström, P. (2003) · Journal of Biological Chemistry · doi:10.1074/jbc.m208609200 · Cited by 396
Early-onset parkinsonism associated with PINK1 mutations
Bonifati, V., Rohé, C. F., Breedveld, G. J., Fabrizio, E., Mari, M. D., Tassorelli, C., Tavella, A., Marconi, R., Nicholl, D. J., Chien, H. F., et al. (2005) · Neurology · doi:10.1212/01.wnl.0000167546.39375.82 · Cited by 338
PINK1 is necessary for long term survival and mitochondrial function in human dopaminergic neurons
Wood-Kaczmar, A., Gandhi, S., Yao, Z., Abramov, A. S. Y., Miljan, E. A., Keen, G., Stanyer, L., Hargreaves, I., Klupsch, K., Deas, E., et al. (2008) · PLoS ONE · doi:10.1371/journal.pone.0002455 · Cited by 316
Sterky, F. H., Lee, S., Wibom, R., Olson, L., & Larsson, N. (2011) · Proceedings of the National Academy of Sciences · doi:10.1073/pnas.1103295108 · Cited by 300
Self-citationWeihofen, A., Craig, K. J. T., Ostaszewski, B. L., Cookson, M., & Selkoe, D. J. (2009) · Biochemistry · doi:10.1021/bi8019178 · Cited by 291
Drosophila Models of Neurodegenerative Diseases
Lu, B., & Vogel, H. S. (2008) · Annual Review of Pathology Mechanisms of Disease · doi:10.1146/annurev.pathol.3.121806.151529 · Cited by 257
Self-citationLaar, V. S. V., Arnold, B. A., Cassady, S. J., Chu, C. T., Burton, E. A., & Berman, S. (2010) · Human Molecular Genetics · doi:10.1093/hmg/ddq531 · Cited by 225
Yu, W., Sun, Y., Guo, S., & Lu, B. (2011) · Human Molecular Genetics · doi:10.1093/hmg/ddr235 · Cited by 219
Self-citationDrosophila Miro Is Required for Both Anterograde and Retrograde Axonal Mitochondrial Transport
Russo, G. J., Louie, K., Wellington, A., Macleod, G. T., Hu, F., Panchumarthi, S., & Zinsmaier, K. E. (2009) · The Journal of Neuroscience · doi:10.1523/jneurosci.5417-08.2009 · Cited by 217
Antioxidants protect PINK1 -dependent dopaminergic neurons in Drosophila
Wang, D., Li, Q., Xiong, H., Liu, J., Neckameyer, W. S., Oldham, S., Xia, K., Wang, J., Bodmer, R., & Zhang, Z. (2006) · Proceedings of the National Academy of Sciences · doi:10.1073/pnas.0604661103 · Cited by 203
Greene, J. C., Whitworth, A. J., Andrews, L. A., Parker, T. J., & Pallanck, L. J. (2005) · Human Molecular Genetics · doi:10.1093/hmg/ddi074 · Cited by 194
Akundi, R. S., Huang, Z., Eason, J., Pandya, J. D., Zhi, L., Cass, W. A., Sullivan, P. G., & Büeler, H. (2011) · PLoS ONE · doi:10.1371/journal.pone.0016038 · Cited by 192
Pink1 regulates the oxidative phosphorylation machinery via mitochondrial fission
Liu, W., Acín-Peréz, R., Geghman, K. D., Manfredi, G., Lu, B., & Li, C. (2011) · Proceedings of the National Academy of Sciences · doi:10.1073/pnas.1107332108 · Cited by 190
Self-citationChu, C. T. (2010) · Human Molecular Genetics · doi:10.1093/hmg/ddq143 · Cited by 177
The Genetics of Axonal Transport and Axonal Transport Disorders
Duncan, J. E., & Goldstein, L. S. B. (2006) · PLoS Genetics · doi:10.1371/journal.pgen.0020124 · Cited by 158
The PINK1/Parkin pathway: a mitochondrial quality control system?
Whitworth, A. J., & Pallanck, L. J. (2009) · Journal of Bioenergetics and Biomembranes · doi:10.1007/s10863-009-9253-3 · Cited by 137
The Parkinsonian Mimetic, MPP+, Specifically Impairs Mitochondrial Transport in Dopamine Axons
Kim‐Han, J. S., Antenor‐Dorsey, J. A. V., & O’Malley, K. L. (2011) · Journal of Neuroscience · doi:10.1523/jneurosci.0711-11.2011 · Cited by 135
Mitochondrial Dynamics and Peripheral Neuropathy
Baloh, R. H. (2007) · The Neuroscientist · doi:10.1177/1073858407307354 · Cited by 127
Mitochondrial Function, Morphology, and Axonal Transport in Amyotrophic Lateral Sclerosis
Magrané, J., & Manfredi, G. (2009) · Antioxidants and Redox Signaling · doi:10.1089/ars.2009.2604 · Cited by 127
Wang, H., Chou, A.-H., Wu, A.-S., Chen, S.-Y., Weng, Y.-H., Kao, Y.-C., Yeh, T., Chu, P., & Lu, C.-S. (2011) · Biochimica et Biophysica Acta (BBA) - Molecular Basis of Disease · doi:10.1016/j.bbadis.2011.03.007 · Cited by 122
Liu, S., & Lu, B. (2010) · PLoS Genetics · doi:10.1371/journal.pgen.1001237 · Cited by 105
Self-citationMechanisms of Disease: a molecular genetic update on hereditary axonal neuropathies
Zuchner, S. L., & Vance, J. M. (2006) · Nature Clinical Practice Neurology · doi:10.1038/ncpneuro0071 · Cited by 103
Imai, Y., Kanao, T., Sawada, T., Kobayashi, Y., Moriwaki, Y., Ishida, Y., Takeda, K., Ichijo, H., Lu, B., & Takahashi, R. (2010) · PLoS Genetics · doi:10.1371/journal.pgen.1001229 · Cited by 95
Self-citationTassin, J., Dürr, A., de Broucker, T., Abbas, N., Bonifati, V., Michele, G. D., Bonnet, A.-M., Broussolle, E., Pollak, P., Vidailhet, M., et al. (1998) · The American Journal of Human Genetics · doi:10.1086/301934 · Cited by 69
Imai, Y., & Lu, B. (2011) · Current Opinion in Neurobiology · doi:10.1016/j.conb.2011.10.016 · Cited by 63
Self-citationPARKIN as a pathogenic gene for autosomal recessive juvenile parkinsonism
Shimizu, N., Asakawa, S., Minoshima, S., Kitada, T., Hattori, N., Matsumine, H., Yokochi, M., Yamamura, Y., & Mizuno, Y. (2000) · Springer eBooks · doi:10.1007/978-3-7091-6284-2_2 · Cited by 51
Self-citationGenome-wide screen for modifiers of Parkinson's disease genes in Drosophila
Fernandes, C., & Rao, Y. (2011) · Molecular Brain · doi:10.1186/1756-6606-4-17 · Cited by 38
Does parkin play a role in the peripheral nervous system? A family report
Abbruzzese, G., Pigullo, S., Schenone, A. E., Bellone, E., Marchese, R., Maria, E. D., Benedetti, L., Ciotti, P., Nobbio, L., Bonifati, V., et al. (2004) · Movement Disorders · doi:10.1002/mds.20113 · Cited by 36
Genetic Mutations and Mitochondrial Toxins Shed New Light on the Pathogenesis of Parkinson's Disease
Sato, S., & Hattori, N. (2011) · Parkinson s Disease · doi:10.4061/2011/979231 · Cited by 14
Self-citation
Cited by
Sorted by citations
The Roles of PINK1, Parkin, and Mitochondrial Fidelity in Parkinson’s Disease
Pickrell, A. M., & Youle, R. J. (2015) · Neuron · doi:10.1016/j.neuron.2014.12.007 · Cited by 2,310
Synaptic Energy Use and Supply
Harris, J. J., Jolivet, R., & Attwell, D. (2012) · Neuron · doi:10.1016/j.neuron.2012.08.019 · Cited by 1,747
Landscape of the PARKIN-dependent ubiquitylome in response to mitochondrial depolarization
Sarraf, S. A., Raman, M., Guarani-Pereira, V., Sowa, M. E., Huttlin, E. L., Gygi, S. P., & Harper, J. W. (2013) · Nature · doi:10.1038/nature12043 · Cited by 1,010
Mitochondrial dynamics and mitochondrial quality control
Ni, H.-M., Williams, J. A., & Ding, W.-X. (2015) · Redox Biology · doi:10.1016/j.redox.2014.11.006 · Cited by 931
Kondapalli, C., Kazlauskaite, A., Zhang, N., Woodroof, H. I., Campbell, D. G., Gourlay, R., Burchell, L., Walden, H., Macartney, T. J., Deak, M., et al. (2012) · Open Biology · doi:10.1098/rsob.120080 · Cited by 940
Metadata
- Authors
- Liu, S., Sawada, T., Lee, S., Yu, W., Silverio, G., Alapatt, P., Millan, I., Shen, A., Saxton, W., Kanao, T., Takahashi, R., Hattori, N., Imai, Y., & Lu, B.
- Affiliations
- Stanford Medicine (US)
- Kyoto University (JP)
- Washington University in St. Louis (US)
- University of California, Santa Cruz (US)
- Juntendo University (JP)
- Corresponding author
- Imai, Yuzuru
- Lu, Bingwei
- Venue
- PLoS Genetics
- Publisher
- Public Library of Science (PLoS)
- Published
- 2012-03-01
- Volume
- 8
- Issue
- 3
- Pages
- e1002537
- ISSN
- 1553-7390 (ISSN-L)
- 1553-7404
- PMC
- PMC3291531
- OpenAlex
- W2148819754
- Cited by
- 371
- References
- 59
- Citations by year
- 2026: 11 · 2025: 10 · 2024: 10 · 2023: 11 · 2022: 18 · 2021: 35 · 2020: 29 · 2019: 22 · 2018: 28 · 2017: 30 · 2016: 36 · 2015: 32 · 2014: 42 · 2013: 33 · 2012: 23
- FWCI
- 27.18
- Type
- journal article
- Language
- en
- Open access
- gold
- doi.org
- Locations
- PLoS Genetics (publishedVersion, cc-by)
- Europe PMC (PubMed Central) (publishedVersion, cc-by)
- PubMed Central (publishedVersion, cc-by)
- PubMed (publishedVersion)
- DOAJ (DOAJ: Directory of Open Access Journals) (submittedVersion, cc-by-sa)
- Figshare (submittedVersion, cc-by)
- Funders
- Ministry of Education, Culture, Sports, Science and Technology (CREST)
- Dainippon Sumitomo Pharma
- Ministry of Health, Labour and Welfare
- National Institutes of Health
- Japan Society for the Promotion of Science (23390232, 23111002, 23890206, 23790973)
- National Institute of Mental Health (R01MH080378)
- National Institute of General Medical Sciences (R01GM084947, GM084947)
- National Institute of Arthritis and Musculoskeletal and Skin Diseases (R01AR054926)
- Core Research for Evolutional Science and Technology
- Topics
- Health Sciences › Medicine › Clinical Neurology › Parkinson's Disease Mechanisms and Treatments
- Life Sciences › Biochemistry, Genetics and Molecular Biology › Cell Biology › Autophagy in Disease and Therapy
- Life Sciences › Biochemistry, Genetics and Molecular Biology › Molecular Biology › Mitochondrial Function and Pathology
- Keywords
- PINK1, Miro1, Miro2, Parkinson's disease, mitochondrial motility, Parkin, mitophagy, mitochondrial quality control, dopaminergic neurons, motor neurons, ubiquitin-mediated proteolysis, peripheral neuropathy, Drosophila
- MeSH terms
- PTEN-Induced Putative Kinase, Animals, Autophagy, Axonal Transport, Carbonyl Cyanide m-Chlorophenyl Hydrazone, Disease Models, Animal, Drosophila, Gene Expression Regulation, HeLa Cells, Humans, Mitochondria, Motor Neurons, Parkinson Disease, Protein Serine-Threonine Kinases, Mice, Knockout, rho GTP-Binding Proteins, Drosophila Proteins, Ubiquitin-Protein Ligases, Mutant Proteins, Mice, Dopaminergic Neurons, Proton Ionophores
About these checks
Registry, retraction, Cites and statistics results are computed, not judged, with one exception: a printed reference that no index lists is read once by a model before it counts as a citation error. Claims are extracted by a model and kept only when their quote appears verbatim in the text; each cited source is then checked, with a model’s help, for whether it says what the claim relies on. Those verdicts can be wrong — read the claim’s quote and the cited source before relying on one.
Statistics and arithmetic are recomputed, not judged.
Confidence bands are shown only for fields calibrated on our annotated test set. None is calibrated yet, so no band is shown.
What counts as a claim ›How we measure confidence ›How we check this ›
Are you an author, or do you see a problem with this page? Request a review
