

The DOI matches its Crossref record; 79 of the 79 references it cites were found in a registry or an index.
Classic Selective Sweeps Revealed by Massive Sequencing in Cattle
Open accessAbstract
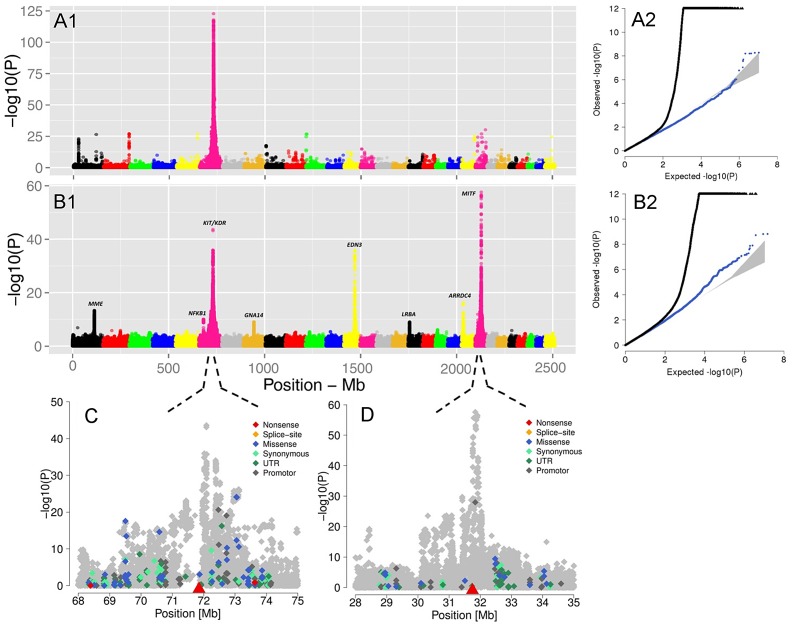
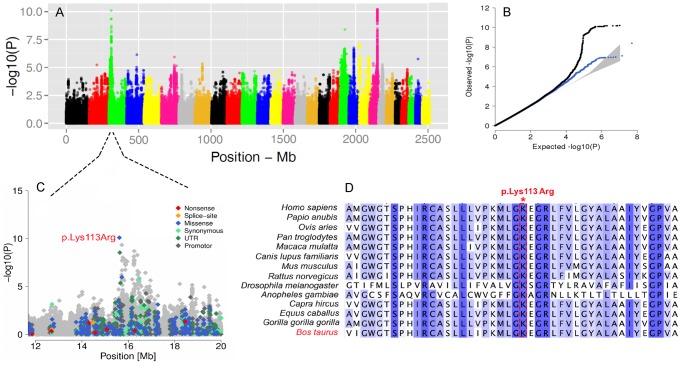
Human driven selection during domestication and subsequent breed formation has likely left detectable signatures within the genome of modern cattle. The elucidation of these signatures of selection is of interest from the perspective of evolutionary biology, and for identifying domestication-related genes that ultimately may help to further genetically improve this economically important animal. To this end, we employed a panel of more than 15 million autosomal SNPs identified from re-sequencing of 43 Fleckvieh animals. We mainly applied two somewhat complementary statistics, the integrated Haplotype Homozygosity Score (iHS) reflecting primarily ongoing selection, and the Composite of Likelihood Ratio (CLR) having the most power to detect completed selection after fixation of the advantageous allele. We find 106 candidate selection regions, many of which are harboring genes related to phenotypes relevant in domestication, such as coat coloring pattern, neurobehavioral functioning and sensory perception including KIT, MITF, MC1R, NRG4, Erbb4, TMEM132D and TAS2R16, among others. To further investigate the relationship between genes with signatures of selection and genes identified in QTL mapping studies, we use a sample of 3062 animals to perform four genome-wide association analyses using appearance traits, body size and somatic cell count. We show that regions associated with coat coloring significantly (P<0.0001) overlap with the candidate selection regions, suggesting that the selection signals we identify are associated with traits known to be affected by selection during domestication. Results also provide further evidence regarding the complexity of the genetics underlying coat coloring in cattle. This study illustrates the potential of population genetic approaches for identifying genomic regions affecting domestication-related phenotypes and further helps to identify specific regions targeted by selection during speciation, domestication and breed formation of cattle. We also show that Linkage Disequilibrium (LD) decays in cattle at a much faster rate than previously thought.
Overview
The claims and statistics of this paper haven’t been checked yet.
Run the check — free, no account needed. It reads the open-access text and checks the sources it cites.
Integrity signals
Registry
Cites
Statistics
Figures
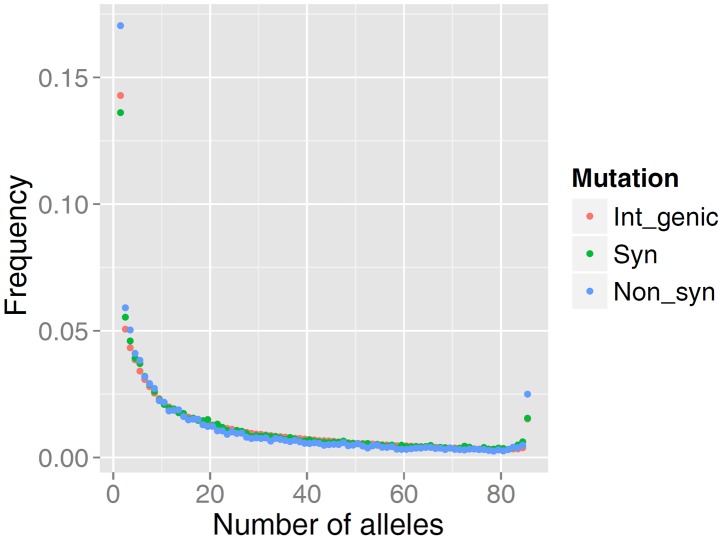
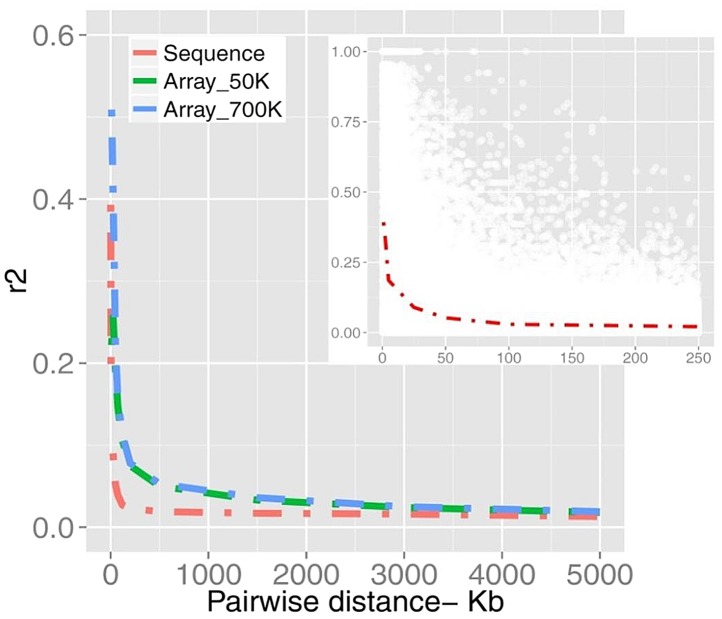
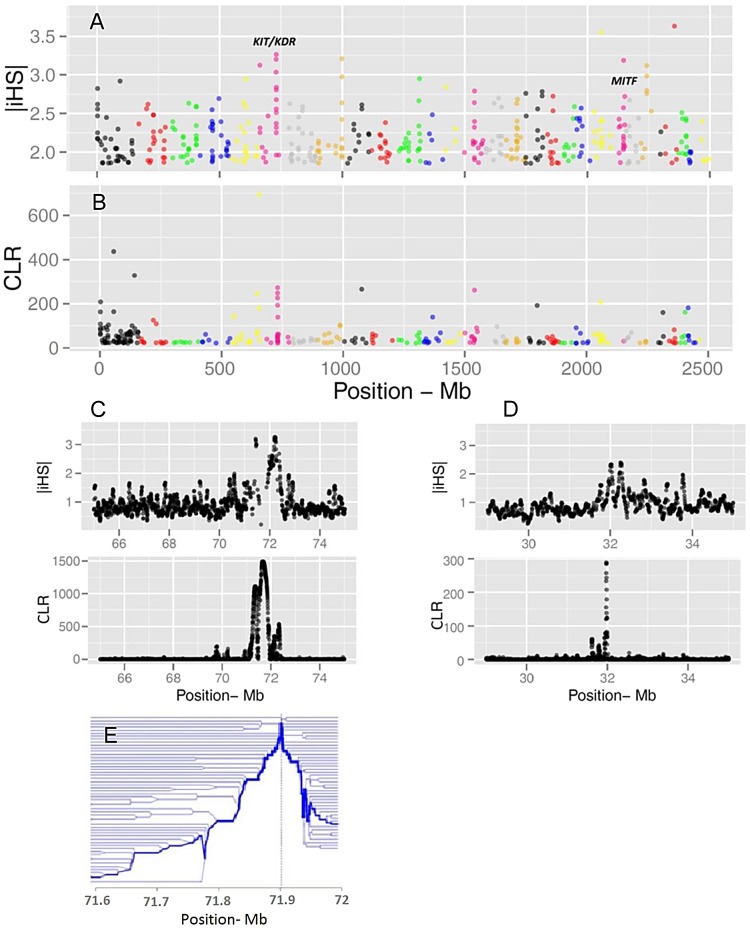
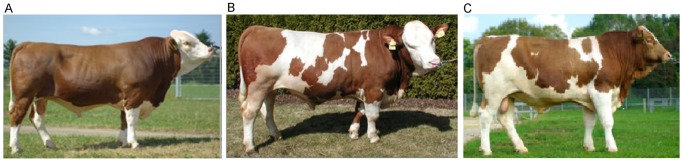
Verification
Claims the paper makes
The claims and statistics of this paper haven’t been checked yet.
Run the check — free, no account needed. It reads the open-access text and checks the sources it cites.
Claims other papers make about this one
Each is checked against this paper’s own text: does it say what the citing paper says it does?
In the citing paper
“This gene has been targeted in modern human evolution and in multiple domestication events, including in dogs, sheep, yaks, and across multiple cattle breeds [16, 19, 20].”
From Gene expression profiles underlying aggressive behavior in the prefrontal cortex of cattle (2021) · cites this paper as [20]
Self-check
Percentages, sums and reported differences re-computed from the paper’s own numbers.
The self-check needs the paper’s full text.
Citations
Cites
Systematic and integrative analysis of large gene lists using DAVID bioinformatics resources
Huang, D. W., Sherman, B. T., & Lempicki, R. A. (2009) · Nature Protocols · doi:10.1038/nprot.2008.211 · Cited by 35,890
Statistical method for testing the neutral mutation hypothesis by DNA polymorphism.
Tajima, F. (1989) · Genetics · doi:10.1093/genetics/123.3.585 · Cited by 14,056
GCTA: a tool for genome-wide complex trait analysis
Yang, J., Lee, S. H., Goddard, M. E., & Visscher, P. M. (2011) · The American Journal of Human Genetics · doi:10.1016/j.ajhg.2010.11.011 · Cited by 8,279
The hitch-hiking effect of a favourable gene
Smith, J. M., & Haigh, J. (1974) · Genetical Research · doi:10.1017/s0016672300014634 · Cited by 3,415
A Map of Recent Positive Selection in the Human Genome
Voight, B. F., Kudaravalli, S., Wen, X., & Pritchard, J. K. (2006) · PLoS Biology · doi:10.1371/journal.pbio.0040072 · Cited by 2,925
Variance component model to account for sample structure in genome-wide association studies
Kang, H. M., Sul, J. H., Service, S. K., Zaitlen, N. A., Kong, S.-Y., Freimer, N. B., Sabatti, C., & Eskin, E. (2010) · Nature Genetics · doi:10.1038/ng.548 · Cited by 2,817
The hitch-hiking effect of a favourable gene
Smith, J. M., & Haigh, J. (2007) · Genetics Research · doi:10.1017/s0016672308009579 · Cited by 2,675
Detecting recent positive selection in the human genome from haplotype structure
Sabeti, P. C., Reich, D. E., Higgins, J. M., Levine, H. Z. P., Richter, D. J., Schaffner, S. F., Gabriel, S. B., Platko, J. V., Patterson, N. J., McDonald, G. J., et al. (2002) · Nature · doi:10.1038/nature01140 · Cited by 2,106
Hitchhiking Under Positive Darwinian Selection
Fay, J. C., & Wu, C.-I. (2000) · Genetics · doi:10.1093/genetics/155.3.1405 · Cited by 1,819
Fast and accurate genotype imputation in genome-wide association studies through pre-phasing
Howie, B., Fuchsberger, C., Stephens, M., Marchini, J., & Abecasis, G. R. (2012) · Nature Genetics · doi:10.1038/ng.2354 · Cited by 1,737
Neuregulin 1 and Susceptibility to Schizophrenia
Stefánsson, H., Pétursson, H., Sigurðsson, E., Steinthórsdóttir, V., Bjornsdottir, S., Sigmundsson, T., Ghosh, S., Brynjolfsson, J., Gunnarsdottir, S., Ivarsson, O., et al. (2002) · The American Journal of Human Genetics · doi:10.1086/342734 · Cited by 1,671
Browning, B. L., & Browning, S. R. (2009) · The American Journal of Human Genetics · doi:10.1016/j.ajhg.2009.01.005 · Cited by 1,640
Analyses of pig genomes provide insight into porcine demography and evolution
Groenen, M. A. M., Archibald, A. L., Uenishi, H., Tuggle, C. K., Takeuchi, Y., Rothschild, M. F., Rogel-Gaillard, C., Park, C., Milan, D., Megens, H., et al. (2012) · Nature · doi:10.1038/nature11622 · Cited by 1,424
The Genome Sequence of Taurine Cattle: A Window to Ruminant Biology and Evolution
The Bovine Genome Sequencing and Analysis Consortium, Elsik, C. G., Tellam, R. L., Worley, K. C., Gibbs, R. A., Muzny, D. M., Weinstock, G. M., Adelson, D. L., Eichler, E. E., Elnitski, L., et al. (2009) · Science · doi:10.1126/science.1169588 · Cited by 1,287
Linkage Disequilibrium in Humans: Models and Data
Pritchard, J. K., & Przeworski, M. (2001) · The American Journal of Human Genetics · doi:10.1086/321275 · Cited by 1,285
Whole-genome resequencing reveals loci under selection during chicken domestication
Rubin, C.-J., Zody, M. C., Eriksson, J., Meadows, J. R. S., Sherwood, E., Webster, M. T., Jiang, L., Ingman, M., Sharpe, T., Ka, S., et al. (2010) · Nature · doi:10.1038/nature08832 · Cited by 1,138
Neuregulin 1 in neural development, synaptic plasticity and schizophrenia
Mei, L., & Xiong, W.-C. (2008) · Nature Reviews Neuroscience · doi:10.1038/nrn2392 · Cited by 1,030
Genomic scans for selective sweeps using SNP dataPreprint
Nielsen, R., Williamson, S., Kim, Y., Hubisz, M. J., Clark, A. G., & Bustamante, C. D. (2005) · Genome Research · doi:10.1101/gr.4252305 · Cited by 1,026
Self-citationInterrogating a high-density SNP map for signatures of natural selection.Preprint
Akey, J., Zhang, G., Zhang, K., Jin, L., & Shriver, M. (2002) · Genome Research · doi:10.1101/gr.631202 · Cited by 932
Genome-wide survey of SNP variation uncovers the genetic structure of cattle breeds
The Bovine HapMap Consortium, Gibbs, R. A., Taylor, J. F., Van Tassell, C. P., Barendse, W., Eversole, K. A., Gill, C. A., Green, R. D., Hamernik, D. L., Kappes, S. M., et al. (2009) · Science · doi:10.1126/science.1167936 · Cited by 868
Genome-wide association study in alopecia areata implicates both innate and adaptive immunity
Petukhova, L., Duvic, M. A., Hordinsky, M., Norris, D. A., Price, V. H., Shimomura, Y., Kim, H., Singh, P., Lee, A., Chen, W. V., et al. (2010) · Nature · doi:10.1038/nature09114 · Cited by 833
Evidence for Two Independent Domestications of Cattle
Loftus, R. T., MacHugh, D. E., Bradley, D. G., Sharp, P. M., & Cunningham, P. (1994) · Proceedings of the National Academy of Sciences · doi:10.1073/pnas.91.7.2757 · Cited by 812
Signals of recent positive selection in a worldwide sample of human populations
Pickrell, J. K., Coop, G., Novembre, J., Kudaravalli, S., Li, J. Z., Absher, D., Srinivasan, B. S., Barsh, G. S., Myers, R. M., Feldman, M. W., et al. (2009) · Genome Research · doi:10.1101/gr.087577.108 · Cited by 717
The state of the world's animal genetic resources for food and agriculture
Rischkowsky, B. (2007) · Cited by 692
Strong signatures of selection in the domestic pig genome
Rubin, C.-J., Megens, H.-J., Barrio, A. M., Maqbool, K., Sayyab, S., Schwochow, D., Wang, C., Carlborg, Ö., Jern, P., Jørgensen, C. B., et al. (2012) · Proceedings of the National Academy of Sciences · doi:10.1073/pnas.1217149109 · Cited by 652
Olfaction: Diverse Species, Conserved Principles
Ache, B. W., & Young, J. M. (2005) · Neuron · doi:10.1016/j.neuron.2005.10.022 · Cited by 652
Assessing the evolutionary impact of amino acid mutations in the human genome.
Boyko, A. R., Williamson, S. H., Indap, A. R., Degenhardt, J. D., Hernandez, R. D., Lohmueller, K. E., Adams, M. D., Schmidt, S., Sninsky, J. J., Sunyaev, S. R., et al. (2008) · PLoS Genetics · doi:10.1371/journal.pgen.1000083 · Cited by 628
Self-citationGenetic Evidence for Near-Eastern Origins of European Cattle
Troy, C. S., MacHugh, D. E., Bailey, J. F., Magee, D. A., Loftus, R. T., Cunningham, P., Chamberlain, A. T., Sykes, B. C., & Bradley, D. G. (2001) · Nature · doi:10.1038/35074088 · Cited by 627
Patterns of Positive Selection in Six Mammalian Genomes
Kosiol, C., Vinař, T., da Fonseca, R. R., Hubisz, M. J., Bustamante, C. D., Nielsen, R., & Siepel, A. (2008) · PLoS Genetics · doi:10.1371/journal.pgen.1000144 · Cited by 576
Self-citationGautier, M., & Vitalis, R. (2012) · Bioinformatics · doi:10.1093/bioinformatics/bts115 · Cited by 528
Accuracy of genomic breeding values in multi-breed dairy cattle populations
Hayes, B. J., Bowman, P. J., Chamberlain, A. C., VERBYLA, K. L., & Goddard, M. E. (2009) · Genetics Selection Evolution · doi:10.1186/1297-9686-41-51 · Cited by 493
Hayes, B. J., Pryce, J. E., Chamberlain, A. J., Bowman, P. J., & Goddard, M. E. (2010) · PLoS Genetics · doi:10.1371/journal.pgen.1001139 · Cited by 426
The role of melanocyte-stimulating hormone (MSH) receptor in bovine coat color determination
Klungland, H., Våge, D. I., Gomez‐Raya, L., ADALSTEINSSON, S., & Lien, S. (1995) · Mammalian Genome · doi:10.1007/bf00352371 · Cited by 396
Estimation of Population Parameters and Recombination Rates From Single Nucleotide Polymorphisms
Nielsen, R. (2000) · Genetics · doi:10.1093/genetics/154.2.931 · Cited by 351
Self-citationKarim, L., Takeda, H., Li, L., Druet, T., Arias, J., Baurain, D., Cambisano, N., Davis, S. R., Farnir, F., Grisart, B., et al. (2011) · Nature Genetics · doi:10.1038/ng.814 · Cited by 328
Li, Y., Vinckenbosch, N., Tian, G., Huerta‐Sánchez, E., Jiang, T., Jiang, H., Albrechtsen, A., Andersen, G., Cao, H., Korneliussen, T. S., et al. (2010) · Nature Genetics · doi:10.1038/ng.680 · Cited by 315
Self-citationZhu, H., Shah, S. P., Shyh‐Chang, N., Shinoda, G., Einhorn, W. S., Viswanathan, S. R., Takeuchi, A., Grasemann, C., Rinn, J. L., Lopez, M. F., et al. (2010) · Nature Genetics · doi:10.1038/ng.593 · Cited by 310
Evolutionary Adaptations to Dietary Changes
Luca, F., Perry, G. H., & Rienzo, A. D. (2010) · Annual Review of Nutrition · doi:10.1146/annurev-nutr-080508-141048 · Cited by 276
The Genome Response to Artificial Selection: A Case Study in Dairy Cattle
Flori, L., Fritz, S., Jaffrézic, F., Boussaha, M., Gut, I. G., Heath, S. C., Foulley, J., & Gautier, M. (2009) · PLoS ONE · doi:10.1371/journal.pone.0006595 · Cited by 222
Structure and biological actions of lactoferrin
Nuijens, J. H., van Berkel, P. H. C., & Schanbacher, F. L. (1996) · Journal of Mammary Gland Biology and Neoplasia · doi:10.1007/bf02018081 · Cited by 212
The pattern of linkage disequilibrium in German Holstein cattle
Qanbari, S., Pimentel, E. C. G., Tetens, J., Thaller, G. E., Lichtner, P., Sharifi, A. R., & Simianer, H. (2010) · Animal Genetics · doi:10.1111/j.1365-2052.2009.02011.x · Cited by 212
Self-citationExtent of Linkage Disequilibrium in Holstein Cattle in North America
Sargolzaei, M., Schenkel, F. S., Jansen, G. B., & Schaeffer, L. R. (2008) · Journal of Dairy Science · doi:10.3168/jds.2007-0553 · Cited by 203
Hou, L., Panthier, J., & Arnheiter, H. (2000) · Development · doi:10.1242/dev.127.24.5379 · Cited by 198
Modern taurine cattle descended from small number of near-eastern founders
Bollongino, R., Burger, J., Powell, A., Mashkour, M., Vigne, J.-D., & Thomas, M. G. (2012) · Molecular Biology and Evolution · doi:10.1093/molbev/mss092 · Cited by 188
CACNA1C (rs1006737) is associated with schizophrenia
Nyegaard, M., Demontis, D., Foldager, L., Hedemand, A., Flint, T. J., Sørensen, K. M., Andersen, P. S., Nordentoft, M., Werge, T., Pedersen, C. B., et al. (2010) · Molecular Psychiatry · doi:10.1038/mp.2009.69 · Cited by 182
A genome‐wide scan for signatures of recent selection in Holstein cattle
Qanbari, S., Pimentel, E. C. G., Tetens, J., Thaller, G. E., Lichtner, P., Sharifi, A., & Simianer, H. (2010) · Animal Genetics · doi:10.1111/j.1365-2052.2009.02016.x · Cited by 173
Self-citationQanbari, S., Gianola, D., Hayes, B. J., Schenkel, F. S., Miller, S. P., Moore, S. S., Thaller, G. E., & Simianer, H. (2011) · BMC Genomics · doi:10.1186/1471-2164-12-318 · Cited by 172
Self-citationThe Discovery of Single-Nucleotide Polymorphisms—and Inferences about Human Demographic History
Wakeley, J., Nielsen, R., Liu-Cordero, S. N., & Ardlie, K. (2001) · The American Journal of Human Genetics · doi:10.1086/324521 · Cited by 171
Self-citationGarrick, D. J., & Ruvinsky, A. (2014) · CABI eBooks · doi:10.1079/9781780642215.0000 · Cited by 156
Usefulness of Single Nucleotide Polymorphism Data for Estimating Population Parameters
Kuhner, M. K., Beerli, P., Yamato, J., & Felsenstein, J. (2000) · Genetics · doi:10.1093/genetics/156.1.439 · Cited by 151
Identification of Selection Signatures in Cattle Breeds Selected for Dairy Production
Stella, A., Ajmone‐Marsan, P., Lazzari, B., & Boettcher, P. J. (2010) · Genetics · doi:10.1534/genetics.110.116111 · Cited by 146
Kijas, J. M. H., Moller, M. J., Plastow, G. S., & Andersson, L. (2001) · Genetics · doi:10.1093/genetics/158.2.779 · Cited by 144
Dynamic evolution of bitter taste receptor genes in vertebrates
Dong, D., Jones, G., & Zhang, S. Y. (2009) · BMC Evolutionary Biology · doi:10.1186/1471-2148-9-12 · Cited by 141
Roles of endothelin signaling in melanocyte development and melanoma
Saldana-Caboverde, A., & Kos, L. (2010) · Pigment Cell & Melanoma Research · doi:10.1111/j.1755-148x.2010.00678.x · Cited by 136
Pausch, H., Flisikowski, K., Jung, S., Emmerling, R., Edel, C., Götz, K., & Fries, R. (2010) · Genetics · doi:10.1534/genetics.110.124057 · Cited by 128
Self-citationBaxter, L. L., Hou, L., Loftus, S. K., & Pavan, W. J. (2004) · Pigment Cell Research · doi:10.1111/j.1600-0749.2004.00147.x · Cited by 122
Hiraoka, S., Furuichi, T., Nishimura, G., Shibata, S., Yanagishita, M., Rimoin, D. L., Superti‐Furga, A., Nikkels, P. G. J., Ogawa‐Tominaga, M., Katsuyama, K., et al. (2007) · Nature Medicine · doi:10.1038/nm1655 · Cited by 117
Jensen, K., Günther, J., Talbot, R., Petzl, W., Zerbe, H., Schuberth, H., Seyfert, H., & Glass, E. J. (2013) · BMC Genomics · doi:10.1186/1471-2164-14-36 · Cited by 116
Recessive LAMC3 mutations cause malformations of occipital cortical development
Barak, T., Kwan, K. Y., Louvi, A., Demirbilek, V., Saygı, S., Tüysüz, B., Choi, M., Boyacı, H., Doerschner, K., Zhu, Y., et al. (2011) · Nature Genetics · doi:10.1038/ng.836 · Cited by 116
Imputation of high-density genotypes in the Fleckvieh cattle population
Pausch, H., Aigner, B., Emmerling, R., Edel, C., Götz, K., & Fries, R. (2013) · Genetics Selection Evolution · doi:10.1186/1297-9686-45-3 · Cited by 114
Self-citationSeven novel KIT mutations in horses with white coat colour phenotypes
Haase, B., Brooks, S. A., Tozaki, T., Burger, D., Poncet, P. A., Rieder, S., Hasegawa, T., Penedo, C., & Leeb, T. (2009) · Animal Genetics · doi:10.1111/j.1365-2052.2009.01893.x · Cited by 111
Utsunomiya, Y. T., O’Brien, A. M. P., Sonstegard, T. S., Tassell, C. P. V., do Carmo, A. S., Mészáros, G., Sölkner, J., & Garcia, J. F. (2013) · PLoS ONE · doi:10.1371/journal.pone.0064280 · Cited by 110
MacEachern, S., Hayes, B. J., McEwan, J. C., & Goddard, M. E. (2009) · BMC Genomics · doi:10.1186/1471-2164-10-181 · Cited by 103
Replication and meta-analysis of TMEM132D gene variants in panic disorder
Erhardt, A., Akula, N., Schumacher, J., Czamara, D., Karbalai, N., Müller‐Myhsok, B., Mors, O. N., Børglum, A. D., Kristensen, A. S., Woldbye, D. P. D., et al. (2012) · Translational Psychiatry · doi:10.1038/tp.2012.85 · Cited by 93
Jansen, S., Aigner, B., Pausch, H., Wysocki, M., Eck, S. H., Benet‐Pagès, A., Graf, E., Wieland, T., Strom, T. M., Meitinger, T., et al. (2013) · BMC Genomics · doi:10.1186/1471-2164-14-446 · Cited by 76
Self-citationSchlapbach, R., Spanaus, K., Malipiero, U., Lens, S. M. A., Tasinato, A., Tschopp, J., & Fontana, A. (2000) · European Journal of Immunology · doi:10.1002/1521-4141(200012)30:12 · Cited by 74
Pausch, H., Wang, X., Jung, S., Krogmeier, D., Edel, C., Emmerling, R., Götz, K., & Fries, R. (2012) · PLoS ONE · doi:10.1371/journal.pone.0036346 · Cited by 64
Self-citationSawatani, Y., Miyamoto, T. K., Nagai, S., Maruya, M., Imai, J., Miyamoto, K., Fujita, N., Ninomiya, K., Suzuki, T., Iwasaki, R., et al. (2008) · International Immunology · doi:10.1093/intimm/dxn082 · Cited by 38
Synaptic modulators Nrxn1 and Nrxn3 are disregulated in a Disc1 mouse model of schizophrenia
Brown, S. M., Clapcote, S. J., Millar, J. K., Torrance, H. S., Anderson, S. M., WALKER, R. E., Rampino, A., Roder, J., Thomson, P. A., Porteous, D. J., et al. (2011) · Molecular Psychiatry · doi:10.1038/mp.2010.134 · Cited by 36
Genetic aspects of domestication.
Lenstra, J. A., & Felius, M. (2014) · CABI eBooks · doi:10.1079/9781780642215.0019 · Cited by 34
Signatures of Selection in the Human Olfactory Receptor OR5I1 Gene
Moreno‐Estrada, A., Casals, F., Ramírez-Soriano, A., Oliva, B., Calafell, F., Bertranpetit, J., & Bosch, E. (2007) · Molecular Biology and Evolution · doi:10.1093/molbev/msm240 · Cited by 33
A mutation in NPAS3 segregates with mental illness in a small family
Yu, L., Arbez, N., Nucifora, L. G., Sell, G. L., DeLisi, L. E., Ross, C. A., Margolis, R. L., & Nucifora, F. C. (2013) · Molecular Psychiatry · doi:10.1038/mp.2012.192 · Cited by 32
Choi, J., Young, J. A. T., & Callaway, E. M. (2010) · Proceedings of the National Academy of Sciences · doi:10.1073/pnas.1006233107 · Cited by 31
Differences in Selection Drive Olfactory Receptor Genes in Different Directions in Dogs and Wolf
Chen, R., Irwin, D. M., & Zhang, Y. (2012) · Molecular Biology and Evolution · doi:10.1093/molbev/mss153 · Cited by 25
A Genomics Approach to the Detection of Positive Selection in Cattle:
Lynn, D. J., Freeman, A. R., Murray, C., & Bradley, D. G. (2005) · Genetics · doi:10.1534/genetics.104.039040 · Cited by 23
An Association of GRIK3 Ser310Ala Functional Polymorphism with Personality Traits
Minelli, A., Scassellati, C., Bonvicini, C., Pérez, J., & Gennarelli, M. (2009) · Neuropsychobiology · doi:10.1159/000202827 · Cited by 20
Sanecka-Duin, A., Ansems, M., Prosser, A., Danielski, K., Warner, K., den Brok, M. H., Jansen, B., Eleveld-Trancikova, D., & Adema, G. J. (2011) · BMC Immunology · doi:10.1186/1471-2172-12-57 · Cited by 18
Neprilysin, a Novel Target for Ultraviolet B Regulation of Melanogenesis Via Melanocortins
Aberdam, É., Auberger, P., Ortonne, J. P., & Ballotti, R. (2000) · Journal of Investigative Dermatology · doi:10.1046/j.1523-1747.2000.00075.x · Cited by 17
Different Evolutionary Histories of the Coagulation Factor VII Gene in Human Populations?
Athanasiadis, G. I., Esteban, E. M., Gayà‐Vidal, M., Dugoujon, J., Moschonas, N. Κ., Chaabani, H., Bissar‐Tadmouri, N., Harich, N., Stoneking, M., & Moral, P. (2009) · Annals of Human Genetics · doi:10.1111/j.1469-1809.2009.00557.x · Cited by 6
Cited by
Sorted by citations
Sequencing pools of individuals — mining genome-wide polymorphism data without big funding
Schlötterer, C., Tobler, R., Kofler, R., & Nolte, V. (2014) · Nature Reviews Genetics · doi:10.1038/nrg3803 · Cited by 803
Genome-Wide Scan for Adaptive Divergence and Association with Population-Specific Covariates
Gautier, M. (2015) · Genetics · doi:10.1534/genetics.115.181453 · Cited by 532
Prehistoric genomes reveal the genetic foundation and cost of horse domestication
Schubert, M., Jónsson, H., Chang, D., Der Sarkissian, C., Ermini, L., Ginolhac, A., Albrechtsen, A., Dupanloup, I., Foucal, A., Petersen, B., et al. (2014) · Proceedings of the National Academy of Sciences · doi:10.1073/pnas.1416991111 · Cited by 324
Self-citationPervasive introgression facilitated domestication and adaptation in the Bos species complex
Wu, D., Ding, X., Wang, S., Wójcik, J. M., Zhang, Y., Tokarska, M., Li, Y., Wang, M.-S., Faruque, O., Nielsen, R., et al. (2018) · Nature Ecology & Evolution · doi:10.1038/s41559-018-0562-y · Cited by 249
Self-citationPark, S. D. E., Magee, D. A., McGettigan, P., Teasdale, M. D., Edwards, C. J., Lohan, A. J., Murphy, A., Braud, M., Donoghue, M. T. A., Liu, Y., et al. (2015) · Genome biology · doi:10.1186/s13059-015-0790-2 · Cited by 234
Metadata
- Authors
- Qanbari, S., Pausch, H., Jansen, S., Somel, M., Strom, T. M., Fries, R., Nielsen, R., & Simianer, H.
- Affiliations
- University of Göttingen (DE)
- Technical University of Munich (DE)
- University of California, Berkeley (US)
- Helmholtz Munich (DE)
- Corresponding author
- Qanbari, Saber
- Venue
- PLoS Genetics
- Publisher
- Public Library of Science (PLoS)
- Published
- 2014-02-27
- Volume
- 10
- Issue
- 2
- Pages
- e1004148
- ISSN
- 1553-7390 (ISSN-L)
- 1553-7404
- PMC
- PMC3937232
- OpenAlex
- W2047669864
- Semantic Scholar
- b97615af7d0e16d1c4ecfdba9de4183b17efa05b
- Cited by
- 233
- References
- 79
- Citations by year
- 2026: 8 · 2025: 12 · 2024: 12 · 2023: 13 · 2022: 16 · 2021: 26 · 2020: 24 · 2019: 20 · 2018: 20 · 2017: 17 · 2016: 23 · 2015: 32 · 2014: 10
- FWCI
- 17.90
- Type
- journal article
- Language
- en
- Open access
- gold
- doi.org
- Locations
- PLoS Genetics (publishedVersion, cc-by)
- Europe PMC (PubMed Central) (publishedVersion, cc-by)
- PubMed Central (publishedVersion, cc-by)
- PubMed (publishedVersion)
- DOAJ (DOAJ: Directory of Open Access Journals) (submittedVersion)
- eScholarship (California Digital Library) (submittedVersion)
- eScholarship (California Digital Library) (submittedVersion, cc-by)
- Figshare (submittedVersion, cc-by)
- GoeScholar The Publication Server of the Georg-August-Universität Göttingen (Georg-August-Universität Göttingen) (submittedVersion, cc-by)
- OpenMETU (Middle East Technical University) (submittedVersion, cc-by-nc-nd)
- Site cant be reached (submittedVersion, cc-by)
- GRO (submittedVersion, cc-by)
- Repository for Publications and Research Data (ETH Zurich) (submittedVersion, cc-by)
- ETH Zürich Research Collection (cc-by)
- Funders
- Deutsche Forschungsgemeinschaft
- Bundesministerium für Bildung und Forschung (FKZ 0315528, 0315528)
- Topics
- Life Sciences › Biochemistry, Genetics and Molecular Biology › Genetics › Genetic and phenotypic traits in livestock
- Life Sciences › Biochemistry, Genetics and Molecular Biology › Genetics › Genetic Mapping and Diversity in Plants and Animals
- Life Sciences › Biochemistry, Genetics and Molecular Biology › Genetics › Genetic diversity and population structure
- Keywords
- cattle domestication, selective sweeps, Simmental cattle, coat color inheritance, KIT, MITF, MC1R, ErbB4, TAS2R16, linkage disequilibrium decay, genome-wide association study, body size, somatic cell count, breed formation
- MeSH terms
- Animals, Animals, Domestic, Breeding, Cattle, Genetics, Population, Haplotypes, Humans, Selection, Genetic, Linkage Disequilibrium, Polymorphism, Single Nucleotide, Genome-Wide Association Study
About these checks
Registry, retraction, Cites and statistics results are computed, not judged, with one exception: a printed reference that no index lists is read once by a model before it counts as a citation error. Claims are extracted by a model and kept only when their quote appears verbatim in the text; each cited source is then checked, with a model’s help, for whether it says what the claim relies on. Those verdicts can be wrong — read the claim’s quote and the cited source before relying on one.
Statistics and arithmetic are recomputed, not judged.
Confidence bands are shown only for fields calibrated on our annotated test set. None is calibrated yet, so no band is shown.
What counts as a claim ›How we measure confidence ›How we check this ›
Are you an author, or do you see a problem with this page? Request a review
