

The DOI matches its Crossref record; 40 of the 40 references it cites were found in a registry or an index.
SirT1 Regulates Energy Metabolism and Response to Caloric Restriction in Mice
Open accessAbstract
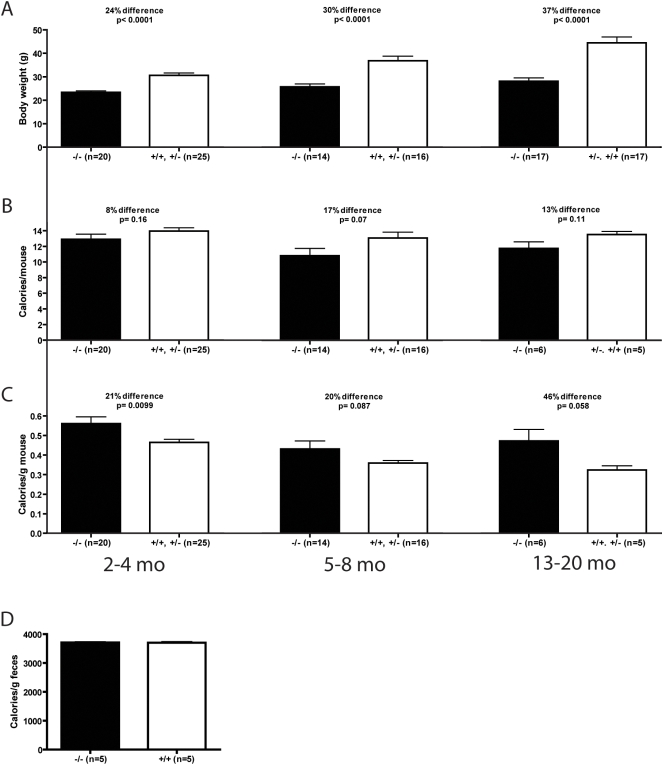
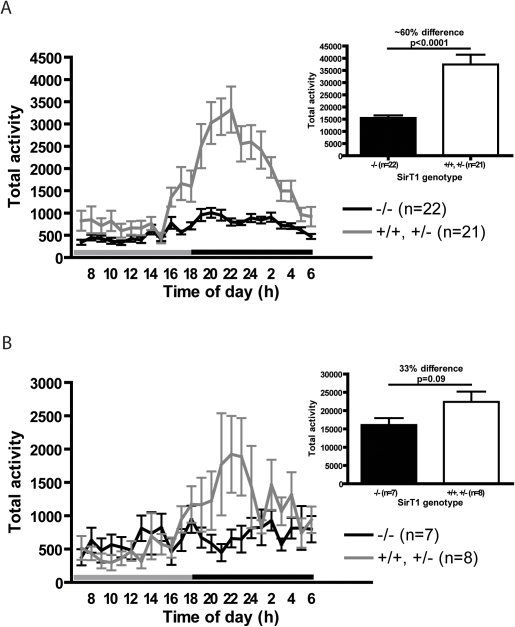
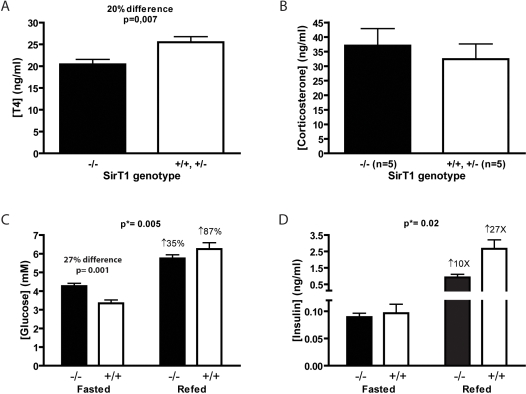
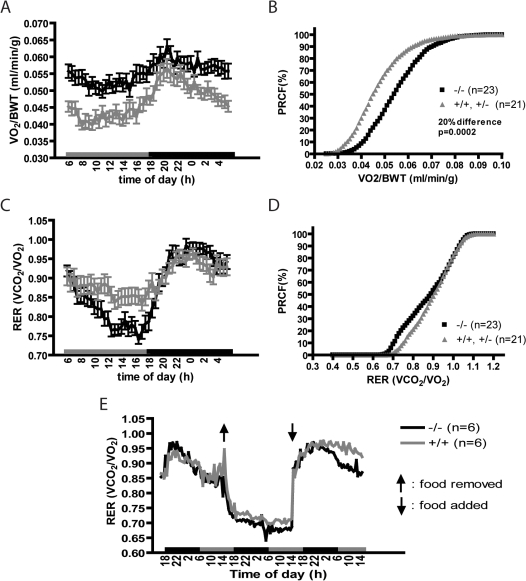
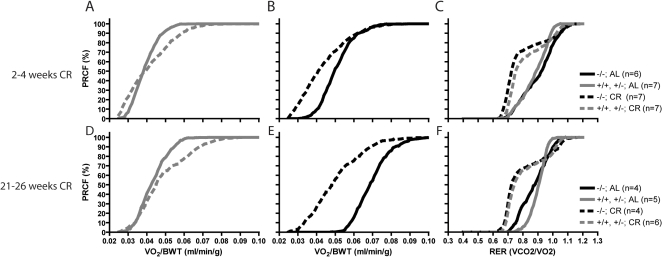
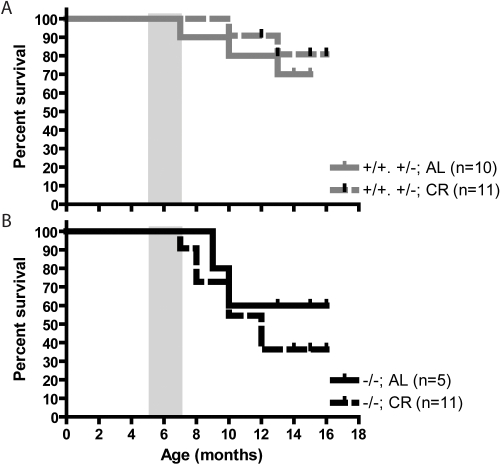
The yeast sir2 gene and its orthologues in Drosophila and C. elegans have well-established roles in lifespan determination and response to caloric restriction. We have studied mice carrying two null alleles for SirT1, the mammalian orthologue of sir2, and found that these animals inefficiently utilize ingested food. These mice are hypermetabolic, contain inefficient liver mitochondria, and have elevated rates of lipid oxidation. When challenged with a 40% reduction in caloric intake, normal mice maintained their metabolic rate and increased their physical activity while the metabolic rate of SirT1-null mice dropped and their activity did not increase. Moreover, CR did not extend lifespan of SirT1-null mice. Thus, SirT1 is an important regulator of energy metabolism and, like its orthologues from simpler eukaryotes, the SirT1 protein appears to be required for a normal response to caloric restriction.
Overview
The claims and statistics of this paper haven’t been checked yet.
Run the check — free, no account needed. It reads the open-access text and checks the sources it cites.
Integrity signals
Registry
Cites
Statistics
Figures
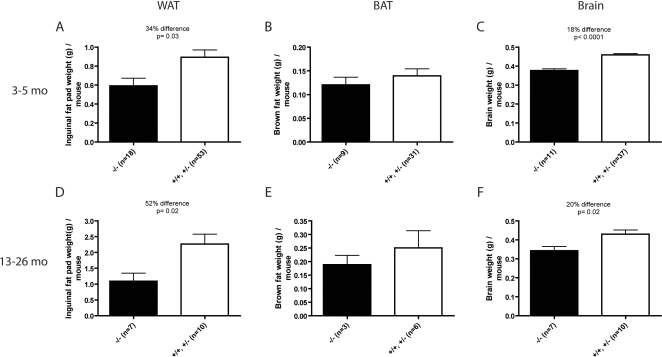
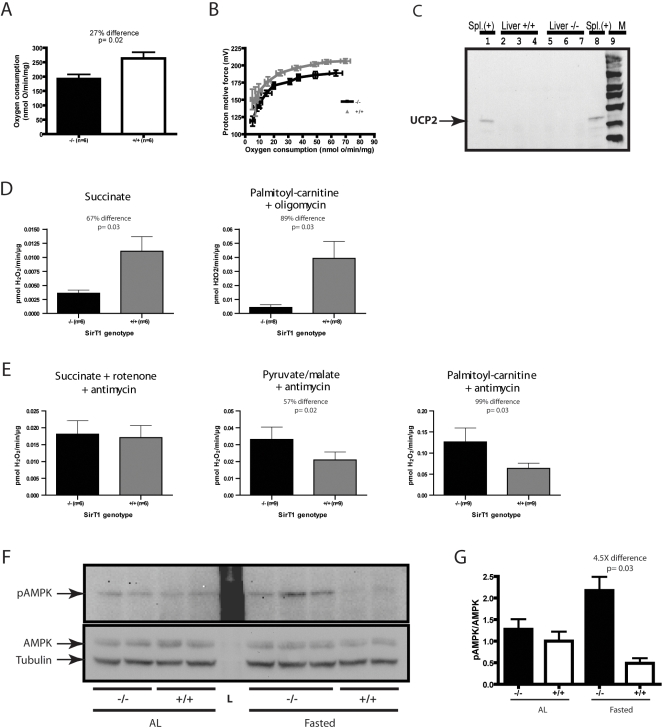
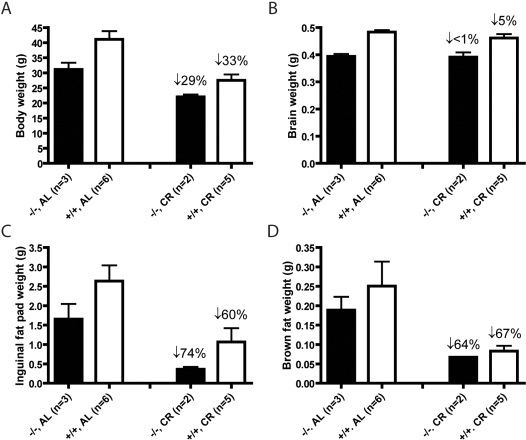
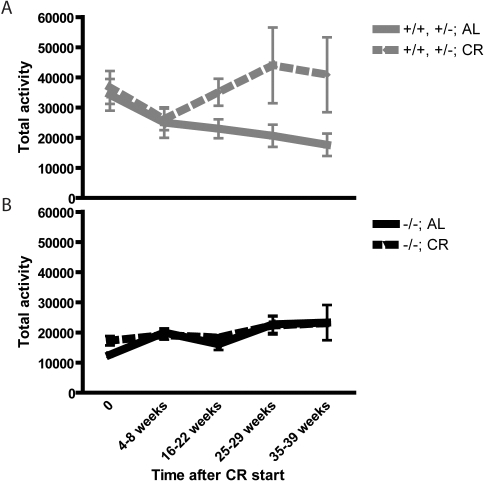
Verification
Claims the paper makes
The claims and statistics of this paper haven’t been checked yet.
Run the check — free, no account needed. It reads the open-access text and checks the sources it cites.
Claims other papers make about this one
Each is checked against this paper’s own text: does it say what the citing paper says it does?
In the citing paper
“Homologues of Sir2 (called sirtuins) have subsequently been shown to mediate some of the effects of caloric restriction in flies (82) and mammals (83,84).”
From Neural mechanisms of ageing and cognitive decline (2010) · cites this paper as [83]
Self-check
Percentages, sums and reported differences re-computed from the paper’s own numbers.
The self-check needs the paper’s full text.
Citations
Cites
Transcriptional silencing and longevity protein Sir2 is an NAD-dependent histone deacetylase
Imai, S.-I., Armstrong, C. M., Kaeberlein, M., & Guarente, L. (2000) · Nature · doi:10.1038/35001622 · Cited by 3,510
Nutrient control of glucose homeostasis through a complex of PGC-1α and SIRT1
Rodgers, J. T., Lerin, C., Haas, W., Gygi, S. P., Spiegelman, B. M., & Puigserver, P. (2005) · Nature · doi:10.1038/nature03354 · Cited by 3,160
Kaeberlein, M., McVey, M., & Guarente, L. (1999) · Genes & Development · doi:10.1101/gad.13.19.2570 · Cited by 2,253 · cited 1×
“In yeast, worms and flies, an extra copy of the sir2 gene or its orthologue increases lifespan by 18% to 50% [4–6] whereas a deletion of the gene, in yeast, reduces lifespan [4].”
BackgroundSirt1 promotes fat mobilization in white adipocytes by repressing PPAR-γ
Picard, F., Kurtev, M. V., Chung, N., Topark‐Ngarm, A., Senawong, T., de Oliveira, R. M., Leid, M. E., McBurney, M. W., & Guarente, L. (2004) · Nature · doi:10.1038/nature02583 · Cited by 1,943
Self-citationCalorie restriction promotes mammalian cell survival by inducing the SIRT1 deacetylase
Cohen, H. Y., Miller, C., Bitterman, K. J., Wall, N. R., Hekking, B., Kessler, B., Howitz, K. T., Gorospe, M., de Cabo, R., & Sinclair, D. A. (2004) · Science · doi:10.1126/science.1099196 · Cited by 1,924
Lin, S.-J., Defossez, P.-A., & Guarente, L. (2000) · Science · doi:10.1126/science.289.5487.2126 · Cited by 1,775
Increased dosage of a sir-2 gene extends lifespan in Caenorhabditis elegans
Tissenbaum, H. A., & Guarente, L. (2001) · Nature · doi:10.1038/35065638 · Cited by 1,603
Phylogenetic classification of prokaryotic and eukaryotic Sir2-like proteins
Frye, R. A. (2000) · Biochemical and Biophysical Research Communications · doi:10.1006/bbrc.2000.3000 · Cited by 1,409
Sir2 mediates longevity in the fly through a pathway related to calorie restriction
Rogina, B., & Helfand, S. L. (2004) · Proceedings of the National Academy of Sciences · doi:10.1073/pnas.0404184101 · Cited by 1,361
Metabolic control of muscle mitochondrial function and fatty acid oxidation through SIRT1/PGC‐1α
Gerhart‐Hines, Z., Rodgers, J. T., Bare, O., Lerin, C., Kim, S., Mostoslavsky, R., Alt, F. W., Wu, Z., & Puigserver, P. (2007) · The EMBO Journal · doi:10.1038/sj.emboj.7601633 · Cited by 1,294
Cited by
Sorted by citations
Items 401–444 of 444
Sirtuins as Markers of Bone Disease: A Focus on Osteoarthritis and Osteoporosis
Abed, É., Reboul, P., & Lajeunesse, D. (2016) · Exposure and Health · doi:10.1007/978-94-007-7745-3_41-1 · Cited by 1
Miller, G. S. (2010) · Human Biology · Cited by 1
Smith, D. L., & Smith, J. S. (2009) · Springer eBooks · doi:10.1007/978-90-481-3465-6_6 · Cited by 1
Study on the Role of SIRT2 in Stem Cell Aging and Chronic Inflammation
Luo, H. (2017) · eScholarship (California Digital Library) · Cited by 1
Sorokin, A. (2010) · Faculty Opinions – Post-Publication Peer Review of the Biomedical Literature · doi:10.3410/f.4568984.4439091 · Cited by 1
Pak, H. H., Sjulstok, E., Palluth, L., & Takahashi, J. S. (2026) · bioRxiv (Cold Spring Harbor Laboratory) · doi:10.64898/2026.03.03.709429 · Cited by 1
An investigation of ageing-related genomic effects of resveratrol
Alatawi, F. S. (2013) · Cited by 1
Aging and the Uncertain Roles of Sirtuins
Dice, J. F. (2009) · Wiley eBooks · doi:10.1002/9780470747919.ch57
Metabolic and cellular effects of calorie restriction and whey proteins in experimental obesity
Kurki, E. (2013) · Työväentutkimus Vuosikirja
Lempiäinen, J. (2014) · Työväentutkimus Vuosikirja
Sirtuins as Potential Drug Targets for Metabolic Diseases
Tong, Q. (2011) · Wiley eBooks · doi:10.1002/9780470910016.ch15
Rizki, G. (2011) · eCommons (Cornell University)
Analysis of FOXO transcriptional networks
van der Vos, K. E. (2007) · Utrecht University Repository (Utrecht University)
The Influence of Biological Ageing in the Pathogenesis of Colorectal Cancer
Maxwell, F. (2013) · Enlighten: Theses (The University of Glasgow)
Fu, Z. D. (2013) · KU ScholarWorks (The University of Kansas)
Estudo dos efeitos metabólicos e redox de dietas intermitentes
de Freitas, B. C. (2015) · Digital Library of Theses and Dissertations (Universidade de São Paulo) · doi:10.11606/t.46.2015.tde-22092015-081157
Wirkung von Zigarettenrauch auf Präadipozyten als potentielle systemische Modifikatoren einer COPD
München, L.-M.-U., & Nowak, D. (2010)
Characterization of Sirt2 using conditional RNAi in mice
Reiss, M. (2011) · Kölner Universitäts PublikationsServer (Universität zu Köln)
Nuclear Chromatin Factors Defining Mitochondrial Bioenergetics
Puigserver, P., & Guarente, L. (2012) · Oxidative stress and disease · doi:10.1201/b12308-15
A Role for Sirtuins in Maintaining Mammalian Lifespan and Healthspan
Giblin, W. (2017) · Deep Blue (University of Michigan)
Short-term Calorie Restriction Improves Post-ischemic Recovery in the Spontaneously Hypertensive Rat
Lozyk, M. D. (2012) · ERA: Education and Research Archive (University of Alberta) · doi:10.7939/r3ms8d
Nahle, A. (2016) · TSpace (University of Toronto)
Eating Habits and Their Impact on Aging and Cancer
Marongiu, F., Serra, M., & Laconi, E. (2019) · Royal Society of Chemistry eBooks · doi:10.1039/9781788016506-00230
Sirtuins and life span extension
Lee, S., & Min, K. (2021) · Elsevier eBooks · doi:10.1016/b978-0-12-814118-2.00006-9
Sirtuins as key players in aging and kidney dysfunction
Perico, L., & Benigni, A. (2021) · Elsevier eBooks · doi:10.1016/b978-0-12-814118-2.00013-6
Resveratrol and brain mitochondria
Coelho, P., & Rego, A. C. (2021) · Elsevier eBooks · doi:10.1016/b978-0-12-821562-3.00018-6
子宮内膜癌細胞株における抗癌剤感受性の検討(子宮体部悪性腫瘍VI, 第57回日本産科婦人科学会学術講演会)
茂木, 真., 新美, 茂., 高倉, 聡., 柳田, 聡., 岡本, 愛., 落合, 和., & 田中, 忠. (2005) · 日本産科婦人科學會雜誌
Ischemic Preconditioning-Mediated Signaling Pathways Leading to Tolerance Against Cerebral Ischemia
Narayanan, S., Neumann, J. T., Morris-Blanco, K. C., Pérez‐Pinzón, M. A., & Lin, H. W. (2012) · Springer eBooks · doi:10.1007/978-1-4419-9695-4_20
Sirtuins as Markers of Bone Disease: A Focus on Osteoarthritis and Osteoporosis
Abed, É., Reboul, P., & Lajeunesse, D. (2017) · Biomarkers in disease · doi:10.1007/978-94-007-7693-7_41
Blood Bioenergetic Biomarkers in Alzheimer’s Disease APOE ε4-CarriersPreprint
Wilkins, H., Manley, S., Wang, X., Menta, B. W., Koppel, S. J., Bothwell, R. J., Becker, A. M., Anderson, H., Schwartz, E., Burns, J. M., et al. (2020) · doi:10.21203/rs.3.rs-37441/v1
Tulp, O. L. (2024) · Endocrinology&Metabolism International Journal · doi:10.15406/emij.2024.12.00359
Characteristics of gastric emptying on glycemic responses in the T2DM-SHR/Ntul//-cp (Corpulent) rat
Tulp, O. L. (2025) · Gastroenterology & Hepatology Open Access · doi:10.15406/ghoa.2025.16.00603
Research progress on histone modifications and anti-aging interventions
Wang, R., Li, T., & Yang, N. (2025) · Scientia Sinica Vitae · doi:10.1360/ssv-2025-0106
Piergentili, A., Saraceni, P. R., Demurtas, O. C., Benassi, B., & Arcangeli, C. (2025) · International Journal of Molecular Sciences · doi:10.3390/ijms26157575
The epigenetic regulation of cell cycle and chromatin dynamic by sirtuins
Martínez‐Redondo, P. (2014) · LA Referencia (Red Federada de Repositorios Institucionales de Publicaciones Científicas)
Guo, F., Xu, F., Li, S., Zhang, Y., Lv, D., Zheng, L., Gan, Y., Zhou, M., Zhao, K., Xu, S., et al. (2024) · Figshare · doi:10.6084/m9.figshare.26670045
Implication du gène Dicer1 dans le vieillissement et ses pathologies chez la souris
de Cauwer, A. (2020) · theses.fr (ABES) · doi:10.70675/22c08094z1342z429fza3fez5ff6b78d1481
Coevolution of sociality and ageing in animal societies
Quque, M. (2020) · theses.fr (ABES) · doi:10.70675/6bc5d1cdz71abz4041z846bzdf36af17baa8
Circular RNAs and SIRT1 in post-transcriptional regulation and human disease
Vakili, O., Yousefi, Z., Igder, S., Yarahmadi, S., Gheibi, M., Taghizadeh, M., Moshtaghian, M. S., Sartavi, F., Yahyazadeh, S., Shafiee, S. M., et al. (2026) · Biochimica et Biophysica Acta (BBA) - Molecular Basis of Disease · doi:10.1016/j.bbadis.2026.168451
Bartoszewicz, M., & Niemczyk, M. (2026) · Aging · doi:10.18632/aging.206426
BindingDB Entry 50039023: Identification and characterization of novel sirtuin inhibitor scaffolds.
BindingDB (2012) · UC San Diego · doi:10.7270/q21v5fwg
Bruss, M. D. (2011) · eScholarship (California Digital Library)
Metadata
- Authors
- Boily, G., Seifert, E. L., Bevilacqua, L., He, X. H., Sabourin, G., Estey, C., Moffat, C., Crawford, S., Saliba, S., Jardine, K., Xuan, J., Evans, M., Harper, M.-E., & McBurney, M. W.
- Affiliations
- University of Ottawa (CA)
- Corresponding author
- McBurney, Michael W.
- Venue
- PLoS ONE
- Publisher
- Public Library of Science (PLoS)
- Published
- 2008-03-12
- Volume
- 3
- Issue
- 3
- Pages
- e1759
- ISSN
- 1932-6203 (ISSN-L)
- PMC
- PMC2258149
- OpenAlex
- W2035543709
- Cited by
- 444
- References
- 40
- Citations by year
- 2026: 4 · 2025: 6 · 2024: 7 · 2023: 8 · 2022: 12 · 2021: 16 · 2020: 17 · 2019: 22 · 2018: 20 · 2017: 23 · 2016: 27 · 2015: 25 · 2014: 34 · 2013: 41 · 2012: 29
- FWCI
- 20.45
- Type
- journal article
- Language
- en
- Open access
- gold
- doi.org
- Locations
- PLoS ONE (publishedVersion, cc-by)
- PubMed Central (publishedVersion, cc-by)
- PubMed (publishedVersion)
- DOAJ (DOAJ: Directory of Open Access Journals) (submittedVersion, cc-by-sa)
- Funders
- Canadian Diabetes Association
- University of Guelph
- Canadian Institutes of Health Research
- Topics
- Health Sciences › Medicine › Geriatrics and Gerontology › Sirtuins and Resveratrol in Medicine
- Life Sciences › Biochemistry, Genetics and Molecular Biology › Aging › Genetics, Aging, and Longevity in Model Organisms
- Life Sciences › Biochemistry, Genetics and Molecular Biology › Molecular Biology › Metabolism, Diabetes, and Cancer
- Keywords
- SIRT1, sirtuins, caloric restriction, energy metabolism, hypermetabolism, mitochondrial efficiency, liver mitochondria, lipid oxidation, metabolic rate, physical activity, lifespan
- MeSH terms
- Animals, Energy Intake, Calorimetry, Energy Metabolism, Hormones, Mitochondria, Liver, Reactive Oxygen Species, Mice, Knockout, Sirtuins, Mice, Sirtuin 1
About these checks
Registry, retraction, Cites and statistics results are computed, not judged, with one exception: a printed reference that no index lists is read once by a model before it counts as a citation error. Claims are extracted by a model and kept only when their quote appears verbatim in the text; each cited source is then checked, with a model’s help, for whether it says what the claim relies on. Those verdicts can be wrong — read the claim’s quote and the cited source before relying on one.
Statistics and arithmetic are recomputed, not judged.
Confidence bands are shown only for fields calibrated on our annotated test set. None is calibrated yet, so no band is shown.
What counts as a claim ›How we measure confidence ›How we check this ›
Are you an author, or do you see a problem with this page? Request a review
